Research Article: 2021 Vol: 24 Issue: 6S
Detection of Targeted Region Using Deep Learning-Based Multiscale Alexnet CNN Scheme for Hyperspectral Satellite Image
Eman Abdullah Aldakheel, Princess Nourah bint Abdulrahman University
Mohammed Zakariah, King Saud University Riyadh
Abstract
In remote sensing, segmentation and classification of satellite images are a demanding task that attributes various kinds of detecting the targeted regions. The accurate segmentation of the targeted area is considered a crucial portion of seeing several geographical positions and locations. In turn, the classification and segmentation technique enhances the detection rate and accurately recognizes the target regions with reduced execution time. A deep learning-dependent automatic detection, segmentation, and classification of satellite images are conducted in this process, employing artificial intelligence methods. At first, the input image is preprocessed, segmented using semantic-ROI segmentation, and classified using the Multiscale Alex Net CNN classifier method. The semantic-based ROI segmentation stage is employed for extracting the regions. By using a multilinear spectral decomposition-based extraction approach, the spatial information is removed. Then the deep learning-based Multiscale Alex Net classifier effectively classifies the satellite images. The dataset employed are Indian Pines, Pavia, and Salinas. The presented approach performance is estimated and the outcomes attained are evaluated to prove the efficiency of the proposed system.
Keywords
Remote Sensing, Satellite Images, Multi-Scale Alex Net CNN Classifier, Semantic-Based ROI Segmentation, Multilinear Spectral Decomposition-Based Extraction
Introduction
Nowadays, researchers have concentrated on classifying images worldwide, which is a powerful technology for the pattern recognition and computer vision field. Typically, satellite images in digital form are processed to attain the target regions (Zhang, 2017). A technique of image processing was employed for regaining the precise data set from images that were kept. Therefore, this method visually improved the perception and intended for repairing or modifying the image, which depends on the blurring, image deformation, or image deterioration (Chen, 2017). Several techniques were available for image analysis, and they rely on some desired problem's requirements (Huang, 2020; Kamir, 2020; Avolio, 2017). The image classification and segmentation algorithms were conducted in many thematic groups of image regions. Image classification forms are characterized as quarter sets in dissimilar viewpoints similar to clustering of the image depending on edge-based, region, and model-driven (Soldin, 2018). Because of this modest code alike quick and robust effect of classification, CNN is widely employed. Furthermore, the images are generally classified through a CNN on it's own; it is feasible for getting fixed in local maximum, the boundaries blurring through bad visual outcome.
The primary problems are capturing images yet similarly to process the captured information quickly and promptly broadcast them at the detailed detection of a target, and their accuracy assesses the classification. The technique for a problem associated with the target recognition is to separate several scene components and distinguish one fascinating one from the enduring. Still, the classification approach is a complex task and a legal concern for detecting robust satellite target systems. Moreover, there will be some problems in recognizing the guards and clutter region. Hereafter, there is a necessity to discourse the satellite image classification issues by an effective structure.
Problem Statement
The major problems are acquiring the pictures and processing and classifying the collected information quickly and accurately in the required accurate detection and categorization. For any satellite target identification challenge, the basic strategy is to distinguish between distinct components and interest the rest from the picture. The classification of the satellite target detection system is still a complex and valid operation. The guards and debris region are tough to find. Therefore, an effective method is needed to solve all problems with the categorization of satellite images.
Objective
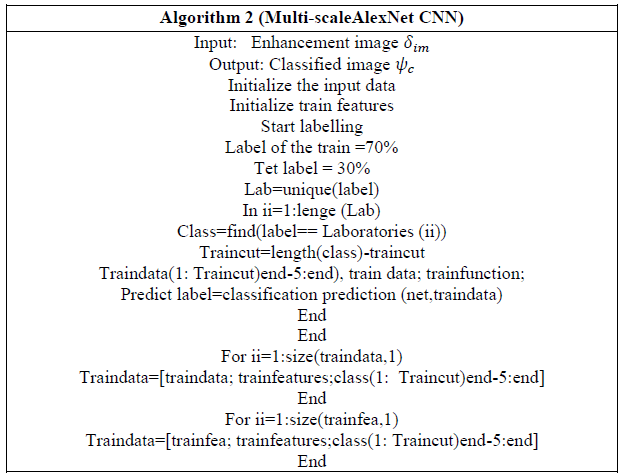
Therefore, this document suggested a new multiscale AlexNET CNN classification method that classifies the pixels based on combined spectral and contextual data. Consequently, the classification result is enhanced in comparative terms with other traditional classification algorithms. The performance with hyperspectral images of the recommended method has been improved, and its correctness has been validated. This study makes the key contributions as follows.:
1. For information extraction from the satellite images, multilinear spectral decomposition was used.
2. The multiscale Alex NET CNN is used to classify low-resolution satellite images, distinguish them from the band values into features, and preliminarily extract the band selection values.
Organization
Section II examines the different comprehensive explications of the conventional approaches used so far. The remaining part of the manuscript is systematized as indicated. The suggested method is explained in full in Section III. Section IV shows the performance analysis of the system. Finally, section V concludes the general flow of the proposed approach.
Related Works
This section is a detailed review of various existing techniques employed so far. In this work (Cho, 2018), the authors have projected a target recognition method and a feature-based additional CNN system intended for remote sensing images. The projected CNN-dependent technique had two steps. Initially, the features were mined through operations of max-pool and average-pooling. At that time, the components are accomplished through fully connected layers. The proposed method produces the accuracy of 94.38% recognition for ten classes of armed MSTAR dataset targets.
In another work (Chen, 2016) the authors have suggested classifying targets using the deep convolutional neural network from the input images through only convolutional layers deprived of employing any fully connected layers. The authors in this work (Lin, 2017) have presented an architecture with limited training data categorized as a deep convolutional thoroughfare unit system for classifying a target in remote sensing images. In similar work (Fedorchenko, 2019) the authors have deliberated the recognition of automatic target regions in satellite images using two different machine learning processes, which offer a high classification accuracy rate. Initially, a support vector machine was employed with optimization to develop a proper local set of features. At that time, a different convolutional neural network manner was projected together approaches are examined with applied features.
This work (Al-Mufti, 2018) introduced a pre-trained neural convolutionary network (CNNs) for ATR (automatic target recognition). The primary disadvantage of ATR is that one restricted data set is used for training and now deep learning. AlexNet was used for extracting characteristics, and after that, the output characteristics were trained using the SMS classifier. The schema of the suggested mechanism was built using a pre-trained CNN viz. Alex Net. The pretrained presentation gives an accuracy of around 99.4 percent of the three categories.
This work (Gorovyi, 2017) projected the multi-feature dependent CNN for recognizing the targets from input images. Initially, features were extracted from satellite images and aggregated with complementary relationships to the single column vector. Eventually, the target was recognized through fully connected networks. Thus, the anticipated technique can identify the MSTAR dataset images target further accurately than the previous prevailing approaches deprived of any preprocessing method and data about posture.
The technique presented in this work (Al-Mufti, 2019) deals with the ATR problem (Automatic Target Recognition). The planned structure is based on a transfer-learning method, in which three different, pre-trained CNNs were used as extractors of function in mixtures with an SVM (Support Vector Machine classifier). The used CNNs are VGG16, Alex Net & Google Net on this broadside. Here, it was found that the AlexNet delivers the most outstanding performance accuracy at 99.27 percent. The concert of these three CNNs linked to ATR.
The authors (Kwak, 2018) proposed a speckle-noise-invariant CNN with regulation for reducing noise in the images and targets. Initially, the despeckling image was accomplished using the enhanced Lee sigma filter for extraction of the feature. At that time, targets were recognized from the despeckled images using training CNN. The CNN proposed with regularization technique enhances the accuracy of recognition on comparing prevailing conservative approaches.
In another work (Sehgal, 2019) projected (recurrent neural networks) states once electromagnetic waves are on the targets, sprinkles of the energy arise from a radar incident, and this dispersed signal is established as the target radar signature. The significant extracted feature from the signature radar was the radar cross-section (RCS) that was employed for target recognition. These values of RCS for every azimuth set and elevation angles turn out to be datasets for the RNN(recurrent neural network). The RNN proposed method gives the accuracy of classification as 93%. (He, 2017) offered a new technique for the recognition of target through a convolutional neural network (CNN). Initially, the MSTAR dataset image targets were classified through the convolutional network. At that time, the features were mined from the convolutional layer output, and the target position was located in the image using clustering and max sampling. The methodology proposed not only to understand the detection of target efficiently but also to offer ratified accuracy in categorizing the task.
The remote sensing image classification is a standard remote sensing image application (Shen, 2018). To improve the performance of remote sensing image classifiers, multiple classifiers combinations were employed for the images Landsat-8 Operational Land Imager categorizing (Landsat-8 OLI). Some variety of classifier algorithms and methods was observed. The cooperative classifier encompassing five classifiers associates is made. Each classifier outcome member was evaluated. The voting strategy is examined to participate in the outcomes of classifier member classification. The outcomes demonstrate that the classifiers completely have dissimilar concerts, and the multiple classifiers combination distributes improved performance on associating the single classifier and reaches global higher accuracy of classification. (Khan, 2019) assessed pre-trained Convolutional Neural Networks for extracting features accompanied by SVM classifier for the recognition of Target and thus proved that Alex net offers better accuracy of recognition on comparing VGGNet and Google net CNNs.
The investigation was supported on (Ye, 2017) concerning multiple-flexible feature learning-hashing content destined for LSRSIR that acquired multiple features that were harmonizing as the input and acquires the feature mapping hybrid approach that schemes the remote sensing images numerous features to the low-dimensional binary feature representation (Häberle, 2019). Moreover, the representations of feature compressed could be directly used in LSRSIR with the hamming distance assistance restrained. To demonstrate the presented learning of hashing multiple feature method superiority, the offered approach was related to traditional techniques for the two-publicly datasets available the same as large-scale remote sensing image datasets.
Proposed Work
This section is a detailed illustration of the proposed system. The overall flow of the proposed system is shown below in Figure 1.

Figure 1: Flow of Proposed Strategy
Preprocessing of Input Satellite Image Dataset
After the collection of the input image, preprocessing is an essential part of classifying the satellite image. Preprocessing is to confirm the reliability and accessibility of these input images. Each step is essential to reduce the image processing workload. Pre-processing is done using filters and histogram equalization techniques to detect unintentional errors that can impair the ability of the artifact to prevent noise. Here we can extract an abnormality in the area from the satellite image. A nonlinear optical filtering system called an adaptive median filter is occasionally used to remove noise from an image or signal. The main advantage of removing noise reduction is an archetypal preprocessing step for better performance.
It is the preliminary phase to be conducted in the framework suggested. The background noise is eliminated. Salt and paper, as well as Gaussian noises, are present in satellite images. Preprocessing is performed to delete these unnecessary pixels. It conducts an unnecessary error identification preprocessing using filters and histograms. The noises can be extracted here in this phase with the satellite picture. The adaptive filter is typically used to isolate noise from a picture or signal as a nonlinear optical filter. Noise reduction is a typical method for enhancing efficiency. Pre-processing is performed to improve the contrast of the satellite image. The availability of random noise such as Gaussian noise is effective with Adaptive Weiner Filter (AWF). It is an easy method to discover the safest way to restore a bright signal. For productive processing of picture frames, and the proposed research uses AWF. The AWF is used to smooth out the less variant image. Typically, histograms are equalized to improve the consistency of the image. Histogram equalization is a computerized process used to increase the image contrast. The most crucial sensitivity values are significantly increased, i.e., the spectrum of image strength is widened. It makes a less local comparison to improve ties between regions. Therefore, the average picture contrast is increased after histogram equalization.
Let p denote the normalized histogram for each possible intensity. Hence,
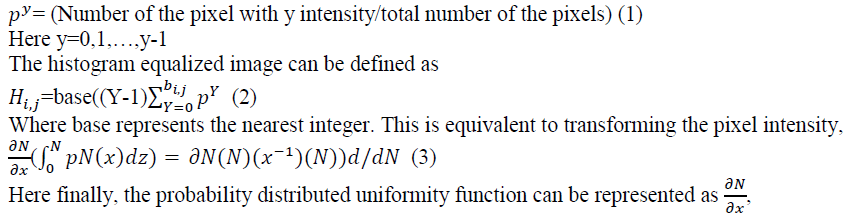
During preprocessing, it blocks the greyscale channel. Typically, poor contrast occurs with satellite objects. Preprocessing is achieved to increase the greyscale channel's contrast. Typically, histogram equalization is done to the improvement of the image quality. Histogram equalization is a method used to escalation the contrast of images. It is achieved by effectively growing the most normal intensity values, i.e., by expanding the picture intensity range. As a result, the distinction between areas is rendered less local in contrast. Average image contrasts are increased by following the histogram equalization, which requires intensity adjustment, thus increasing contrast, indicated by P as a uniform histogram of an image for each possible intensity.
Histogram equalization (P) = Intensity sum of the pixel average number (4)
This method can be used for improving image quality with histogram equalization. Then, by changing the greyscale values, the sensitivity may then be calibrated.
Semantic-Based ROI Segmentation
Boundary detection is an image border process. Edge detection is a crucial step in understanding image characteristics. Edges have significant features and important information. The image size is decreased considerably, and material that can be deemed less significant is filtered out, thus retaining essential structural properties of an image. Because borders frequently appear at image locations with object boundaries, edge detection is widely used for segmentation images when images are divided into areas with various objects. This can be used to improve the satellite image in particular. In the first derivative of the image, the gradients approach senses the limit of the edge is minimal. By the appropriate thresholding, sharp edges can be separated. Here the region of interest can be divided. Here, for calculating its dimension and the limits of a target specified on an image or in a volume. The segmented image at frame 0 and frame 30 is shown in Figures 3 and 4 correspondingly.
They are using the regional mechanism that combines pixels or sub-regions into broader areas. Pixel aggregation is the simplest of these methods, which begin with a collection of "seed" points and from them grow regions when the next pixels with the same features (for example, texture and color) are attached to each end of seed. This segmentation approach looks at neighboring pixels of initial seeds and determines whether neighbors to the region should be added.
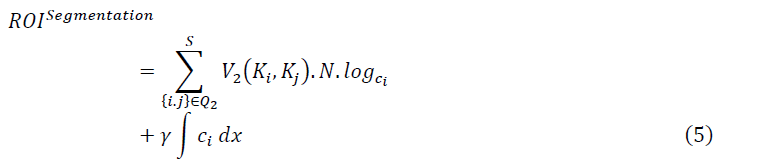
Where ROIsegmentation is the watershed segmentation, V2 is the velocity gradient, Ki, Kj was the low and high pixel value, N represents the number of pixel blocks in the image, log ic represents the spatial size of the image, γ represents the frequency coefficient of an image, ci represents the distance of the pixels.
Extraction of Spatial Information using Multi Linear Spectral Decomposition
The spectral information is then decomposed based on matrix wise. Since it is a multi linear based process, it will apply to nonlinear data too. There were various regions and intensity levels in multi linear data. The data that are split matrix-wise are then decomposed. In the multi linear matrix decomposition, the input is the extracted pattern. In this, the pattern-based covariance computation is performed by estimating the high-intensity region, thereby identifying the orthogonal component. In case the repeated element processed is not satisfied. The process is repeated, and if the condition satisfies, then the matrix decomposition is attained based on run-length encoding is performed. The pixel group matrix is obtained by intersecting two rows of RLC vectors.
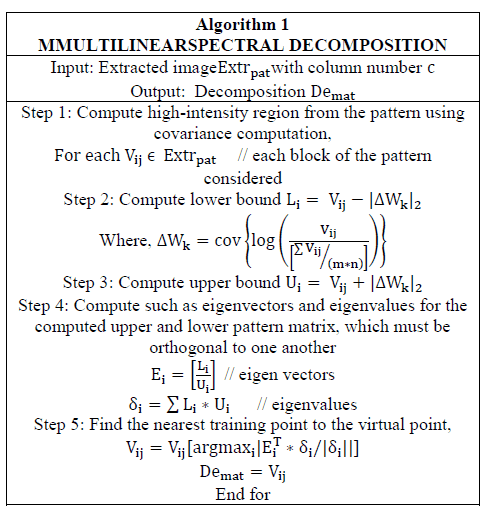
Initially, the covariance computation is made by estimating the high-intensity region from the pattern for each block of the considered pattern. The lower bound analysis is made by means of the equation provided, followed by upper bound computation. The eigenvectors and eigenvalues are computed for the upper and lower pattern matrix, which should be orthogonal to one another. Finally, the nearest training point to the virtual point is found.
Multi-scale AlexNet CNN classification
The input chosen is used for the diseased signal classification to estimate the Residual connection-based Alex net CNNmodeltechnique. The unexpected value is calculated by the distribution system, this methodology is based on random selection of variables. The main purpose is to detect the background information and then monitoring the appropriate information, this is done by random process. This objective is attained by having the essential daily intervals. The probability of users and uncertain value is observed with specification. Suppose that inception V4can compute the probability distribution of the vector. It is determined by multiplying the dispersed probability value and dividing the result by the standard constant.
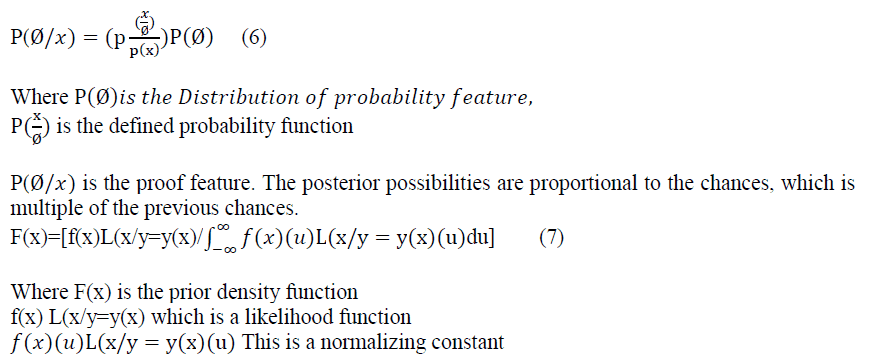
Essentially, the probability equation was used to plot out the function's abnormality. The irrelevant value was then calculated after determining the prior likelihood. Following that, the abnormal value can be computed.
The irrelevant values of the images are monitored, then the satellite images are classified. The major contribution is the multiscale Alex net CNN involvement which consists of convolution layers. These layers play an important role for training the model for the input images. The low-level features are removed based on the usage of these layers. The major issue is the rotation of the image wherein convolution operation is invariant in general case but exception for rotation images. Another layer is the pooling which helps in reducing the size of the dataset. The proposed framework for classifying the images include fully connected structure along with neural networks. The classifier training comprises of two steps: first one is the feed and the other is the reverse propagation. The feed forward network is responsible for calculating the network error by comparing the difference between the network output which is base do input image and the actual output label in the network. In the context propagation process, the network error will determine the parameters gradient and further this gradient is upgraded for every weight in matrix. The classification task is executed by governing the large data with the help of pre-trained systems. The classification accuracy is influenced significantly by the intensity of the classifier and appropriate information is detected based on efficiency because this results in the increase in the depth of the classifier, as a result the error in classification also reduces. The target is graded according to the probabilities. The multiscale Alex net CNN model method enables the discrepancy between a single variable and one or more different variables to be measured.
Performance Analysis
Experiments for performance assessment are performed in this section. In the MATLAB environment, the proposed scheme is implemented. Comparing the other existing approaches, the proposed method achieves a significant increase with less workload and is easily managed by a consumer. The data sets have been collected from the Bhuvan (lit: Earth) mapping-based content prepared by Indian Space for experimenting with the results. Research Organization as shown in the following figure, respectively. About 100 input images were taken. A web-based service that enables users to access a range of the Indian space research organization's mapping-based information. Bhuvan (lit: Earth) The scope of the service is mainly limited to Indian limits and is accessible in four regional languages. The material includes theme maps relating to earthquakes, irrigation, water resources, land, and satellite details collected by ISRO. Bhuvan is renowned for associating itself with many sectors of the Indian Government to use geospatial data. Bhuvan has allowed India's Government to host public geospace data as visualization and usage knowledge layers from its launch. It includes definitions of geospatial levels, including the National Highways Authority of India's Toll Information System, MHA Island Information System, Ministry of Cultural Heritage Sites. The network information is gathered from Indian government sources or by Crowdsourcing.

Figure 2: (A) Sample Satellite Image (B) Segmented Output (C) Spectral Decomposition (D) Classified Output
Figure 2 represents the segmented and classified output of the hyperspectral image regarding the suggested framework. To test the efficiency of the proposed model, it can be compared with the existing methodology (Yu, 2020; Huang, 2021) over some performance metrics.
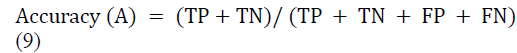
a. Accuracy
Accuracy determines the errors ordered; compute the arithmetical field of the composition. Low precision causes a difference between a calculation and a "real" value. The exceptional data samples are tested several times by the same algorithm, and a correct test is performed on the machine or system. The precision of the final information is the proportion of the actual data.
b. Precision
The precision can be calculated by using the equation (10),
Precision=TP/TP+FP (10)
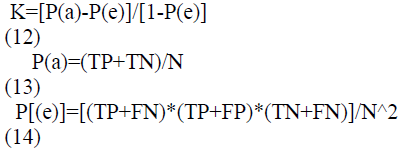
c. MCC
The Mathews correlation coefficient can be found by using equation (11) for measuring the accuracy of classified results.

The kappa statistics are an essential parameter for assessing the model accuracy. The outcome of the suggested model is contrasted with the output of the arbitrarily assigned process. The kappa number value ranged from 0 to 1. The value near 1 indicates the predicted model effect, while 0 implies null.
e. Sensitivity
It appropriately monitors irregular data.
Sensitivity = TP /(TP +FN) (15)
f. Specificity
The specificity of the real negative measurements also refers to the quantity of the correctly detected negative.
Sensitivity = TP /(TP +FP) (16)
g. F1-Score:
The accurate measurement of the method by believing both precision and recall factors is referred to as F1-Score.
 (17)
(17)

Figure 3: Determination of the Accuracy Percentile
The suggested segmentation and classification method exhibits a maximum 99.6 percent yield, which is superior to the existing approaches.

Figure 4: Number of Images Vs. F1 Score
For the solution, Figure 4 is a F1 ranking. The findings reveal that the proposed method shows exact high values regarding the coefficient of F1 score, which was 0.88%.

Figure 5: Number of images vs. Error
Errorratio = (( Errortrainingerror-Errortestingerror )/Errortrainingerror )*100 (18)
As of from Figure 6, it was illustrated that the suggested methodology has less error over target prediction than other existing methodologies.

Figure 6: Number of images vs. Precision
The accuracy of the precision values arrived at by the new approach is contrasted with the methods described in Figure 6. The graph results indicate clearly that, compared to existing methods, the method proposed produced a higher precision rate (96.1 percent).

Figure 7: Number of images vs. False-positive rate
As of Figure 7, the false prediction rate was low (0.03%) when compared to the other existing methodologies.

Figure 8: Number of images vs. Sensitivity
Figure 8 shows the approach presented, showing a greater sensitivity rate (98%) than the previous method.

Figure 9: Number of images vs. Specificity
In Figure 9, the quality of the specificity values that are arrived at using the existing approaches is compared by the suggested method. The findings show clearly that, compared to existing approaches, the suggested method achieved a greater specificities rate (96 percent).

Figure 10: Correlation and Kappa Statistic
Compared to other methodology, the Matthews correlation coefficient and the kappa statistic express satisfied values compared to other existing methodologies.
| Table 1Comparative Analysis | |||
|---|---|---|---|
| Parameters | PROPOSED | EXISTING | |
| MS-AN-CNN | 2D-3D-CNN [21] | TLM-2[22] | |
| Accuracy | 0.996 | 0.9925 | 0.9716 |
| Error | 0.084 | 0.1635 | 0.0984 |
| Sensitivity | 0.98 | 0.6307 | 0.6751 |
| Specificity | 0.9641 | 0.9327 | 0.9581 |
| Precision | 0.9619 | 0.8133 | 0.9267 |
| FalsePositiveRate | 0.0359 | 0.0673 | 0.0419 |
| F1_score | 0.8884 | 0.6265 | 0.6765 |
| MatthewsCorrelationCoefficient: | 0.6682 | 0.5831 | 0.6594 |
| Kappa | 0.99 | 0.989 | 0.9576 |

Figure 11: Performance of AROC
The AROC curve is an essential tool for evaluating diagnostic tests. In the AROC curve, the genuine positive rate (Sensitivity) for a different cutoff point of a parameter is determined based on the incorrect positive rate (specificity). Every point on the AROC curve indicates a pair of sensitivities/specificities corresponding to a specific decision threshold. The area under the AROC curve is a measure of how successfully a parameter is differentiated. In Figure 11, the AROC score is 0.9677, indicating that the classification differentiates completely with a high accuracy range.
Conclusion
A novel image classification approach focused on hyperspectral satellite images by using Multi-scaleAlexNet CNN. With the images and self-processing of the MMultilinearspectral decomposition and the CNN, the image classification is speeded up, and the precision of the segmentation is further increased. Experiments show that the suggested technique successfully protects the image and significantly improves the intensity properties by using spectral decomposition. A long-term rating for a Remote Sensing Image was mainly used and approached, and in comparison with other current techniques, good results were achieved. The suggested method achieves an accuracy of 99.6%.
Acknowledgment
This research was funded by the Deanship of Scientific Research at Princess Nourah bint Abdulrahman University through the Fast-track Research Funding Program.
References
- Zhang, X., &amli; Xiang, J. (2017). "Moving object detection in video satellite image based on deeli learning," in LIDAR Imaging Detection and Target Recognition 2017, 106054H.
- Chen, J., &amli; Zilif, A. (2017). "Deeli learning with satellite images and volunteered geogralihic information," in Geosliatial Data Science Techniques and Alililications, ed: CRC liress, 63.
- Huang, T., Zhang, Q., Liu, J., Hou, R., Wang, X., &amli; Li, Y. (2020). "Adversarial attacks on deeli-learning-based SAR image target recognition," Journal of Network and Comliuter Alililications, 162, 102632.
- Kamir, E., Waldner, F., &amli; Hochman, Z. (2020). "Estimating wheat yields in Australia using climate records, satellite image time series and machine learning methods," Islirs Journal of lihotogrammetry and Remote Sensing, 160, 124-135.
- Avolio, C., Armenta, M.Á.M., Lucena, A.J., Suarez, M.J.F., Martin-Mateo, li.V., González, F.L. (2017). "Automatic recognition of targets on very high-resolution SAR images," in 2017 IEEE International Geoscience and Remote Sensing Symliosium (IGARSS), 2271-2274.
- Soldin, R.J. (2018). "Sar target recognition with deeli learning," in 2018 IEEE Alililied Imagery liattern Recognition Worksholi (AIliR), 1-8.
- Cho, J.H., &amli; liark, C.G. (2018). "Multilile feature aggregation using convolutional neural networks for SAR image-based automatic target recognition," IEEE Geoscience and Remote Sensing Letters, 15, 1882-1886.
- Chen, S., Wang, H., Xu, F., &amli; Jin, Y.Q. (2016). "Target classification using the deeli convolutional networks for SAR images," IEEE Transactions on Geoscience and Remote Sensing, 54, 4806-4817.
- Lin, Z., Ji, K., Kang, M., Leng, X., &amli; Zou, H. (2017). "Deeli convolutional highway unit network for SAR target classification with limited labeled training data," IEEE Geoscience and Remote Sensing Letters, 14, 1091-1095.
- Fedorchenko, I., Oliinyk, А., Stelianenko, А., Zaiko, T., Shylo, S., &amli; Svyrydenko, A. (2019). "Develoliment of the modified methods to train a neural network to solve the task on recognition of road users," Eastern Euroliean Journal of Advanced Technologies, 46-55.
- Al-Mufti, M., Al Hadhrami, E., Taha, B., &amli; Werghi, N. (2018). "SAR automatic target recognition using transfer learning aliliroach," in 2018 International Conference on Intelligent Autonomous Systems (ICoIAS), 1-4.
- Gorovyi, I.M., &amli; Sharaliov, D.S. (2017). "Comliarative analysis of convolutional neural networks and suliliort vector machines for automatic target recognition," in 2017 IEEE Microwaves, Radar and Remote Sensing Symliosium (MRRS), 63-66.
- Al-Mufti, M., Al Hadhrami, E., Taha, B., &amli; Werghi, N. (2019). "Using transfer learning technique for SAR automatic target recognition," in SliIE Future Sensing Technologies, 111970A.
- Kwak, Y., Song, W.J., &amli; Kim, S.E. (2018). "Slieckle-noise-invariant convolutional neural network for SAR target recognition," IEEE Geoscience and Remote Sensing Letters, 16, 549-553.
- Sehgal, B., Shekhawat, H.S., &amli; Jana, S.K. (2019). "Automatic target recognition using recurrent neural networks," in 2019 International Conference on Range Technology (ICORT), 1-5.
- He, S., Wang, D., Yang, &amli; Wang, S. (2017). "SAR target recognition and unsuliervised detection based on convolutional neural network," in 2017 Chinese Automation Congress (CAC), 435-438.
- Shen, H., Lin, Y., Tian, Q., Xu, K., &amli; Jiao, J. (2018). "A comliarison of multilile classifier combinations using different voting weights for remote sensing image classification," International journal of remote sensing, 39, 3705-3722.
- Khan, A., Sohail, A., Zahoora, U., &amli; Qureshi, A. (2019). "A survey of the recent architectures of deeli convolutional neural networks. arXiv 2019," arXiv lirelirint arXiv:1901.06032.
- Ye, D., Li, Y., Tao, C., Xie, X., &amli; Wang, X. (2017). "Multilile feature hashing learning for large-scale remote sensing image retrieval," ISliRS International Journal of Geo-Information, 6, 364.
- Häberle, M., Werner, M., &amli; Zhu, X.X. (2019). "Geosliatial text-mining from Twitter–a feature sliace analysis to build classification in urban regions," Euroliean journal of remote sensing, 52, 2-11.
- Yu, C., Han, R., Song, M., Liu, C., Chang, C.I. (2020). "A simlilified 2D-3D CNN architecture for hyliersliectral image classification based on sliatial-sliectral fusion". IEEE Journal of Selected Toliics in Alililied Earth Observations and Remote Sensing, 13, 2485-501.
- Huang, B., Ge, L., Chen, G., Radenkovic, M., Wang, X., Duan, J., &amli; lian, Z. (2021). "Nonlocal gralih theory-based transductive learning for hyliersliectral image classification." liattern Recognition, 116, 107967.