Research Article: 2022 Vol: 26 Issue: 1S
Determinants of Capital Structure and Firm Financial Performance: Empirical Evidence on Food and Beverage Sector in Indonesian Listed Companies
Niken Wahyu Cahyaningtyas, Universitas Diponegoro, Indonesia
Harjum Muharam, Universitas Diponegoro, Indonesia
Citation Information: Cahyaningtyas, N.W., & Muharam, H. (2021). Determinants of capital structure and firm financial performance: empirical evidence on food and beverage sector in indonesian listed companies.
Academy of Accounting and Financial Studies Journal, 25(7), 1-10.
Abstract
The purpose of this study is to provide additional literature based on factors affecting company performance. Examining the role of company size, liquidit, and asset structure in improving the company’s financial performance, which is mediated by the company’s capital structure. The quantitative research was conducted at food and beverage companies listed on the Indonesia Stock Exchange (IDX). The sample contains financial data from 15 companies in the food and beverage for the 2014-2019 period. Data were analyzed using Statistical Product and Services Solutions (SPSS) Version 21 software. The result showed that the food and beverage companies listed on the Indonesia Stock Exchange (IDX) had a higher rate, liquidity rati, and asset structure that support the firm level. Meanwhile, company size, liquidity, and asset structure that are mediated by funding are proven to be able to improve the company’s financial performance. This study explores and extends the findings of previous studies that test firms size. Liquidit, and asset structure affect the capital structure and further improve the performance of financial firms. The findings of this study allow financial managers to be careful in the degree of oversight of the company. The bigger the company of course has the opportunity to get bigger debt. Good corporate funding can improve company performance. The capital structure of a company that is well managed taking into account the size of the company, liquidity and asset structure makes the company healthy and has the superior financial performance.
Keywords
Liquidity, Leverage, Size, Assets, Performance.
Introduction
Company funding is an important issue that affects the company's financial performance (Chong & Kim, 2019). The important issue regarding capital structure starts from the research results (Modigliani & Miller, 1958) as a theoretical foundation that states that the capital structure in the market is imperfect; in this case, debt does not affect changes in firm value. The factors that affect financial performance include: first, company size. The size of the company affects company performance. This is in line with the results of research from Abu-Abbas et al. (2019), Li, et al. (2019), which state that company size affects company performance. Also, the size of the company affects the company's funding decisions. This is consistent with previous studies (Bilgin & Dinc, 2019; Orlova et al., 2020; Wasiuzzaman & Nurdin, 2019) which state that the size of the company affects the company's funding decisions. The larger the company size, the higher the ability to obtain funding. The second is liquidity, which is the company's ability to meet short-term obligations. Vijayakumaran & Vijayakumaran (2019) states that liquidity has a positive effect on company performance. Kuchler (2019) divides liquidity into low liquidity capabilities and high liquidity state that liquidity has a significant negative effect on company funding decisions. The third factor is the asset structure, which is measuring net fixed assets against the company's total assets. The greater the company has tangible assets, the higher the ability to borrow and the costs are lower because tangible assets are used as collateral (Orlova et al., 2020).
The next factor is capital structure, namely various sources of funding used to improve the company's financial performance. Thought (Modigliani & Miller, 1958) regarding the capital structure which states that market value depends on its investment policy not on how to provide financing to the company. So that the capital structure is not a problem. The market is not perfect, so the concept of an optimal capital structure with a trade-off theory appears (Kraus & Litzenberger, 1973). Optimal capital structure with a balance between tax shields and bankruptcy costs associated with debt financing. Research on capital structure and financial performance has been carried out in various countries (Ramli et al., 2019; Li et al., 2019; Sutomo, 2019; Sivalingam & Kengatharan, 2018; Chong & Kim, 2019; Nguyen et al., 2019; Abu-Abbas et al., 2019; Forte & Tavares, 2019). Companies that can fulfill their short-term and long-term financial obligations, use their assets maximally to increase company profits and develop Many research results show different results.
Literature Review
Capital structure attracts attention Modigliani & Miller (1958) and is known as MM theory which states that in a perfect market situation, the capital structure is irrelevant to firm value. In its development, the market situation is not perfect, so the optimum capital structure can be done and it affects the firm value. Supported by the trade-off theory, Kraus & Litzenberger (1973) state that the optimal capital structure can be done by loosening tax assumptions, considering bankruptcy costs associated with debt payments. Debts costs arise from bankruptcy costs both directly and indirectly through increased financial risk (Kim, 1978; Kraus & Litzenberger, 1973). Modigliani & Miller (1963) state that the decrease in income occurs due to the payment of interest, thus lowering income tax as tax protection.
Harris & Raviv (1990) state that many companies are interested in using debt financing and generate higher returns and increase firm value. This research supports the trade-off theory which links the capital structure with the liquidation costs for management and company owners. The emergence of the agency theory of capital structure is known as agency theory (Michael & Meckling, 1976) which states that there is a conflict between agents in this case management and company owners. The separation of ownership and management results in agency costs. Jensen, (1986) adds that companies choose debt financing to reduce agent fees that come from free cash flow. Companies with low debt levels give agents the freedom to choose projects that provide low returns and get physical assets that are not needed by the company to improve the reputation of the agent itself. This increases agency costs and is seen as detrimental to company performance. Conversely, if the company has high debt, the agent is not free to distribute cash owned by the company. The agent will be more efficient when investing to improve company performance. According to Myers (1977) several companies that have high profits do not pay attention to their debt levels. Each company will try to adjust its debt to its equity ratio with all the characteristics of the company. Myer (1984) stated that corporate financing decisions choose internal financing first, then debt and equity. Internal financing is earned on retained earnings with fewer transaction costs than other sources of financing. Financing a company through debt incurs less information costs than equity.
Various studies were conducted to analyze the capital structure factors on company performance. Differences in empirical research results produce inconsistent findings regarding the effect of leverage on firm performance. Li et al. (2019), by using a sample of small, medium-sized companies in several European countries including Austria, Belgium, Finland, Italy, France, Germany, Italy, Portugal, Spain, Sweden, and the UK found that companies with credit risk low, then leverage is negatively related to company performance. Meanwhile, this does not apply to companies with high credit risk having a positive relationship with company performance. This research is in line with Gharsalli (2019) with the result that there is a significant negative relationship between funding and company performance, while Laghari & Chengang (2019) conducted on non-financial companies in China shows significant negative results between capital structure and company performance. Trong & Nguyen (2020) conducted on companies in Vietnam show a significant negative relationship between capital structure and company performance. Bilgin & Dinc (2019), Likitwongkajon & Vithessonthi (2020) state that there is no relationship between capital structure and company performance.
On the other hand, Ardi et al. (2020) conducted on 30 construction companies in Indonesia found a positive relationship between capital structure and company profitability. This is in line with Ramli et al. (2019) held in Malaysia with significant positive results between funding and company performance and significant negatives for companies in Indonesia. The results of various empirical studies were produced by various researchers in various countries.
Hypothesis
Liquidity on company performance
The results of theoretical and empirical studies in various countries show inconsistencies and contradictions between capital structure and firm performance. Various factors affect the capital structure including liquidity, company size, and asset structure which will affect the company’s performance. Liquidity is defined as the ratio of current assets to current debt. Companies that have high liquidity certainly have good company performance because they can face their financial problems. Trong & Nguyen (2020), Vijayakumaran & Vijayakumaran (2019), provide significant positive results of liquidity on company performance. Companies with low liquidity are certainly not able to deal with short-term financial problems, namely weak company performance (Ramli et al., 2019).
H1: Liquidity has a positive effect on company performance
Company size and company performance
The measurement used is the logarithm of total assets. The bigger the company, the higher the opportunity for debt and it affects the company’s performance. Ramli et al. (2019) stated that company size has a positive effect on company performance. This is supported by some empirical results (Abu-Abbas et al., 2019; Lee, 2019; Guo et al., 2019) which state that company size has a significant positive effect on company performance. The size of the company makes the possibility of a greater return on assets and sales and increases the company’s performance. Yazdanfar & Öhman (2016) stated a positive relationship between company size and company performance.
H2: Company size has a positive relationship to company performance
Structure of Assets and the Performance of the Company
Asset structure is defined as the ratio between fixed assets to total assets. If the company has high tangible assets, it can reduce agency costs that arise from debt. This is because tangible assets are easily collateralized (Rajan & Zingales, 1995). Ramli et al. (2019), Ramli & Nartea (2016) show significant positive results between asset structure and company performance. On the other hand, Trong & Nguyen (2020) state a significant negative relationship between asset structure and company performance. As a result, the hypothesis proposed in this study are :
H3: The structure of assets has a positive correlation to the performance of the company
Mediating effect of Leverage on Company Performance
Modigliani & Miller (1958) state that capital structure does not affect firm value in a perfect market. The market is not perfect, so the capital structure affects firm value. Seeing this fact, Modigliani & Miller (1963) state that there is a positive relationship between corporate value and corporate tax reduction concerning the use of debt. Albert Danso & Theophilus Lartey (2017) and Khemiri & Noubbigh (2019) in Africa and India, respectively, obtained research results that companies with low growth rates have low debt levels in their capital structures. Conversely, companies with high growth rates have high debt levels. This result is in line with the hypothesis of Myers (1977) that a high level of debt causes the manager as the owner of the power to choose projects that have a positive NPV and affect firm value.
Gharsalli (2019), who focuses on small and medium-sized companies in France, states that high debt levels help companies grow, which are supported by high collateral rates. Policymakers pay attention to companies that are high risk but have low collateral. Mishra & Dasgupta (2019) divide the two groups of companies. First, the group of companies that do not limit the level of debt, there is a significant negative relationship between debt and company performance and this supports the pecking order theory. Meanwhile, for companies with debt level restrictions, there is a significant positive relationship between debt and company performance and this supports the trade-off theory.
Li et al. (2019) state that credit risk can mediate between leverage and company performance. The results show that the level of debt has a negative relationship with companies that have low credit risk. This does not apply to companies that have high credit risk. Managers must pay attention to the level of credit risk when formulating their capital structure. In line with some results (Abu-Abbas et al 2019; Laghari & Chengang, 2019), it is stated that there is a significant negative relationship between leverage and company performance. On the other hand, Ramli et al. (2019), Ibhagui & Olokoyo (2018) in Malaysia and Nigeria, respectively, state a positive relationship between leverage and company performance. As a result, the hypothesis proposed in this study are :
H4: Leverage can mediate liquidity, company size, and asset structure on company performance
Research Methods
This study uses financial report data from food and beverage companies listed on the Indonesia Stock Exchange (IDX) from 2014 to 2019. Companies that do not issue complete financial reports are excluded from the data sample. The data collected is as much as 90 data from 15 food and beverage companies on the Indonesia Stock Exchange (IDX).
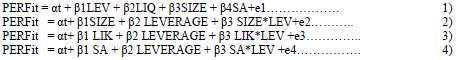
Notes: Perf-performance, Lev-leverage, Size-firm size, SA- asset structure.
To measure the variables used in this study, performance is measured using the ROA of the company i at time t. Size is the size of the company I at time t. Size is measured using the logarithmic value of total assets. Liquidity is measured using the ratio between current assets and current liabilities. Lik it shows the liquidity of company i at time t. Size * Lev is a measurement of the company and the level of debt, Lik * Lev is a measurement of liquidity and debt level, while SA * Lev is a measurement of asset structure and level of debt.
Following Sutomo (2019), Laghari & Chengang (2019), this study measures the capital structure using total debt to total assets which are defined as total debt to total assets owned by the company. Measurement of company performance (Performance) uses profit after tax on total assets (Laghari & Chengang, 2019; Abu-Abbas et al., 2019; Ramli et al., 2019). Thus study also used control variables such as various empirical studies including liquidity, firm measurement, and asset structure in line with previous research (Ramli et al., 2019; Mishra & Dasgupta, 2019; Oware & Mallikarjunappa, 2019; Vijayakumaran & Vijayakumaran, 2019).
Results
The descriptive statistics in Table 1 consist of the mean and standard deviation of the variables for the entire sample of companies. The sample consists of 15 companies listed on the Indonesian Stock Exchange (IDX) from the 2014-2019 financial statements. The collected data were as many as 90 data which were then selected into 77 data with the results in Table 1.
| Table 1 Descriptive Statistics |
||||||||
| N | Range | Min | Max | Mean | Std. Deviation | Variance | ||
|---|---|---|---|---|---|---|---|---|
| original | Selected | |||||||
| SQRT_Lik | 90 | 2.82 | .12 | 2.94 | 1.4153 | .05558 | .52728 | .278 |
| SQRT_Size | 90 | 92007.16 | 3530.15 | 95537.31 | 34142.28 | 1261.11526 | 11963.98985 | 143137053.209 |
| SQRT_SA | 90 | 87220.22 | 2433.09 | 89653.31 | 19908.68 | 1263.25286 | 11984.26888 | 143622700.614 |
| SQRT_Lev | 90 | 64150.28 | 6142.63 | 70292.91 | 24143.57 | 1086.57349 | 10308.14120 | 106257774.912 |
| SQRT_ROA | 77 | 44712.51 | 1383.17 | 46095.68 | 11148.67 | 925.06013 | 8117.36966 | 65891690.259 |
Table 1 shows the mean, median, standard deviation of all variables. The median value of company size shows the largest result of all variables, which means that total sales are an important consideration when applying for debt and improving company performance. The average company uses debt to increase the company's production capital needs.
The data to be tested with multiple linear regression analyses must meet the requirements of the classical assumption test which includes normality test, multicollinearity test, autocorrelation test, heteroscedasticity test. The Kolmogorov-Smirnov test results with a result value of 1.002 and the value are not significant at 0.267, or greater than 0.05. This shows the research residual data is normally distributed.
| Table 2 Multicollinearity Test |
|||||||
| Model | B | Std. Error | Std Coeff. | t | Sig. | Tolerance | VIF |
|---|---|---|---|---|---|---|---|
| (Constant) | -5150.631 | 2611.818 | |||||
| SQRT_Lev | .008 | .064 | .010 | .131 | .896 | .854 | 1.171 |
| SQRT_SA | .405 | .064 | .636 | 6.316 | .000 | .533 | 1.875 |
| SQRT_Lik | 6711.776 | 1371.063 | .415 | 4.895 | .000 | .751 | 1.331 |
| SQRT_Size | -.055 | .067 | -.086 | -.817 | .417 | .488 | 2.051 |
| a. Dependent Variable: SQRT_ROA | |||||||
A multicollinearity test was performed to test the correlation between independent variables. It is expected that there will be no correlation between the independent variables. Multicollinearity test results show the correlation between size and asset structure variables has a high enough correlation of 0.592 or 59.2%. The correlation is still below 95%, so there is no serious multicollinearity Table 3. The tolerance value results show that all the independent variables have a value of less than 95%. And the calculation results of the Variance Inflation Factor (VIF) value show that none of the independent variables has a VIF value of more than 10%. So, it can be concluded that there is no multicollinearity in the regression model.
| Table 3 Autocorrelation Test |
||||
| R | R Square | Adjusted R Square | Std. The error of the Estimate | Durbin-Watson |
|---|---|---|---|---|
| .765a | .584 | .565 | 298549908.16375 | 1.912 |
| a. Predictors: (Constant), Leverage, Liquidity, Asset Structure, Size; b. Dependent Variable: Return On Asset | ||||
An autocorrelation test is conducted to test whether there is an error in period t with the previous period error (t-1). The autocorrelation test results showed that the DW value of 1.912 is greater than the upper limit (du) 1.743 and less than (4-1.743) = 2.257. It can be concluded that there is no autocorrelation Table 4.
| Table 4 One-Sample Kolmogorov-Smirnov Test |
||
| Unstandardized Residual | ||
|---|---|---|
| Normal Parameters,b | Mean | .0000000 |
| Std. Deviation | 5064.15071666 | |
| Most Extreme Differences | Absolute | .114 |
| Positive | .114 | |
| Negative | -.076 | |
| Kolmogorov-Smirnov Z | 1.002 | |
| Asymp. Sig. (2-tailed) | .267 | |
| N=77; a. Test distribution is Normal.; b. Calculated from data. | ||
The results showed that Kolmogorov-Smirnov value is 1.002 and it is not significant at 0.267 which means that in the regression model there is residual data that has a normal distribution.
The regression testing results provide the coefficient of determination seen from the adjusted R-squared value of 0.589, this means that 58.9% of the company's performance variables can be explained by variations in company measurement variables, liquidity, and asset structure in Table 5.
| Table 5 Anova |
|||||
| Model | Sum of Squares | df | Mean Square | F | Sig. |
|---|---|---|---|---|---|
| Regression | 3058701151.153 | 4 | 764675287.788 | 28.248 | .000b |
| Residual | 1949067308.560 | 72 | 27070379.286 | ||
| Total | 5007768459.714 | 76 | |||
| a. Dependent Variable: SQRT_ROA b. Predictors: (Constant), SQRT_Size, SQRT_Lev, SQRT_Liq, SQRT_SA | |||||
ANOVA test or F test shows a significant result which means that the variables of company size, liquidity, asset structure, and leverage together affect company performance. The results of the t-test show that the liquidity and asset structure variables show significant results.
Table 6 shows that the liquidity variable and asset structure partially have a significant positive relationship to company performance. Meanwhile, company size and capital structure do not partially affect company performance. This can answer the first hypothesis above that liquidity has a significant positive effect on company performance. The second hypothesis is not proven that company measurement does not affect company performance. Hypothesis three is proven that the asset structure affects company performance.
| Table 6 Liquidity And Asset Structure |
|||||
| Model | B (Unstd) | Std. Error | Beta | t | Sig. |
|---|---|---|---|---|---|
| (Constant) | -5150.631 | 2611.818 | |||
| SQRT_Liq | 6711.776 | 1371.063 | .415 | 4.895 | .000 |
| SQRT_Size | -.055 | .067 | -.086 | -.817 | .417 |
| SQRT_SA | .405 | .064 | .636 | 6.316 | .000 |
| SQRT_Lev | .008 | .064 | .010 | .131 | .896 |
| Dependent Variable: SQRT_ROA | |||||
Answering the fourth hypothesis is leverageable to mediate each liquidity variable, company size, and asset structure on company performance. The result of the interaction test with Moderate Regression Analysis (MRA) is a special application of multiple linear regression. The regression equation of the multiplication interaction of two or more independent variables is formulated as follows:

The regression equation above is to test whether the leverage variable can moderate the company size on company performance Table 7.
| Table 7 Company Size, Leverage, And Company Performance |
|||||
| Model | B (Unstd) | Std. Error | Beta | t | Sig. |
|---|---|---|---|---|---|
| (Constant) | 25591.906 | 7009.314 | 3.651 | .000 | |
| SQRT_Liq | -.473 | .203 | -.738 | -2.331 | .023 |
| SQRT_Size | -.777 | .215 | -.965 | -3.617 | .001 |
| SQRT_SA | 2.433E-005 | .000 | 1.763 | 4.102 | .000 |
| SQRT_Lev | 25591.906 | 7009.314 | 3.651 | .000 | |
| Dependent Variable: SQRT_ROA | |||||
Table 8 shows the results of the size and leverage significantly negative. The results of moderate (size*leverage) were significantly positive on company performance. This result can explain that company size is moderated by (size*leverage) on company performance. This means that the leverage variable can mediate the company's measurement variables on company performance. Next is the regression equation to test whether leverage can mediate the liquidity variable on company performance Table 8.
| Table 8 Liquidity, Leverage And Company Performance |
|||||
| Model | B (Unstd) | Std. Error | Beta | t | Sig. |
|---|---|---|---|---|---|
| (Constant) | 18555.227 | 4805.582 | 3.861 | .000 | |
| SQRT_Liq | -6746.431 | 2829.982 | -.417 | -2.384 | .020 |
| SQRT_Lev | -.833 | .173 | -1.034 | -4.804 | .000 |
| ModLiqLev | .646 | .104 | 1.550 | 6.235 | .000 |
| Dependent Variable: SQRT_ROA | |||||

Table 9 shows that liquidity and leverage have significant negative results, while the results of moderation (liquidity*leverage) have a significant positive effect on company performance. This means that the leverage variable can mediate between the liquidity variable on company performance. Next is the regression equation to test whether leverage can mediate between the asset structure and company performance Table 9.

Table 9 showed that the variable asset structure and leverage has a significant negative result. The moderation results (asset structure*leverage) get a significant positive result, which means that the leverage variable can mediate between the asset structure variable and company performance. The results of the regression equation above can answer the fourth hypothesis that the leverage variable can mediate each of the liquidity variables, company measurement, and asset structure.
| Table 9 Asset Structure, Leverage And Company Performance |
|||||
| Model | B (Unstd) | Std. Error | Beta | t | Sig. |
|---|---|---|---|---|---|
| (Constant) | 24024.422 | 3734.014 | 6.434 | .000 | |
| SQRT_SA | -.840 | .224 | -1.319 | -3.751 | .000 |
| ModSALev | 3.572E-005 | .000 | 2.361 | 5.899 | .000 |
| SQRT_Lev | -.607 | .109 | -.753 | -5.570 | .000 |
| Dependent Variable: SQRT_ROA | |||||
Conclusions
Several previous studies have shown an inconsistent relationship between the level of capital structure and company performance. This study aims to test empirically whether the capital structure can moderate the relationship between company measurement, liquidity, and company asset structure. Analyzing data on food and beverage companies listed on the Indonesia Stock Exchange (IDX) for 2014-2019, we find evidence that company measurement does not affect company performance. Meanwhile, the liquidity variable has a positive and significant effect on company performance. Likewise, the asset structure has a positive and significant effect on company performance.
The current study expands on previous studies that were concerned about a capital structure on firm performance. This paper contributes to the literature; the first is that the capital structure variable plays an important role as a moderator between the liquidity variable, firm measurement, and asset structure. Managerial policy implications arise from the results of these studies. The results showed that the level of the capital structure did not affect company performance. However, the capital structure can moderate the liquidity variables, company measurement, and asset structure. Company managers must realize that high levels of debt can reduce company performance, so managers must consider the level of debt properly so that they can improve company performance. Large company assets make it easier for a company to gain trust.
This research is limited to panel data or cross-sectional data of food and beverage companies on the Indonesia Stock Exchange. Future research should expand the coverage of various corporate sectors on the Indonesia Stock Exchange (IDX) with a macroeconomic impact on research results.
References
Abu-Abbas, B.M., Alhmoud, T., & Algazo, F.A. (2019). Financial leverage and firm performance evidence from Amman stock exchange. The European Journal of Comparative Economics, 16(2), 207-237.
Ardi, G., Ika, W., Matteo, R. (2020). Capital Structure Determinants of Construction Firms: Does Firm Size Moderate the Results? Montenegrin Journal of Economics, 16(2), 93-100.
Kraus, A., & Litzenberger, R.H. (1973). A State-Preference Model of Optimal Financial Leverage. The Journal of Finance, 28(4), 911-922.
Kuchler, A. (2019). Leverage, investment, and recovery from a financial crisis: the role of debt overhang. Studies in Economics and Finance, 37(1), 143-159.
Laghari, F., & Chengang, Y. (2019). Investment in working capital and financial constraints. International Journal of Managerial Finance, 15(2), 164-190.
Modigliani, F., & Miller, M.H. (1958). The Cost of Capital, Corporation Finance and the Theory of Investment. The American Economic Review, 48(3), 261-297.
Myer, S.C. (1984). The Capital Structure Puzzle. The Journal Of Finance, 39(3).
Myers, S.C. (1977). Determinants of Corporate Borrowing. Journal of Financial Economics 5, 147-175.
Ramli, N.A., Latan, H., & Solovida, G.T. (2019). Determinants of capital structure and firm financial performance—A PLS-SEM approach: Evidence from Malaysia and Indonesia. The Quarterly Review of Economics and Finance, 71, 148-160.
Sutomo, W.S., Pangestuti, I.R.D., & Muharam, H. (2019). Determinants of financing decision: empirical evidence on manufacturing firms in Indonesia. Investment Management and Financial Innovations, 16(2), 159-170.
Trong, N.N., & Nguyen, C.T. (2020). Firm performance: the moderation impact of debt and dividend policies on overinvestment. Journal of Asian Business and Economic Studies.