Research Article: 2017 Vol: 21 Issue: 2
Determinants of Dividend Policy of Indian Manufacturing Companies: Panel Autoregressive Distributed Lag Analysis
M Kannadhasan, Indian Institute of Management
S Aramvalarthan, Amrita School of Business
P. Balasubramanian, Amrita School of Business
Aishwarya Gopika, Amrita School of Business
Keywords
Dividend Pay-Out Ratio, Firm Fundamentals, Panel Autoregressive Distributed Lag Analysis.
JEL Classifications
C33, G35, L61, M41
Introduction
Corporate dividend policy has been an area of concern in financial literature for a long period of time. Lintner’s (1956) classic work initiated the discussion on dividend. However, despite extensive research, dividend continues to be a “puzzle with pieces that just don’t fit together”(Black, 1996). A vast amount of research has been carried out on dividend policy and various theories such as theory of dividend irrelevance, signalling theory, agency cost theory and bird in the hand theory have emerged to answer the different questions relating to dividend policy. In 1961, the focus of research on corporate dividend policy shifted dramatically with the publication of a seminal paper by Miller and Modigliani. They postulated the theory of dividend irrelevance and argued that “…given a firm’s investment policy, the dividend pay-out policy it chooses to follow will affect neither the current price of its shares nor the total returns to shareholders”. The irrelevance theory is based on the following assumptions: (1) Dividends and capital gains suffer the same rate of income tax, (2) buying and selling securities do not involve any transaction and floatation costs, (3) all the market participants have free and equal access to information, (4) there are no agency costs and (5) all market participants are price takers(Miller & Modigliani, 1961).Subsequent studies (for example, Black and Scholes 1974; Merton and Myron 1982; Miller 1986, Bernstein 1996) mostly supported the dividend irrelevance hypothesis. However, managers, analysts and investors are concerned and spend more time towards dividend policy, which indicates that there is relevance (Dennis and Stepanyan, 2009). This belief motivated the researchers to understand the relevance of dividend policy by relaxing perfect market assumptions of irrelevance theory, namely taxes, agency problems and information signalling, among others.
Signalling theory asserts that a firm will generally ensure that an increase in its dividends will occur only when such an increase is sure to be associated with a higher level of future cash flows. Investors in such a firm will carefully consider the firm’s competence to measure the possibility that the future cash flow will be high. A firm can maintain a good level of credibility by shunning any unanticipated changes in its dividend payments. An increase in dividends acts as a signal to the shareholders that the firm will be able to generate high future cash flows. Pettit (1972) put forward the suggestion that capital markets consider dividend announcements as information for evaluating share price. Later studies (e.g. Bhattacharya (1979); John and Williams (1985); and Miller and Rock (1985) support this view. Asquith and Mullins (1983) examined the reaction of the market to dividend announcements. They used a sample of 168 firms that initiated dividends. They found that the magnitude of the initial dividends was significantly and positively related to the abnormal returns on the announcement day. Their results indicate that the level of the dividend changes has a significant impact on share returns. Healy and Palepu (1988) have approached the dividend policy under the realistic assumption of an imperfect capital market where information asymmetry definitely exists. They supported the view that dividend disbursements signal future earnings improvements.
The separation of ownership from management in corporate organizations gives rise to the agency problem. One of assumptions of Miller and Modigliani is that the interests of managers and shareholders do not conflict. However, in the real world, the goals of a firm’s owners do conflict with those of a firm’s managers. As a result, managers conduct themselves in a way that may prove costly to shareholders. Distributing dividends could be used as a tool to align the interests of shareholders with those of managers. Such distributions decrease the discretionary funds available with managers and thus mitigate the agency problems (Rozeff, 1982; Easterbrook, 1984; Jensen, 1986; Alli et al., 1993). Earlier studies have dealt with the effect of agency costs on dividend policy. They have concluded that firms tend to distribute higher dividends in order to restrict the ability of managers to overinvest by reducing the available free cash flow for overinvestment (Jensen, 1986). The bird-in-hand theory asserts that dividends are relevant. The crux of this theory is that any enhancement in dividend payments could entail an increase in the value of a firm. In other words, a higher current dividend reduces uncertainty about future cash flow signalling reduced cost of capital and thus enhanced value of the share of the firm. Gordon (1959)observed that retained earnings have a lower impact on share price than dividends. The findings of Fisher (1961); and Walter (1963) support this argument. However, Baker, Powell and Veit (2002) reach an opposite conclusion. They surveyed managers of NASDAQ firms to assess their view on dividend policy issues. Out of 186 respondents, 54.9 percent disagreed with the statement, “Investors generally prefer cash dividends today to uncertain future price appreciation”. Therefore, they conclude, “…this finding does not provide support for the bird-in-the-hand explanation for why companies pay dividends” (p. 278).
It is clear from these theories that dividends are relevant and can be predicable in many ways. Therefore, identifying and understanding the key factors that motivate the managers to distribute dividends is important for investors. These factor are grouped into three categories namely, firm characteristics, market characteristics and substitutions of pay-outs (Dennis and Stepanyan, 2009). The extant literature suggests that firm characteristics such as profitability, growth opportunities, size, leverage, maturity and aspects of the firms’ corporate governance, among others. Among these characteristics, size, earnings and growth are the major reasons for paying lower dividends by US firms (Fama and French 2001). Since fundamental characteristics vary across the firms and over time in systematic ways, determinants of dividends are expected to vary across the firms and over time. Majority of this research has been carried out with respect to developed countries, mostly the UK and the USA. There are only a limited number of empirical investigations on the dividend policy of companies in emerging economies like India. For instance, Mahapatra and Sahu (1993) found that cash flow and net-earnings were the major determinant of dividend, but current earnings were perceived as an important factor (Bhat and Pandey, 1994). Narasimhan and Vijayalaksmi (2002) opined that insider ownership did not influence on dividend behavior of Indian firms.
Nonetheless, there is no conclusive evidence on what fundamental characteristics that determines the dividend policy of Indian firms. Further, this study tries to examine whether determinants holds long or short run relationship towards dividend policy. Thus, this study analyses the determinants of dividend policy of firms in India using ARDL method. The reason for using this method is that the firm characteristics have a lagged effect on dividend policy. For instance, the growth opportunities in future have an effect on today’s dividend policy. Moreover, the use of this method permits to consider the firm-specific heterogeneity. Therefore, this study used ARDL method, which is a co-integration technique, introduced by Pesaran and Shin (1995) Pesaran, Shin and Smith (1997).
The study contributes in two ways: this study adds to the extant literature by investigating various factors as the determinants of dividend policy of Indian firms, manufacturing firms in particular, in turn that helps the investors in predicting the dividend paying firms. Thereby investors who wish to have a regular income on their investments make decisions accordingly. Secondly, findings of this study would be useful to the mangers to concentrate and maintain/enhance their financial position to retain as well as attract the potential investors. Finally, no studies have investigated using these variables in the context of determinants of dividend policy using ARDL method in Indian context.
The rest of the paper is organized as follows: The next section discusses the literature review on the determinants of dividend policy. The third section deals with methodology followed to find the determinants of dividend policy. The fourth section describes the results. The last section summarizes the findings and implications of those findings.
Literature Review
Prior to 1961, the commonly held view was that investors preferred high dividend payouts to low payouts (Graham and Dodd, 1951). The only question was determining the relative importance of dividends and capital gains in valuing a security (Gordon, 1959). In 1961, the focus of research on corporate dividend policy shifted dramatically with the publication of a seminal paper by Miller and Modigliani. This section reviews of the eariler studes who have investigated about the determinants of dividend policy. Shefrin and Statman (1984a) argued that the first step in solving the puzzle of dividends is to identify the factors that have an impact on dividend policy. Ho (2003)made a comparative study of Australia and Japan and investigated the determinants of dividends. The study covered the period of 1992-2001. The sample consisted of 332 companies from the Japanese and the Australian capital markets. He concluded that the dividend pay-out ratio of Japanese companies was lower than that of the Australian companies. He used the signalling, agency and transaction cost theories to explain the results achieved. He concluded that the size of the firms significantly affects dividend in Australia while in Japan dividend is significantly affected by risk and liquidity. He found that the more liquid the Japanese firms were, the higher were the dividends that they were able to pay but the higher the level of risk the company faced, the lower was the dividend paid. They observed that companies with high profitability pay high dividend because they experience good cash flow and liquidity. On the other hand, companies with high market to book ratio pay low dividend because they are in the high growth stage with many investment opportunities and they would need funds for investment.
Amidu and Abor (2006) empirically investigated the determinants of dividends for twenty companies listed on the Ghana Stock Exchange. Their study indicated that cash flow, growth, profitability and investment opportunities determine dividend policy. Ahmed and Javid (2008) analysed the data on 320 companies listed in the Karachi Stock Exchange covering a period of six years (2001-2006). They observed that there is a positive relationship between dividend pay-out and profitability and a negative relationship between dividend pay-out and size of the firm. Their results supported the signalling theory since highly profitable firms pay high dividends to signal the managers’ confidence about the likelihood of company’s profitability and liquidity in the future. In addition, companies of smaller size pay higher dividends to signal information and this reduces the information asymmetry between the managers and investors. Furthermore, Denis and Osobov (2008) investigated the determinants of dividends in a comparative study that used data from six countries (Germany, UK, USA, Japan, France and Canada). The study covered the period from 1994 to 2002. They found that dividend policy is affected by such variables as size, growth and profitability.
Methodology
Data
The study analyses the determinants of dividend policy of manufacturing companies in India. The data were collected from Ace Equity; the leading corporate financial database in India maintained by Accord Fintech, which is extensively used by academic researchers as well as practitioners in India. The study used panel data to understand the determinants of dividends. A finite sampling frame of 262 manufacturing companies that are constituents of NSE 500 Index was selected for the study. To be part of sample companies, the company must have paid dividends each year during the period from 1999-2000 to 2014-2015. The study identified 87 companies meeting the said criteria, which includes 1392 data points.
Variable Descriptions
Dividend Pay-Out Ratio
This empirical research uses the dividend pay-out ratio (calculated by dividend over net income) to investigate the factors, which influence dividend decisions. DPR is the dependent variable of this study.
Profitability
Signalling theory predicts a positive relationship between dividend and profitability. This has been well documented by different researchers such as Faccio et al. (2001) and Goergen et al. (2005).The main argument of signalling theory is that highly profitable firms pay high dividends to signal the managers’ confidence about the likelihood of company’s profitability and liquidity in the future. We use return on assets (ROA) as a proxy for profitability following Abor and Amidu (2006).
Size
Many empirical studies show that size is an important determinant of a firm’s dividend pay-out policy and is positively related to dividend pay-out ratio. Large firms are highly diversified and have stable cash flows. Therefore, they will be more willing to pay high dividends. Empirical investigations by Adedeji (1998), Charitou and Vafeas (1998) and Ooi (2009) confirm this proposition. Denis and Osobov (2008), Barclay et al. (2003), Fama and French (2001) concluded that size affects the dividend in a positive and significant way and they related this to the competitive advantage of large firms compared to small ones. This study uses the natural logarithm of total assets as a proxy for size. The use of the natural logarithm corrects for scale effects by treating as equal the same percentage variation rather than the same numerical variation (Eddy & Seifert, 1988; Ghosh & Woolridge, 1988).
Leverage
Signalling theory predicts a positive association between leverage and dividend decisions since highly leveraged firms tend to keep paying dividends despite the compulsion to service their loans in order to signal their financial health. However, many empirical studies have concluded that dividend is negatively affected by leverage (Faccio et al., 2001; Gugler & Yurtoglu, 2003). It is argued that highly levered companies try their best to maintain the internal cash flow by not paying existing cash to their shareholders in order to be able to meet the firm’s financial obligations and protect the creditors. Therefore, a negative relationship is expected between leverage and dividend decisions. This study employs the total debt to total assets ratio to investigate if leverage has an effect on dividend.
Growth Prospects
According to the pecking order theory, companies who have good growth opportunities use the internal funding sources to finance investments. They either pay low dividends or avoid payment of dividends to obviate the need for costly external financing. Several studies have found that dividends are lower in companies with high growth opportunities in comparison to companies with lower growth opportunities (Rozeff, 1982; Dempsey & Laber, 1992; Jensen et al., 1992).
This study uses the market to book ratio of equity as a proxy for growth opportunities for two reasons: Firstly, if a company’s market value is greater than its book value of equity then shareholders expect growth and secondly to facilitate comparability with other empirical papers. The market to book ratio of assets has not been used because of the difficulty of getting the market value of assets.
Research Model
Dividend Pay-out ratio (DPR) is described as a function of four independent variables namely, profitability, financial leverage, growth prospectus and size. The other firm characteristics, namely, incentive compensation, insider stock holding, firm maturity were not considered, because non-availability information for majority of the companies. Table 1 outlines the variables used, the definition of each variable and the expected impact on the dividend pay-out policy based on the discussion above:
| Table 1: Variables, Their Definitions And Expected Signs | |||
| Variable | Definition | Symbols | Sign of Expected Association with DPR |
|---|---|---|---|
| Profitability | Return on Assets | ROA | Positive |
| Size | Natural logarithm of Total Assets | Size | Positive |
| Financial Leverage | Total debt to Total assets | FL | Negative |
| Growth Prospects | Market to Book ratio | MB | Negative |
Panel Unit Root Test (PURT)
It is important to test the variables for stationarity before performing panel data co-integration analysis. Panel unit root test was conducted to verify the stationarity of the variables used in this study. The objective of performing PURT is to avoid spurious regression problems. The study used three tests namely Levin-Lin-Chu (LLC) test by Levin et al. (2002), Im-Pesaran-Shin (IPS) [first generation test by Im et al. (2003) and second generation test by Pesaran (2005)] and Fisher-Augmented Dickey-Fuller (ADF) test by Maddala and Wu (1999).
Fisher’s ADF test pools the p-values from unit root tests for each company. This method is a non-parametric in nature and hence it follows chi-square distribution with 2n degrees of freedom (note that ‘n’ is number of firms). The t-test value is calculated as follows:
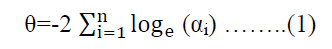
where, αi is the p-value from the ADF unit root test for unit i.
LLC test assumes a common unit process across the firms and stationary variables are expected to have significantly negative coefficients. However, ADF and IPS tests assume individual unit process across firms and stationary variables are expected to have significant coefficients. Levin-Lin-Chu (LLC) test by Levin et al. (2002) is based on the following general equation:

Where eit is a stationary process and Xit denotes deterministic component. This test assumes the residuals to be independently and identically distributed having mean zero and  variance with αi=α for all i. The null hypothesis can be stated as Ho: α=1, suggesting all the series in the panel have a unit root, whereas the alternative hypothesis H1: α<1 suggests that all the series in the panel are stationary. The LLC test permits heterogeneity in the intercept term. In contrast, Im-Pesaran-Shin (IPS) test permits for heterogeneity in both intercept and slope terms for the cross sectional units. The IPS test can be specified as

where αi and λit are unit specific fixed and time effects, respectively. The null hypothesis states the presence of unit root while alternate hypothesis suggests stationarity in the panel. The IPS test is like testing unit root for all cross section units. The Fisher- Augmented Dickey-Fuller test by Maddala and Wu (1999) use same null and alternate hypothesis as IPS test. The main advantage of this test is that it can be applied with any unit root test on a single time series and it does not require panel to be balanced as in the case of IPS test. As stated, this study employed three different types of PURT.
Panel ARDL
PMGE/ARDL model proposes an intermediate coefficient that allows the equality of coefficients between companies in the long-term and difference in coefficients between groups in the short-term (Pesaran et al., 2001). The advantage of the PMGE is that it allows the short-term dynamic coefficients to differ from company to company, but it constrains the long-term coefficients to be the same. In addition, this model shows the adjustment dynamism between short and long-term. Therefore, the long-term relationship between DPR and the fundamentals of a firm is expected to be same for all companies while short-term coefficients are expected to be company-specific. This method also assumes that error terms are not serially correlated and independent variables follow independently identically distributed. The optimal lag length is chosen based on the lowest value of Akaike Information criteria (AIC) (Akaike, 1973). The optimal lag length of this study is 1 for all the variables. Following is the panel ARDL model used in the study

Where no of cross sections i ranges from 1 to 87 and time t ranges from 1 to 16, αi denotes the group specific effect and eit denotes error term. As suggested by Pesaran et al. (1999), equation 4 is re-parameterized in to following error correction equation:

Equation 5 is the main equation of interest and is estimated by pooled mean group estimator where  are the long run and short run coefficients respectively. Also,

If PURT indicates that some variables are stationary at their level and others are stationary at their first difference, the study should use panel ARDL approach instead of static or panel co-integration test (Asteriou and Monastiriotis, 2004). In addition, this approach allows, not only variables of mixed level of integration, to estimate both short as well as long term relationship among the series along with error correction coefficient.
Results
| Table 2: Summary Statistics Of Variables | |||||
| DPR | FL | MB | ROA | Size | |
|---|---|---|---|---|---|
| Mean | 29.01 | 0.23 | 2.19 | 1.23 | 9.84 |
| Median | 25.96 | 0.22 | 1.19 | 1.08 | 9.59 |
| Maximum | 132.99 | 1.59 | 74.87 | 4.02 | 15.19 |
| Minimum | 01.44 | 0.00 | 0.005 | 0.15 | 6.65 |
| Std. Dev. | 16.18 | 0.18 | 3.39 | 0.65 | 1.57 |
| Observations | 1392 | 1392 | 1392 | 1392 | 1392 |
Table 2 reports the summary statistics of all the variables for all the companies over the sample period. The mean dividend pay-out ratio of manufacturing companies is 29.01 percentages over the sample period. It indicates that firms retain around 71 percent of their profit for meeting their growth. The minimum financial leverage is zero and maximum 1.59. The level of leverages communicates that the firms use the less amount of borrowed capital, which reduces the earning per share of firms. On an average, MB ratio and ROA are 2.19 times and 1.23%, respectively. The average size of the companies is 9.84 during the sample period.
| Table 3: Results Of Panel Unit Root Tests | ||||||
| Variable | Fisher ADF | LLC | IPS | |||
|---|---|---|---|---|---|---|
| Intercept | Intercept and Trend | Intercept | Intercept and Trend | Intercept | Intercept and Trend | |
| DPR | 449.63* | 372.62* | -13.27* | -13.87* | -11.09* | -08.55* |
| FL | 380.76* | 382.00* | -26.90* | -34.37* | -12.82* | -12.65* |
| ROA | 259.16* | 249.67* | -6.82* | -8.71* | -4.09* | -4.14* |
| MB | 186.86 | 204.06 | 0.75 | -4.23* | 2.26 | -0.92 |
| D(MB) | 827.86* | 577.38* | -28.51* | -21.42* | -23.78* | -16.69* |
| Size | 124.24 | 149.33 | -8.74* | -1.91** | 5.26 | 01.84 |
| D(size) | 503.58* | 407.54* | -17.59* | -18.06* | -13.72* | -10.42* |
| *Significant @ 1 percent level; **Significant @ 5 percent level | ||||||
The results of PURT are given in Table 3. DPR, FL and ROA are stationary at their level while MB and Size are stationary at their first difference. If all the variables are stationary at their level, fixed effect or random effect model is used. On the other hand, if all the variables are stationary at their first difference, Panel Fully Modified OLS or Panel Dynamic OLS is estimated. In addition to theoretical proposition stated in the introduction section, if some variables are stationary at their level and some variables are stationary at their first differences, Autoregressive Distributed Lag Models are estimated (Pesaran, Shin and Smith, 1999). The PURT result, i.e., (I (0) and I (1)) suggests that standard OLS cannot be used. Since the constant is changing with time, OLS estimates are likely to give high t-values and R2 value leading to a spurious regression. To avoid such a problem, a model that incorporates I (0) and I (1) in the same equation is required. Therefore, this study used Pooled Mean Group Estimation (PMGE)/ARDL introduced by Pesaran et al. (2001).
| Table 4: Results Of Panel Ardl | ||||
| Variable | Coefficient | Std. Error | t-Statistic | Prob.* |
|---|---|---|---|---|
| Long Run Equation | ||||
| DPR (-1) | -0.151126 | 7.950359 | -0.019009 | 0.9848 |
| FL | 9.057171 | 3.828804 | 2.365535 | 0.0183 |
| ROA | 13.82191 | 1.007014 | 13.72563 | 0.0000 |
| D (MB) | 5.294314 | 6.426783 | 0.823789 | 0.4103 |
| D (SIZE) | -7.971567 | 0.000000 | NA | 0.0000 |
| Short Run Equation | ||||
| COINTEQ01 | -0.278618 | 0.042098 | -6.618357 | 0.0000 |
| D (DPR(-1)) | -0.099823 | 0.045435 | -2.197036 | 0.0283 |
| D (FL) | 12.70206 | 26.95970 | 0.471150 | 0.6377 |
| D (ROA) | -8.228708 | 4.175260 | -1.970825 | 0.0491 |
| D (MB,2) | -1.163614 | 0.314917 | -3.694984 | 0.0002 |
| D (SIZE,2) | -7.238210 | 6.168418 | -1.173431 | 0.2410 |
| C | 1.101517 | 0.808001 | 1.363262 | 0.1732 |
The existence of co-integration confirms the presence of error correction mechanism among the variables (see Table 4). Lag length of all the variables are one (ARDL 1,1,1,1,1). Table 4 shows that FL and ROA are positively related to DPR and significant at 5 per cent and 1 per cent level respectively, while change in size which is an indicator of the growth of a firm is negatively related to DPR and significant at 1 per cent level in the long-run equation. It means that in the long run FL and ROA have a positive impact on DPR while the growth of a firm has negative impact. The short-run equation indicates that error correction mechanism is significant which indicates that the companies are following a stable DPR policy as if there is any deviation from that stable DPR, an error correcting mechanism will pull it back to that stable level. Further, in short-run, change in ROA and MB is negatively related to DPR and is statistically significant at 5 percent level. The finding of positive relationship of DPR with profitability in the long run is similar to the conclusion of Fama and French (2001) and DeAngelo, DeAngelo and Stulz (2006). Although profitable firms can affordable to pay cash dividend in the long run, the negative relationship between DPR and ROA in short run confirms the presence correction mechanism of dividend policy. Firms strive hard to attract the potential investors by paying more dividends, which needs to be brought it down to the stable and achievable in the long run. The finding of positive association of financial leverage (FL) with DPR is similar to the findings of Smith and Watts (1992) and Gaver and Gaver (1993). However, the finding of negative relationship of growth prospects (MB) with DPR in the short-run is in line with Smith and Watts (1992), Gaver and Gaver (1993) and Fama and French (2001), which confirms that firms have higher growth opportunities. Finally, the negative relationship of firm size with DPR in the long run is in contrast to the findings of Smith and Watts (1992), Gaver and Gaver (1993), Fama and French (2001), DeAngelo, DeAngelo and Stulz (2006) and Denis and Osobov (2008). This implies that firms are not reached the level of empire building inside a firm.
Conclusion
India is an important investment destination for global investors. The ability of firms to pay dividends increases the confidence of investors and provides a fillip to the capital markets. So, it is essential to understand the determinants of dividend pay-out. The extant literature indicates that this is an unresolved puzzle. However, researchers are trying to solve the puzzle by using advanced techniques. As a part of this endeavour, this study investigates the influence of firm’s fundamentals on the dividend pay-out of manufacturing companies in India using panel ARDL methodology. There are four dynamic factors, namely financial leverage, profitability, growth prospects and firm size that are used to understand the dividend pay-out. Except growth prospects, all other variables under study exhibit a statistically significant relationship with dividend pay-out in the long run. This indicates that dividend policy of companies depends on leverage, profitability and firm size. However, market-to-book ratio shows a negative relationship with dividend pay-out in the short-run, which is statistically significant. This indicates that growth has an effect on dividend pay-out only in the short run. Therefore, managers could increase their leverage to meet the growth opportunities and paying dividends as well. By increasing leverage, firm’s earning per share would be increased and thereby value of the firm. This study could be extended to non-manufacturing firms. Further, this study could be extended to understand the effect of non-fundamentals such as market characteristics and substitution of pay-out on dividend pay-out.
References
- Adedeji, A. (1998). Does the pecking order hypothesis explain the dividend pay-out ratios of firms in the UK? Journal of Business Finance & Accounting, 25(9?10), 1127-1155.
- Ahmed, H. & Javid, A.Y. (2009). The determinants of dividend policy in Pakistan. International Research Journal of Finance and Economics, 29(1), 110-125.
- Akaike, H. (1973), Information theory and an extension of the maximum likelihood principle, in: B. N. Petrov and F. Csaki, eds., 2nd International Symposium on Information Theory (Akademia Kiado, Budapest), 267-281.
- Alli, K.L., Khan, A.Q. & Ramirez, G.G. (1993). Determinants of corporate dividend policy: A factorial analysis. Financial Review, 28(4), 523-547.
- Amidu, M. & Abor, J. (2006). Determinants of dividend pay-out ratios in Ghana. The Journal of Risk Finance, 7(2), 136-145.
- Asquith, P. & Mullins, D.W. Jr. (1983). The impact of initiating dividend payments on shareholders' wealth. Journal of Business, 77-96.
- Baker, H.K., Powell, G.E. & Veit, E.T. (2002) Revisiting managerial perspectives on dividend policy. Journal of Economics and Finance, 26, 267-283.
- Baker, M. & Wurgler, J. (2002). Market timing and capital structure. The Journal of Finance, 57(1), 1-32.
- Banerjee, A., Dolado, J., Galbraith, J. & Hendry, D. (1993), Co-integration, error correction and the econometric analysis of non-stationary data. Oxford: Oxford University Press.
- Barclay, M.J., Holderness, C.G. & Sheehan, D.P. (2003). Dividends and dominant corporate shareholders. Working paper, University of Rochester.
- Bernstein, P.L. (1996). Dividends: The puzzle. Journal of Applied Corporate Finance, 9(1), 16-22.
- Bhat, R. & Pandey, I.M. (1994). Dividend decision: A study of managers’ perceptions. Decision, 21(1&2).
- Bhattacharya, S. (1979). Imperfect information, dividend policy and the bird in the hand fallacy. Bell Journal of Economics, 10(1), 259-270.
- Black, F. (1996). The dividend puzzle. The Journal of Portfolio Management, 23(5), 8-12.
- Black, F. & Scholes, M. (1974). The effects of dividend yield and dividend policy on common stock prices and returns. Journal of Financial Economics, 1(1), 1-22.
- Charitou, A. & Vafeas, N. (1998). The association between operating cash flows and dividend changes: An empirical investigation. Journal of Business Finance & Accounting, 25(1?2), 225-249.
- DeAngelo, H., DeAngelo, L. & Stulz, R. (2006). Dividend policy and the earned/contributed capital mix: A test of the lifecycle theory. Journal of Financial Economics, 81(2), 227-254.
- Dempsey, S.J. & Laber, G. (1992). Effects of agency and transaction costs on dividend pay-out ratios: Further evidence of the agency?transaction cost hypothesis. Journal of Financial Research, 15(4), 317-321.
- Denis, D., Stepanyan, G. & Baker, H.K. (2007). Factors influencing dividends. Dividends and Dividend Policy, 55-69.
- Denis, D.J. & Osobov, I. (2008). Why do firms pay dividends? International evidence on the determinants of dividend policy. Journal of Financial Economics, 89(1), 62-82.
- Earnings and Taxes. American Economic Review, 46(2), 97-118.?
- Easterbrook, F.H. (1984). Two agency-cost explanations of dividends. American Economic Review, 74(4), 650-659.
- Eddy, A. & Seifert, B. (1988). Firm size and dividend announcements. Journal of Financial Research, 11(4), 295-302.
- Erdem, E., Ucler, G. & Bulut, U. (2014), Impact of domestic credits on the current account balances: A panel ARDL analysis for 15 OECD countries. Actual Problems of Economics, 151, 408-416.
- Faccio, M., Lang, L.H.P. & Young, L. (2001). Dividends and expropriation. American Economic Review, 91(1), 54-78.
- Fama, E. & French, K. (2001). Disappearing dividends: Changing firm characteristics or lower propensity to pay? Journal of Financial Economics, 601, 3-43.
- Fisher, G.R. (1961). Some factors influencing share prices. The Economic Journal, 71(281), 121-141.
- Gaver, J. & Gaver, K. (1993). Additional evidence on the association between the investment opportunity set and corporate financing, dividend and compensation policies. Journal of Accounting and Economics, 16(1-3), 125-160.
- 29. Ghosh, C. & Woolridge, J.R. (1988). An analysis of shareholder reaction to dividend cuts and omissions. Journal of Financial Research, 11(4), 281-294.
- 30. Goergen, M., Renneboog, L. & Da Silva, L.C. (2005). When do German firms change their dividends? Journal of Corporate Finance, 11(1), 375-399.
- Gordon, M.J. (1959). Dividends, earnings and stock prices. The Review of Economics and Statistics, 99-105.
- Graham, B. & Dodd, D. L. (1951). Security analysis. (McGraw-Hill, New York).
- Gugler, K. & Yurtoglu, B.B. (2003). Corporate governance and dividend pay-out policy in Germany. European Economic Review, 47(4), 731-758.
- Healy, P.M. & Palepu, K.G. (1988). Earnings information conveyed by dividend initiations and omissions. Journal of Financial Economics, 21(2), 149-175.
- Ho, H. (2003). Dividend policies in Australia and Japan. International Advances in Economic Research, 9(2), 91-100.
- Im, K.L., Pesaran, M.H. & Shin, Y. (2003). Testing for unit roots in heterogeneous panels. Journal of Econometrics, 115(1), 53-74.
- Jensen, G.R., Solberg, D.P. & Zorn, T.S. (1992). Simultaneous determination of insider ownership, debt and dividend policies. Journal of Financial and Quantitative Analysis, 27(02), 247-263.
- Jensen, M. (1986). Agency costs of free cash flow, corporate finance and takeovers. The American Economic Review, 76(2), 323-329.
- Jensen, M.C. & Meckling, W.H. (1976). Theory of the firm: Managerial behaviour, agency costs and ownership structure theory of the firm: Managerial behaviour, agency costs and ownership structure. Journal of Financial Economics, 3(4), 305-360.
- John, K. & Williams, J. (1985). Dividends, dilution and taxes: A signalling equilibrium. The Journal of Finance, 40(4), 1053-1070.
- Laurenceson, J. & Chai, C.H. (2003), Financial reform and economic development in China. Australia, UK: University of Queensland, Edward Elgar Publishing, Inc.
- Levin, A., Lin, C.F. & Chu, C.J. (2002). Unit root tests in panel data: Asymptotic and finite sample properties. Journal of Econometrics, 108(1), 1-24.
- Lintner, J. (1956). Distribution of incomes of corporations among dividends, retained lower propensity to pay? Journal of Applied Corporate Finance, 14(1), 67-79.
- Maddala, G.S. & Wu, S. (1999). A comparative study of unit root tests with panel data and a new simple test. Oxford Bulletin of Economics and Statistics, 61, 631-651.
- Sahu, P.K. (1993). A note on determinants of corporate dividend behaviour in India – An econometric analysis. Decision, 20(1), 1-22.
- Merton, H.M. & Myron, S.S. (1982). Dividends and taxes: Some empirical evidence. The Journal of Political Economy, 90(6), 1118-1141.
- Miller, M.H. (1986). Behavioural rationality in finance: The case of dividends. The Journal of Business, 59(4), S451-68.
- Miller, M.H. & Modigliani, F. (1961). Dividend policy, growth and the valuation of shares. The Journal of Business, 34(4), 411-433.
- Miller, M.H. & Rock, K. (1985). Dividend policy under asymmetric information. The Journal of Finance, 40(4), 1031-1051.
- Miller, M.H. & Modigliani, F. (1961). Dividend policy, growth and the valuation of shares. Journal of Business 34(4), 411-433.
- Mishra, C. & Narender, V. (1996). Dividend policies of soes in India – An analysis. Finance, India.
- Narasimhan, M.S. & Vijayalakshmi, S. (2002). Impact of agency cost on leverage and dividend policies. The ICFAI Journal of Applied Finance. 8(2), 16-25.
- Ooi, J. (2009). Dividend pay-out characteristics of U.K. property companies. Journal of Real Estate Portfolio Management.
- Pesaran, M.H. (2005). A simple panel unit root test in presence of cross section dependence. Cambridge University Working Paper.?
- Pesaran, M.H., Shin Y. & Smith R. (2001), Bounds testing approaches to the analysis of level relationships. Journal of Applied Econometrics, 16(3), 289-326.
- Pettit, R.R. (1972). Dividend announcements, security performance and capital market efficiency. The Journal of Finance, 27(5), 993-1007.
- Rozeff, M.S. (1982). Growth, beta and agency costs as determinants of dividend pay-out ratios. Journal of Financial Research, 5(3), 249-259.
- Shefrin, H.M. & Statman, M. (1984). Explaining investor preference for cash dividends. Journal of Financial Economics, 13(2), 253-282.
- Smith, C.W. & Watts, R.L. (1992). The investment opportunity set and corporate financing, dividend and compensation policies. Journal of Financial Economics 32(3), 263-292. Vol. X, No. 3, September, pp.633-645.
- Walter, J.E. (1963). Dividend policy: Its influence on the value of the enterprise. The Journal of Finance, 18(2), 280-291.