Research Article: 2025 Vol: 29 Issue: 2S
Determinants of Financial Inclusion in Darla Gewog, Chukha, Bhutan.
Phurpa Tshering, Gedu College of Business Studies
Tenzin Dorji, Gedu College of Business Studies
Citation Information: Tshering, P., & Dorji, T. (2025). Determinants of financial inclusion in Darla Gewog, Chukha Bhutan. Academy of Accounting and Financial Studies Journal, 29(S2), 1-10.
Abstract
The purpose of this was to identify the drivers of financial inclusion in Darla Gewog, Chukha. Financial inclusion is an important factor for addressing socioeconomic issues leveraging financial services and enhancing economic growth. A quantitative research analysis was conducted employing Binary Probit regression to see the impact of education, age, and income on financial inclusion. Primary data were collected from Darla Gewog from 327 individuals through questionnaires circulated, with approximately equal representation of female and male respondents. The study found that level of income has a positive and significant impact on financial inclusion, where individuals with higher income had more likelihood to access credit and own a bank account. On the contrary, age has a negative influence on financial inclusion variables as older people have a lower probability of owning a bank account and availing credits compared to younger individuals. This study also found that the level of education does not significantly influence financial inclusion in Darla Gewog.
Keywords
Financial Inclusion, Socioeconomic Factors, and Income Enhancement Program.
Introduction
Financial inclusion can be defined as the accessibility and parity in opportunity to financial services and products offered by financial services providers or institutions. Creating a financial enabling environment for individual participants in the economy such as conducive transactions, payments, savings, and credits can help to boost economic growth and address pertinent socio- economic issues. This study aims to assess the level of influence that age, income, and education have on financial inclusion in Darla Gewog, Chukha.
Notwithstanding the significance of financial inclusion, it is still seen as a challenge in most of the developing countries including Bhutan. Royal Monetary Authority (2020) found out that only 76.08% of the Bhutanese own bank accounts and only 21.79% have access to credit facilities. There is even a huge disparity in financial inclusion between urban and rural Bhutan as only 67% of the rural population utilizes banking services whereas almost 95 %of urban inhabitants use banking services. These findings highlight the urgent need to address the financial inclusion barrier after understanding the variables influencing financial inclusion, especially in rural areas like Darla Gewog.
This research uses a quantitative analysis, employing Binary Probit regression to see the influence of age, income, and education on financial inclusion. Data were assembled through questionnaires circulated to 327 respondents from Darla Gewog, with approximately equal representation of male and female respondents. The dependent variable is regressed on independent variables age, education, and income. The findings of this research are anticipated to provide valuable information about particular factors that impact financial inclusion in Darla Gewog. After identifying the determinants it would aid policy makers and stakeholders in developing reforms and interventions to enhance financial inclusion.
Problem Statement
Financial inclusion has been one of the main drivers of economic growth (Dev, 2006) and plays a crucial role in reducing poverty and enhancing educational and economic opportunities for every member of society (Giron et al., 2021). Idle financial inclusion provides people with low-interest credits, financial stability during times of crisis, flexible transactions, and finally creates more inclusion in society (Douglas & Sutton, 2010).
Access to reliable finance was the major challenge faced by start-ups in Bhutan (Singh et al., 2020) which highlights the shortcomings of financial inclusion. Overall, digital banking has been instrumental in improving financial inclusion with ever-changing users and emerging markets forces (Kithinji, 2017) but in Bhutan, this aspect of financial inclusion is impeded by poor internet connectivity and low level of literacy to integrate the state–of–the–art Fintech (Gautam & Sharma, 2022). According to the Financial Inclusion Status Report by the Royal Monetary Authority (2020), it is found that only 76.08 percent of Bhutanese have a bank account, and only 21.79 percent have access to credit facilities, and 21 percent of the Bhutanese populace does not use any kind of banking products. It has also been found that there is a significant difference in the usage of banking services between rural (approximately 67 percent) and urban Bhutan (about 95 percent). Therefore, this study has analyzed the factors that would probably increase financial inclusion.
Research Question
Determine how different factors identified influence the level of financial inclusion in Darla Gewog, Chukha.
Sub-questions
1. What is the likelihood of an individual getting financially included with a higher level of income?
2. What is the influence of age on financial inclusion?
3. What is the probability of getting financially included with different levels of education?
Literature Review
Ensuring an inclusive financial system is one of the alternatives for promoting inclusive growth (Swamy 2014). Financial inclusion is defined as the process of making access to formal financial services timely and adequate for all needy at an affordable cost (Sathiyan & Panda, 2016). Financial inclusion attempts to address the challenge of poor access to financial services for excluded members of the economy (Sujlana & Kiran, 2018). It is found that socioeconomic development is positively affected by the level of financial inclusion and thus, the financial inclusion policy is a development policy priority in many countries (Sarma & Pais, 2011).
Financial inclusion is defined by considering one of the bank accounts held, and loans availed with a formal financial system (Camara & Tuesta, 2014). Financial inclusion is measured by formal accounts such as loans and deposits, frequency of use of financial services, mode of access, and purposes of the accounts (Morgan & Pontines, 2014). Financial inclusion is favored and hampered by various factors (Giron et al., 2021). Countries with higher economic growth and income, and a higher level of literacy have significantly better financial inclusion (Le et al., 2019). In Zimbabwe age, financial literacy, internet connectivity, and level of education are positively related to financial inclusion whereas, distance to the nearest access point hampers financial inclusion (Abel et al., 2018). In Central and West Africa inclusion in formal financial services is influenced by gender, age, residence area, employment status, education, marital status, and level of income (Soumare et al., 2016). Socio-economic indicators such as literacy, population, and income are found to have a positive association with the extent of financial inclusion (Chithra & Selvam 2013). Financial inclusion also depends upon the nature of financial products (Mohapatra, 2014).
Richer, older, being a man and more educated favored financial inclusion and at the same time, digital banking access also has a higher influence on financial inclusion in 37 African countries (Zins & Weill 2016). According to Amari and Anis (2021) found that younger individuals are less likely to own formal bank accounts due to a lack of documentation. Education has a statistically significant influence on financial inclusion at a 99 percent significance level and at the same time, macroeconomic stability and having a sound institutional framework are also attributes that help in achieving financial inclusion (Mzobe, 2015). Financial inclusion in developing economies is determined by factors such as income and size of the household (Hannig & Jansen, 2010). Socio-demographic factors such as civil status, employment, income, age, gender, and education are related significantly in accessing different financial services and products (Llanto & Rosellon, 2017). Level of education plays a critical role in determining financial inclusion as people with higher levels of education can maintain bank accounts, have more savings, more borrowings, have higher ownership of debit and credit cards, more use of digital payments, mobile payment accounts, and internet payments (Jaya, 2019). Mobile banking has the advantage of providing financial access to the unbanked population of society as it addresses the issue of access points with longer distances (Lashitew et al., 2019). A review by (Ozili, 2021) communicated that the state of financial inclusion is affected by poverty level, the stability of the financial sector, financial literacy, financial innovation, and regulatory frameworks.
Methodology
Approach/Paradigm Theory
This study adopted a quantitative analysis method to answer each of the research objectives. Information on variables used in the research was collected using a questionnaire and enumerators have assembled information from respondents by meeting physically with the people from Darla through face-to-face mode. All the research objectives mentioned were analyzed using the Probit regression model that encompasses independent and dependent variables. To run the Probit model accurately dependent variables were measured in binary numbers of zero and one. Dependent variables considered were bank account and credit availed whereas independent variables were gauged with the age of the respondents, level of education, and income level of the respondents (Figure 1).

Figure 1 Financial Inclusion
Conceptual Framework
Data Collection Procedures
This study gathered primary sources of data from the people of Darla Gewog to answer the research questions proposed. It employed Likard scale, close-end questions, and a few open- ended questions to gather the samples’ responses.
A convenience sample was used to collect data from people of Darla Gewog. This sample technique was suitable for this study as on the rural side we could not meet the people identified exactly by other forms of probability sampling. The total population size of Darla Gewog is 8541 (2017, National Statistical Bureau). This study has used an online sample size calculator to determine the sample size.
Total population=8541 Confidence level=95% Margin of error=5% Total sample size = 327.
The total sample size determined by the sample calculator is 327 and while collecting data from respondents, this study has collected data from 177 males and 150 females respectively with almost equal representation.
Data Analysis Procedures
Adapting (Giron et al. 2022), this study analyzed the probability of favoring financial inclusion with different levels of income, different age groups, and levels of education in Darla gewog using the Probit regression model (run with SPSS software).
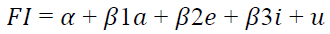
Where FI represents financial inclusion variables, a indicates the age, e represents the level of education, I represent the level of income and finally u for the error terms of the model. The level of financial inclusion is measured by three binary variables: i) bank account – assigning 1 if respondents have bank accounts with formal financial service providers and 0 otherwise and, ii) saving value 1 if respondents have saved any amount in financial service provider in last one year, otherwise 0.
Finding/Analysis
The data (Table 1- Table 6) had been collected from 327 individuals from Darla Gewog selected randomly which comprises of 150 female and 177 male respondents.
| Table 1 Demographic Information by Gender | |||||
| Frequency | Percent | Valid Percent | Cumulative Percent |
||
| Valid | Female | 150 | 45.9 | 45.9 | 45.9 |
| Male | 177 | 54.1 | 54.1 | 100.0 | |
| Total | 327 | 100.0 | 100.0 | ||
| Table 2 Model Information | |
| Dependent Variable | I own my personal bank Account at a financial institution. |
| Probability Distribution | Binomial |
| Link Function | Probit |
| Table 3 Case Processing Summary | ||
| N | Percent | |
| Included | 327 | 100.0% |
| Excluded | 0 | 0.0% |
| Total | 327 | 100.0% |
| Table 4 Categorical Variable Information | |||
| N | Percent | ||
| Dependent Variable [I own my personal bank account at a financial institution.] |
No | 25 | 7.6% |
| Yes | 302 | 92.4% | |
| Total | 327 | 100.0% | |
| Table 5 Goodness of Fit | |||
| Value | df | Value/df | |
| Deviance | 109.306 | 199 | .549 |
| Scaled Deviance | 109.306 | 199 | |
| Pearson Chi-Square | 224.705 | 199 | 1.129 |
| Scaled Pearson Chi-Square | 224.705 | 199 | |
| Log Likelihoodb | -64.834 | ||
| Akaike's Information Criterion (AIC) |
137.668 | ||
| Finite Sample Corrected AIC (AICC) |
137.793 | ||
| Bayesian Information Criterion (BIC) |
152.828 | ||
| Consistent AIC (CAIC) | 156.828 | ||
Model: (Intercept), age, monthly income, and level of education.
| Table 6 Omnibus Testa | ||
| Likelihood Ratio Chi-Square |
df | Sig. |
| 13.606 | 3 | .003 |
Model: (Intercept), Monthly income, Level of education and Age group.
A binary Probit regression analysis was used to examine the effect of variables Income level, Level of education, and Age range on the probability of the probability of individuals owning bankaccounts. The analysis utilized a binominal probability distribution with a link function (Table 7).
| Table 7 Parameter Estimates | ||||||||||
| Parameter | B | Std. Error | Lower | Upper | Wald Chi- Square | df | Sig. | Exp(B) | Lower | Upper |
| (Intercept) | -1.336 | .5005 | -2.316 | -.355 | 7.121 | 1 | .008 | .263 | .099 | .701 |
| Income level | .150 | .0762 | .001 | .299 | 3.886 | 1 | .049 | 1.162 | 1.001 | 1.349 |
| Level of education | .067 | .0874 | -.104 | .238 | .589 | 1 | .443 | 1.069 | .901 | 1.269 |
| Age range (Scale) |
-.126 | 1a | -.048 | -.003 | 5.132 | 1 | .023 | .974 | .953 | .997 |
Model: (Intercept), Income level, Level of education and, Age range.
a. Fixed at the displayed value.
The sample consists of 327 individuals, split between those who own bank accounts (302) and those who do not own bank accounts (25) in one of the financial institutions.
The model’s goodness of fit was assessed through various metrics, the Pearson Chi-square X2(199) = 1.129, p>0.05, suggested an adequate fit to the data, indicating that the model sufficiently represented the underlying distribution of the observed outcomes. Parameter estimates revealed that income level and age range significantly affect financial inclusion variable individuals owning the bank. For income level, a one-unit increase was associated with an increase in the log odds of owning bank account (B = .15, SE= .0762, p=.04). Similarly, age range showed negative relationship with individuals owning banking account (B = -.126, SE=.0114, p=.02) whereas level of education does not significantly affects in individual owning bank account (B = .067, SE=.0874, p=.443). This finding indicates that a higher level of income is associated with a higher probability of an individual owning a bank account whereas a higher age is associated with a lower probability of owning a bank account (Table 8 - Table 13).
| Table 8 Model Information | |
| Dependent Variable | I have a credit in the formal financial institution. |
| Probability Distribution | Binomial |
| Link Function | Probit |
| Table 9 Case Processing Summary | ||
| N | Percent | |
| Included | 327 | 100.0% |
| Excluded | 0 | 0.0% |
| Total | 327 | 100.0% |
| Table 10 Categorical Variable Information | ||||
| N | Percent | |||
| Dependent Variable | [I have a credit in the formal financial institution.] |
No | 210 | 64.2% |
| Yes | 117 | 35.8% | ||
| Total | 327 | 100.0% | ||
| Table 11 Goodness of Fita | |||
| Value | df | Value/df | |
| Deviance | 284.510 | 199 | 1.430 |
| Scaled Deviance | 284.510 | 199 | |
| Pearson Chi-Square | 226.485 | 199 | 1.138 |
| Scaled Pearson Chi-Square | 226.485 | 199 | |
| Log Likelihoodb | -168.541 | ||
| Akaike's Information Criterion (AIC) |
345.082 | ||
| Finite Sample Corrected AIC (AICC) |
345.206 | ||
| Bayesian Information Criterion (BIC) |
360.242 | ||
| Consistent AIC (CAIC) | 364.242 | ||
Model: (Intercept), age, monthly income and level of education.
| Table 12 Omnibus Testq | ||
| Likelihood Ratio Chi-Square |
df | Sig. |
| 19.240 | 3 | .001 |
Model: (Intercept), Monthly income, Level of education and Age group.
| Table 13 Parameter Estimates | ||||||||||
| Parameter | B | Std. Error | Lower | Upper | Wald Chi- Square | df | sig | Exp(B) | Lower | Upper |
| (Intercept) | .011 | .3579 | -.691 | .712 | .001 | 1 | .976 | 1.011 | .501 | 2.039 |
| Age range | -.012 | .0079 | -.027 | .004 | 2.161 | 1 | .142 | .989 | .973 | 1.004 |
| Level of income | .123 | .0359 | .052 | .193 | 11.635 | 1 | .001 | 1.130 | 1.054 | 1.213 |
| Level of education | .059 | .0552 | -.049 | .167 | 1.145 | 1 | .285 | 1.061 | .952 | 1.182 |
| (Scale) | 1a | |||||||||
Model: (Intercept), Age range, Income level and Level of education. a. Fixed at the displayed value.
Binary Probit regression analysis tool was employed to see the influence of variables age, Level of income and level of education on the probability of the probability of individuals possessing credit in the financial institutions. The overall, significance of the model is assessed through various tests, the Pearson Chi-square X2(199) = 1.138, p>0.05, suggested an independent variables significantly predict the dependent variable. Assessing the unique influence of each independent variable indicated that level of income significantly affects the individual availing credit from financial institutions (B=.123, SE= .0359, p= .001), whereas age range (B=-.012, SE= .0079, p= .976), and level of education (B=.059, SE=.0552., p= .285), does not influence in probability of individuals possessing credit from financial institutions.
Discussion
Countries with higher economic growth and income, and a higher level of literacy have significantly better financial inclusion (Le et al., 2019), whereas in Darla Gewog level of literacy does not help in increasing the level of financial inclusion. As people’s income increases financial inclusion also increases. This result in the Darla, Gewog context is validated as people who earn an income are paid through their bank account. This stand was supported by the level of positive influence that income had on financial inclusion in Zimbabwe (Sanderson et al., 2018). The also study showed that the age of the individuals hurt financial inclusion in Darla, Gewog. This finding contradicts the findings of Masiyandima et al. (2017) as when people grow older, they understand better the significance of financial services as compared to the younger ones, consequently, elder people use more financial services and products. The study also showed that the level of education does influence financial inclusion in Darla, Gewog. On the contrary, educated people understand the various financial services. This increases the probability of participation in financial markets (Sanderson et al., 2018). This positive influence of age on financial inclusion was augmented with the same findings by Berthoud and Kempson (1992) and Kempson (2000). All these studies supported the fact that educated people better understand the various financial services and its significance. Thus, increasing the probability of educated people participating in the financial market.
Recommendations
Based on the research findings, it was recommended that Darla a n d Gewog should focus on income enhancement programs as a higher level of income positively impacts financial inclusion. To support the elderly, specific programs that make them understand the use of financial services and that address their financial needs should be developed. Additionally, financial literacy campaigns should be initiated to educate people to understand the benefits and importance of financial services as it was found that level of education does not influence financial inclusion though education is the significant factor that influences financial inclusion in other countries.
Limitations
This study is focused on one Gewog, the use of limited variables to measure financial inclusion and dependent variable, and the use of convenience sampling which may compromise the comprehensive data of the variables and the entire population. Therefore, future researchers can consider including more parameters to measure the variables, different sampling techniques, and a broader geographic scope.
Acknowledgement
I would like to extend my deepest gratitude to all those who contributed to the completion of this research in their various capacity.
First and foremost, we are deeply thankful to our College Research Committee and colleagues of Gedu College of Business Studies for their unwavering support, guidance, and valuable feedback throughout the research process. Their expertise was deeply instrumental in shaping this literary work.
I am also grateful to the Office of Vice-Chancellor for providing the financial support necessary to conduct this research.
Thank you all for your support and contributions.
References
Amari, M., & Anis, J. (2021). Exploring the impact of socio-demographic characteristics on financial inclusion: empirical evidence from Tunisia. International Journal of Social Economics, 48(9), 1331-1346.
Indexed at, Google Scholar, Cross Ref
Cámara, N., & Tuesta, D. (2014). Measuring financial inclusion: A muldimensional index. BBVA Research Paper, (14/26).
Indexed at, Google Scholar, Cross Ref
Chithra, N., & Selvam, M. (2013). Determinants of financial inclusion: An empirical study on the inter-state variations in India. Available at SSRN 2296096.
Indexed at, Google Scholar, Cross Ref
Dev, S. M. (2006). Financial inclusion: Issues and challenges. Economic and political weekly, 4310-4313.
Gautam, K. P., & Sharma, D. (2022). Fintech and Digital Transformation in the Era of Industry 5.0: Where Does Bhutan Stand?. Asian Journal of Economics, Finance and Management, 330-336.
Girón, A., Kazemikhasragh, A., Cicchiello, A. F., & Panetti, E. (2021). Financial inclusion measurement in the least developed countries in Asia and Africa. Journal of the Knowledge Economy, 1-14.
Indexed at, Google Scholar, Cross Ref
Hannig, A., & Jansen, S. (2010). Financial inclusion and financial stability: Current policy issues.
Indexed at, Google Scholar, Cross Ref
Jaya, I. M. L. M. (2019). The impact of financial inclusion on public financial services education through financial technology in Sleman Regency, Indonesia. Esensi: Jurnal Bisnis dan Manajemen, 9(2), 155-174.
Indexed at, Google Scholar, Cross Ref
Kithinji, E. M. I. L. Y. (2017). Effects of digital banking strategy on financial inclusion among commercial banks in Kenya (Doctoral dissertation, University of Nairobi).
Lashitew, A. A., Van Tulder, R., & Liasse, Y. (2019). Mobile phones for financial inclusion: What explains the diffusion of mobile money innovations?. Research Policy, 48(5), 1201-1215.
Indexed at, Google Scholar, Cross Ref
Le, T. T., Dang, N. D. L., Nguyen, T. D. T., Vu, T. S., & Tran, M. D. (2019). Determinants of financial inclusion: Comparative study of Asian countries. Asian Economic and Financial Review, 9(10), 1107.
Indexed at, Google Scholar, Cross Ref
Llanto, G. M., & Rosellon, M. A. D. (2017). What determines financial inclusion in the Philippines? Evidence from a national baseline survey (No. 2017-38). PIDS Discussion Paper Series.
Masiyandima, N., Mlambo, K., & Nyarota, S. (2017, May). Financial inclusion and quality of livelihood in Zimbabwe. In 14th African Finance Journal Conference-Africa growth Institute.
Morgan, P., & Pontines, V. (2014). Financial stability and financial inclusion.
Indexed at, Google Scholar, Cross Ref
Mzobe, N. (2015). The role of education and financial inclusion in Africa: The case of selected African countries (Doctoral dissertation, Stellenbosch: Stellenbosch University).
Ozili, P. K. (2021, October). Financial inclusion research around the world: A review. In Forum for social economics (Vol. 50, No. 4, pp. 457-479). Routledge.
Indexed at, Google Scholar, Cross Ref
Sanderson, A., Mutandwa, L., & Le Roux, P. (2018). A review of determinants of financial inclusion. International Journal of Economics and Financial Issues, 8(3), 1.
Sarma, M., & Pais, J. (2011). Financial inclusion and development. Journal of international development, 23(5), 613-628.
Indexed at, Google Scholar, Cross Ref
Sathiyan, S., & Panda, P. K. (2016). Financial Inclusion in India-An Analysis of Pattern and Determinants.
Singh, E. H., Wangda, S., Khan, S., & Khan, S. A. (2020). Exploring the obstacles for start-ups in Bhutan: From a prevented entrepreneurs perspective. International Journal of Innovation, Creativity and Change, 11(4), 70-87.
Soumaré, I., Tchana, F. T., & Kengne, T. M. (2016). Analysis of the determinants of financial inclusion in Central and West Africa. Transnational Corporations Review, 8(4), 231-249.
Received: 01-Mar-2025, Manuscript No. AAFSJ-24-15208; Editor assigned: 03-Mar-2025, Pre QC No. AAFSJ-24-15208(PQ); Reviewed: 17- Mar-2025, QC No. AAFSJ-24-15208; Revised: 22-Mar-2024, Manuscript No. AAFSJ-24-15208(R); Published: 31-Mar-2025