Research Article: 2022 Vol: 26 Issue: 3
Determinants of Financial Performance of Micro Enterprise: An Empirical Study Self-Help Groups of Women Entrepreneurs
Ms. Jain J.M., B S Abdur Rahman Crescent Institute of Science & Technology
Shanmugam Munuswamy, B S Abdur Rahman Crescent Institute of Science & Technology
Citation Information: Jain, J.M., & Shanmugam, S., (2022). Determinants of financial performance of micro enterprise: an empirical study on self-help groups of women entrepreneurs. Academy of Accounting and Financial Studies Journal, 26(3), 1-12.
Abstract
Micro enterprises contribute significantly to an economy's balanced growth by creating and providing employment opportunities, thereby contributing to income generation. Financial performance is a subjective indicator of how well-run businesses can leverage their assets to generate future cash inflow Ahmad & Jamil. The purpose of this paper is to investigate the variables that affect the financial performance of micro businesses. To that end, an empirical study was conducted in the Indian context, with a focus on the state of Kerala. A multistage random sampling technique was used to select 180 micro enterprises operating under the Kudumbashree Mission (KM) in three districts. The study examined the factors affecting the profit and sales performance of the group micro enterprises using a panel data regression approach with a pooled OLS model. The findings indicated that sales revenue, enterprise region, and product type all had a significant impact on profitability performance. However, the age of the enterprise, its location (rural/urban), and the product category had no effect on its profitability performance. While the age of the enterprise and the region had a direct positive relationship with sales revenue, the location of the enterprise and the product category had no significant effect on sales revenue.
Keywords
Self-help Groups, Micro enterprise, Enterprise Performance, Profitability Performance, Sales Revenue.
Introduction
Microenterprises are small family-run businesses that rely heavily on traditional skills, locally sourced resources, and a local market. They are typically operated in order-driven industries such as retail, repair and maintenance, restaurants, and textiles, and require a significant amount of working capital (International Finance Corporation [IFC], 2012). Microenterprise gained popularity in academia and practise following the success of Grameen Bank's rural poor microcredit programmes in Bangladesh in the late 1970s. The concept of small loans assisting poor families in establishing businesses, increasing their income, and escaping poverty is believed to have sparked the global model of microenterprise development in the 1980s and grew into a global movement to combat poverty. According to research, low- and moderate-income individuals typically start microenterprises to create their own jobs or to supplement their income for themselves and their families (Roy & Wheeler, 2006). Microenterprises are often crammed in with small businesses. It has some distinguishing characteristics in comparison to other businesses. Its meaning varies depending on the country and organisation. Many governments and development organisations have focused on promoting Small and medium-sized enterprises (SMEs) in order to encourage greater participation in the private sector. SMEs account for the majority of businesses worldwide and are critical contributors to job creation, innovation and economic development on a global scale (Harpriya et al., 2020). This is particularly advantageous for rural women, as it enables them to contribute to the family income while also caring for their own home and livestock (Otieno et al., 2013). MSMEs are defined by the IFC (2012) on the basis of three indicators: employee count, annual revenue, and total assets. The IFC defined a micro enterprise as one with fewer than ten employees, total assets of less than $1 million, and annual sales of less than $100,000. If any of these two criteria is met, the enterprise is considered a micro-enterprise (Khodakivska & Michelitsch, 2012).
Micro-enterprises are primarily started by Self Help Groups (SHGs), which have advantages such as mandatory savings, a high rate of recovery, and excellent financial discipline with greater transparency (Bhargava, 2008). SHGs are community-based informal groups of people who provide mutual support for one another and are founded on trust and peer pressure. It provides people with the opportunity to develop their skills. Kudumbashree is a women-centered SHG-based poverty alleviation programme implemented by the Kerala government's State Poverty Eradication Mission (SPEM). Kudumbashree was founded with the goal of promoting local economic development, social development, and women's empowerment. One of the key strategies of the Kudumbashree mission to facilitate economic empowerment of the poor is the promotion and development of micro enterprises.
Literature Review
MFIs and other financial intermediaries have grown rapidly in recent years to assist micro enterprises. All types of microenterprises (full-time/part-time in a variety of sectors) can make a significant contribution to the socioeconomic development of low-income households, thereby ensuring long-term economic growth (Al-Mamun et al., 2016). Microenterprise success measured only via economic outcomes (Du Rietz & Henrekson, 2000). Micro enterprises play an important role in the strategic plan for guaranteeing the balanced development of the poor and marginalised women's economy. It contributes significantly to poverty reduction by creating self-employment opportunities, supplementing agricultural income, and acting as an intermediary between agricultural households and local markets by facilitating sales, product exchanges, and employment for household members where wage employment is scarce (Nagaya, 2017). Entrepreneurial competencies, according to Man et al. (2008), are the primary determinant of enterprise performance. The term "entrepreneurial competencies" refers to the resources (capabilities, characteristics, and skills) that entrepreneurs possess and channel toward sustained firm performance. According to Al Mamun et al. (2018), entrepreneurial competencies have a positive effect on firm performance. These competencies are defined as the ability to complete a task while utilising resources that improve the performance of a micro-enterprise. Women members' participation in microcredit programmes significantly increases the capital of microenterprises (MJA Chowdhury, 2009). While increasing entrepreneurs' incomes may be a compelling reason to invest in microenterprise development, income growth should not be the sole metric of success (Naila Kabeer, 1994; Amartya Sen, 1999; Kantor, 2005). Income must be converted into other important goals in order for development to occur. Due to the fact that micro enterprises are overwhelmingly owned and operated by the poor, they are a widely used strategy for promoting livelihoods throughout the world. These programmes are intended to have a long-lasting positive effect on the lives of women (Kantor, 2005). According to Otieno et al. (2013), microfinance's vision is to promote the growth of micro enterprises, and the majority of the sampled micro enterprises' actual financial data are likely to be unavailable to the public, making it difficult to verify the accuracy of any financial data reported. Earlier research has demonstrated that a variety of external and internal factors must be considered when determining the overall success of small businesses (David & Kovacs, 2020; Madai et al., 2020). According to Blackurn et al. (2013), performance can be measured in three ways: revenue generated, employment growth, and profit. The practical experience of the members is believed to have a greater positive impact on enterprise success than other determinants (Colombo & Grilli, 2005). Moreover, work experience can assist entrepreneurs in identifying worthwhile business opportunities and selecting the most efficient course of action from a variety of available options (Al-Mamun et al., 2016). Likewise, enterprise performance can be impacted by leadership experience and the ability to make efficient operational and strategic decisions (Streletzki & Schulte, 2013). According to Haider et al. (2017), micro enterprises' performance can be measured in terms of increased sales, income, assets, and employee count. Additionally, it was stated that entrepreneurs' development of entrepreneurial skills, strategic selection of competitive areas for business location, and enhancement of work experience are critical ingredients in improving their businesses' performance. Berrone et al. (2013) discovered that human capital (as measured by level of education and dedication), innovation, and the intensity in which one uses one's own capital are important determinants of microenterprise performance. The Government of India (2006) emphasised the importance of micro enterprises, stating that the formation of SMEs requires only a small amount of capital but has the potential to generate income through gainful employment. Thus, micro enterprises should provide a decent income to those who venture into them in order to ensure long-term sustenance. A number of studies have found that growth (in terms of sales revenue, turnover, or the number of employees) has an impact on the future and potential of micro enterprises (Blackburn et al. 2013 & McGee et al., 1995). Furthermore, the enterprise's consistent profit and growth demonstrate that it is performing well (Annastazia & Robert, 2014; Nyangoma, 2012).
Firm performance is a multidimensional variable that encompasses a variety of components and is used in a multidimensional manner because both financial and non-financial components must be quantified (Murphy et al., 1996 & Berrone et al., 2013). An enterprise's performance can be evaluated broadly based on its financial and operational performance. Measuring the performance of micro enterprises is a more difficult task because they operate in an informal economy that does not keep records of business transactions. The majority of performance measures are based on employment growth, profit, sales, and asset value (Thapa, 2015). Due to the lack of quantitative secondary data, the current study focuses on the financial performance of micro enterprises by narrowing it down to profit and sales performance (Ahmad & Jamil, 2020; Barringer, B.R., & Jones, 2004).
Objectives
The purpose of this research is to look into the factors that influence the profitability and sales performance of group micro enterprises in Kerala under the Kudumbashree project.
Hypothesis Framed for the Study
HA1: A large majority of the group micro enterprises under the Kudumbashree project in Kerala earn more than 10 per cent net profit margin in their business.
HA2: The sales performance positively influences the profitability performance of the group micro enterprises.
HA3: The age of the enterprise has a positive relationship with profitability performance of the micro enterprise
HA4: The age of the enterprise has a positive relationship with sales revenue of the enterprise.
HA5: There is a difference between rural and urban locations in the profitability performance and sales revenue.
HA6: There is inter-regional variation in the profitability and sales performance of the micro enterprises.
Variables Used in the Study
The financial performance of businesses is evaluated using two key indicators: profitability and sales volume. Due to a lack of data on other financial performance indicators, the assessment is limited to these two variables. Profitability is determined by both the amount of net profit earned and the net profit margin. Profitability is a performance metric used to evaluate a business's performance (Margaretha & Supartika, 2016). Net profit margins are used to determine the amount of net income or profit generated as a percentage of sales. The total annual sales revenue of the enterprises is used to evaluate their sales performance. Independent variables such as sales volume, enterprise age, location parameters, and the nature of the product can all have an effect on a company's profit performance (dependent variable). On the other hand, the age of the enterprise, its location parameters, and the nature of the product can all be significant determinants of a micro enterprise's sales performance (Chong, 2008).
Scope of the Study
Numerous studies have been conducted on the factors affecting the performance of micro enterprises in India, but very few have examined the factors affecting the financial performance of group micro enterprises in detail. The purpose of this study is to ascertain the factors affecting the financial performance of micro enterprises. It was conducted on selected enterprise units of the Kerala Government-sponsored SHG, Kudumbashree. The study examined the financial performance over the previous three years, which ended on March 31, 2020.
Methodology Used in the Study
The research was carried out in the Indian state of Kerala. The study employed a multi-stage random sampling technique. The unit of study was a group of micro enterprises under the Kudumbashree Mission in the state of Kerala. The study considered 180 micro enterprises. For the purposes of the study, Kerala was divided into three zones: north, central, and south, with one district chosen at random from each zone (Malappuram, Ernakulam and Thiruvananthapuram). Each district had 60 businesses chosen at random. Only units with at least three years of experience were considered. For data collection, a pretested structured interview schedule was used. For the study, sales revenue from 2017-18, 2018-19, and 2019-20 were used. As previously stated, three years of data from 180 businesses was used, resulting in 540 observations for the current study. Because the study contains panel data, regression analysis using the pooled OLS method was performed (Montagno et al., 1985).
Analysis and Discussion
Enterprise Characteristics of the Selected Micro Enterprises
Table 1 presents the demographic profile of the respondents. Majority (56.1%) of enterprises selected for the study were engaged in production and, 44.4% of enterprises were aged between 4 to 6 years. Restaurant and food supply with a contribution of 30 percentage emerged as the most common business activity among micro enterprises. Most of the enterprises (61.7%) operate with 4 to 6 members whereas only a miniscule portion of enterprises (2.8%) were with more than 10 members. While the samples were selected equally from 3 selected districts (33.3% each), 85 percentage of the enterprises were from rural areas and the balance 15 percentage were from the urban areas.
| Table 1 The Demographic Profile of the Selected Micro Enterprises | |||
| Area | Frequency | Percentage | |
| Industry/ Sector of business operations of the firm | Production | 101 | 56.1 |
| Service | 59 | 32.8 | |
| Trade | 20 | 11.1 | |
| Total | 180 | 100 | |
| Age of the firm (No. of years of existence in the industry) | Below 4 | 27 | 15 |
| 6-Apr | 80 | 44.4 | |
| 6 – 8 | 32 | 17.8 | |
| Above 8 | 41 | 22.8 | |
| Total | 180 | 100 | |
| Textiles/Tailoring | 24 | 13.3 | |
| Area in which the Enterprise Operates | Restaurants & Food Supply | 54 | 30 |
| Cottage Industry | 27 | 15 | |
| Food Processing | 42 | 23.3 | |
| Others | 33 | 18.3 | |
| Total | 180 | 100 | |
| Below 4 | 47 | 26.1 | |
| Size of the Firm (No. of Members) | 4 to 6 Members | 111 | 61.7 |
| 7 to 10 Members | 17 | 9.4 | |
| More than 10 | 5 | 2.8 | |
| Total | 180 | 100 | |
| District of Enterprise Operation | Thiruvananthapuram | 60 | 33.3 |
| Ernakulam | 60 | 33.3 | |
| Malappuram | 60 | 33.3 | |
| Total | 180 | 100 | |
| Location of the Enterprise | Rural | 153 | 85 |
| Urban | 27 | 15 | |
| Total | 180 | 100 | |
Table 2 explains the descriptive statistics of the Net Profit & Net Profit Margin of the Group micro enterprises during 2017-18 to 2019-20. The table reveals that there was a difference in the net profit and the net profit margin of the enterprises across all the three pairs compared. During the last three years, micro enterprises under the Kudumbashree project earned maximum net profit in the year 2019-20. It was found from the analysis that the net profit margin was between 12.45 per cent and 12.94 per cent.
| Table 2 Profitability Performance of Micro Enterprises | ||||||
| Sl. No. | Year | Mean | Median | Mean | Median | N |
| Net Profit (Rs.) | Net Profit | Net Profit Margin (%) | Net Profit Margin (%) | |||
| (Rs.) | ||||||
| 1 | 2017-18 | 241562.3 | 220000 | 12.45 | 11.67 | 180 |
| 2 | 2018-19 | 241143.8 | 224000 | 12.68 | 11.9 | 180 |
| 3 | 2019-20 | 254395.8 | 245000 | 12.94 | 12.28 | 180 |
| Overall | 245700.6 | 226000 | 12.64 | 12 | 180 | |
Source: Primary Data
Regression Model
Numerous factors affect the profitability of microbusinesses. To understand the factors influencing the profitability of micro enterprises, a panel data regression modelling approach was used. The following panel data econometric model was used for this purpose:
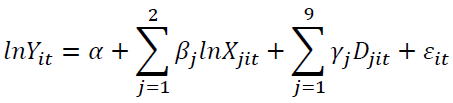
Where, α is the intercept, βs are the slope coefficients for continuous (quantitative) explanatory variables, γs are the dummy independent variable coefficients, and ε is the stochastic error term. The model includes 11 explanatory variables of which two are continuous variables (in natural log form) and nine are dummy variables. These explanatory variables are included to assess the impact of two quantitative and four qualitative factors on micro enterprise profitability.
The pooled OLS regression model was estimated using enterprise-level balanced-panel data from 180 micro enterprises over the three years from 2017-18 to 2019-20. The balanced panel data set for 180 micro enterprises over the three-year period yielded a total of 540 observations for the estimation of the model. Table 3 displays the descriptive statistics of the data used in the panel data regression model.
| Table 3 Descriptive Statistics of the Variables Used in the Regression Model | ||||
| Sl. No. | Variables | Mean | SD | N |
| 1 | lnY (ln Net Profit) | 12.34 | 0.37 | 540 |
| 2 | lnX1 (ln Sales) | 14.43 | 0.34 | 540 |
| 3 | lnX2 (ln Age) | 1.73 | 0.42 | 540 |
| 4 | D1 (Location) | 0.85 | 0.36 | 540 |
| 5 | D2 (Thiruvananthapuram) | 0.33 | 0.47 | 540 |
| 6 | D3 (Ernakulam) | 0.34 | 0.47 | 540 |
| 7 | D4 (Textiles/Tailoring) | 0.13 | 0.34 | 540 |
| 8 | D5 (RFS) | 0.3 | 0.46 | 540 |
| 9 | D6 (Cottage Industry) | 0.15 | 0.36 | 540 |
| 10 | D7 (Food Processing) | 0.23 | 0.42 | 540 |
| 11 | D8 (Production) | 0.56 | 0.5 | 540 |
| 12 | D9 (Service) | 0.33 | 0.47 | 540 |
Model Adequacy Test
The model adequacy test was conducted, and the results indicate that the model specification was satisfactory, as measured by the Ramsey's Regression Specification Error Test (RESET), F (2, 526) =2.06, p=.128. The Jarque-Bera (JB) test revealed that the error term distribution did not differ significantly from the normal distribution, 2 (2) = 3.76, p =.152. According to the variance inflation factor (VIF), there was no significant multicollinearity among the regressors (the VIF for all the explanatory variables were less than the cut-off value of 10 and the average VIF was 2.02)
The pooled OLS regression model estimation results – Profitability Performance
@ *** denotes significance at the 1% level, ** denotes significance at the 5% level, * denotes significance at the 10% level, and 'ns' denotes not significant
The pooled OLS regression model estimation results reported in Table 4 indicate that the model as a whole is statistically significant, F (11, 528)=30.80, p< .001. The coefficient of determination (R2=.723) demonstrated that the model is fit. From the Table 4 it can be inferred that one quantitative variable and only two out of the nine dummy variables had a statistically significant influence on the profitability of the micro enterprises. The remaining variables included in the model had no statistically significant influence on the profitability of the enterprises. This result provides empirical support to the hypothesis that the sales revenue positively influences the profitability of the micro enterprises.
| Table 4 Pooled Ols Regression Results on the Factors Influencing the Profitability of the Group Micro Enterprises | |||||||||
| Sl. No. | Predictor | Unstandardized Coefficients | Standardized Coefficients | t | p | Signifi cance@ |
Collinearity | Model Summary Statistics | |
| B | Std. Error# | Beta (β) | VIF | ||||||
| 1 | (Constant) | -0.364 | 0.8513 | -- | −0.43 | 0.669 | ns | -- | R2 = 0.729 Adj. R2 = .723 F (11, 528) = 30.802, p < .001 S.E. of Regression = 0.1954 AIC = −218.980 BIC = −167.481 Durbin-Watson = 0.763 p < .001 |
| 2 | lnX1 (ln Sales) | 0.888 | 0.0571 | 0.817 | 15.56 | <.001 | *** | 1.193 | |
| 3 | lnX2 (ln Age) | 0.021 | 0.0346 | 0.023 | 0.6 | 0.552 | ns | 1.094 | |
| 8 | D1 (Location) | 0.01 | 0.0274 | 0.01 | 0.36 | 0.718 | ns | 1.035 | |
| 9 | D2 (Trivandrum) | -0.071 | 0.0287 | -0.09 | −2.46 | 0.014 | ** | 1.467 | |
| 10 | D3 (Ernakulam) | -0.041 | 0.0321 | -0.053 | −1.28 | 0.2 | ns | 1.548 | |
| 11 | D4 (Textiles) | 0.002 | 0.0674 | 0.002 | 0.03 | 0.975 | ns | 1.647 | |
| 12 | D5 (RFS) | 0.055 | 0.045 | 0.068 | 1.23 | 0.219 | ns | 2.404 | |
| 13 | D6 (Cottage Industry) | 0.011 | 0.0472 | 0.01 | 0.23 | 0.818 | ns | 2.039 | |
| 14 | D7 (Food Processing) | 0.014 | 0.0458 | 0.016 | 0.3 | 0.763 | ns | 2.48 | |
| 15 | D8 (Production) | -0.139 | 0.0787 | -0.185 | −1.76 | 0.079 | * | 3.473 | |
| 16 | D9 (Service) | -0.186 | 0.0817 | -0.235 | −2.27 | 0.023 | ** | 3.86 | |
The statistically significant negative coefficient of the “Thiruvananthapuram” district dummy variable indicates that the average gross profit of enterprises in Thiruvananthapuram district was significantly lower than that of Malappuram district, which was retained as the base category. Similarly, the statistically significant negative coefficient of the ‘Service’ dummy variable indicates that the gross profit of the enterprises engaged in the service activities, on an average, was significantly less than that of the enterprises engaged in the trade activities.
The statistically non-significant coefficients of the remaining continuous and dummy variables included in the model suggest that the profitability of the micro enterprises were not influenced by any of these variables. To be more specific, the age of the enterprise, rural-urban location of the enterprise, and the category of product produced by the enterprises did not influence the profitability of the micro enterprises.
Sales Performance of Micro enterprises
Table 5 depicts the summary descriptive statistics of the Sales Revenue of the Group micro enterprises during 2017-18 to 2019-20. The sales revenue of the sample ranged between Rs.5, 10,000 and Rs.37, 98,333.30 and the median score of the sales revenue was Rs.17,69,333.30. During the last three years, the group micro enterprises under the Kudumbashree project earned maximum mean sales revenue in the year 2019-20 (Rs.20,20,186.40) and it was minimal in 2017-18 (Rs.19,09,155.40).
| Table 5 Summary Descriptive Statistics of the Sales Revenue of the Group Micro Enterprises During 2017-18 to 2019-20 | ||||
| Sl. No. | Year | Mean Sales (Rs.) | Median Sales (Rs.) | N |
| 1 | 2017-18 | 1909155.4 | 1750000 | 180 |
| 2 | 2018-19 | 1955507.2 | 1750000 | 180 |
| 3 | 2019-20 | 2020186.4 | 1896150 | 180 |
| Overall | 1961616.3 | 1769333.3 | 180 | |
Regression Model
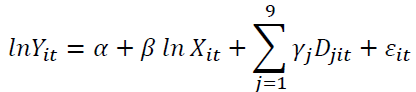
Factors which had impact on sales revenue were tested using Panel data regression modelling approach. Estimation of the factors influencing the sales performance was done using Pooled OLS model. Panel data linear regression model as shown below was estimated for this purpose:
The descriptive statistics of the data used in the panel data regression model are given in Table 6.
| Table 6 Descriptive Statistics of the Variables Used in the Regression Model | ||||
| Sl. No. | Variables | Mean | SD | N |
| 1 | lnY (ln Sales) | 14.43 | 0.34 | 540 |
| 2 | lnX (ln Age) | 1.73 | 0.42 | 540 |
| 3 | D1 (Location) | 0.85 | 0.36 | 540 |
| 4 | D2(Thiruvananthapuram) | 0.33 | 0.47 | 540 |
| 5 | D3 (Ernakulam) | 0.34 | 0.47 | 540 |
| 6 | D4 (Textiles/Tailoring) | 0.13 | 0.34 | 540 |
| 7 | D5 (RFS) | 0.3 | 0.46 | 540 |
| 8 | D6 (Cottage Industry) | 0.15 | 0.36 | 540 |
| 9 | D7 (Food Processing) | 0.23 | 0.42 | 540 |
| 10 | D8 (Production) | 0.56 | 0.5 | 540 |
| 11 | D9 (Service) | 0.33 | 0.47 | 540 |
Model Adequacy Test
The results of the model adequacy tests for the regression analysis of the sales revenue factor indicated that the model specification was adequate and that the distribution of the error terms did not differ significantly from the normal distribution. According to the variance inflation factor (VIF), the observed multicollinearity was not severe among the explanatory variables (Sharma & Sah, 2022).
@ *** denotes significance at the 1% level, ** denotes significance at the 5% level, * denotes significance at the 10% level, and 'ns' denotes not significant
The estimated model as a whole was statistically significant, F (10, 529) = 3.332, p< .001. However, the model's goodness of fit was low, as indicated by the coefficient of determination (R2=.162); however, this R2 value was statistically significant as indicated by the F-test reported in the Table 7.
| Table 7 The Pooled Ols Regression Model Estimation Results – Sales Revenue | |||||||||
| Sl. No. | Predictor | Unstandardized Coefficients | Standardized Coefficients | t | p | Significance@ | Collinearity | Model Summary Statistics | |
| B | Std. Error# | Beta (β) | VIF | ||||||
| 1 | (Constant) | 14.269 | 0.1269 | -- | 112.5 | <.001 | *** | -- | R2 = 0.162 Adj. R2 = .146 F (10, 529) = 3.322, p < .001 S.E. of Regression = 0.3160 AIC = 299.1098 BIC = 346.3170 Durbin-Watson = 0.648 p < .001 |
| 2 | lnX (ln Age) | 0.153 | 0.0522 | 0.187 | 2.932 | 0.004 | *** | 1.003 | |
| 3 | D1 (Location) | -0.015 | 0.0633 | -0.016 | −0.235 | 0.815 | ns | 1.014 | |
| 4 | D2 (Trivandrum) | -0.178 | 0.0564 | -0.245 | −3.156 | 0.002 | *** | 1.196 | |
| 5 | D3 (Ernakulam) | 0.072 | 0.0595 | 0.1 | 1.214 | 0.225 | ns | 1.036 | |
| 6 | D4 (Textiles) | -0.006 | 0.0763 | -0.006 | -0.073 | 0.942 | ns | 1.147 | |
| 7 | D5 (RFS) | -0.111 | 0.0778 | -0.148 | −1.422 | 0.156 | ns | 2.078 | |
| 8 | D6 (Cottage Industry) | 0.023 | 0.082 | 0.024 | 0.28 | 0.78 | ns | 1.038 | |
| 9 | D7 (Food Processing) | 0.018 | 0.081 | 0.022 | 0.202 | 0.826 | ns | 2.019 | |
| 10 | D8 (Production) | -0.042 | 0.0725 | -0.061 | −0.851 | 0.561 | ns | 3.009 | |
| 11 | D9 (Service) | -0.014 | 0.0882 | -0.019 | −0.160 | 0.873 | ns | 3.019 | |
The estimated regression model presented in Table 8 indicates that only the quantitative variable age and one of the nine dummy variables had a statistically significant effect on the micro enterprises' sales performance. The quantitative variable 'age of the enterprise' had a significant impact on the micro enterprise's sales performance. The model's other dummy variables had no statistically significant influence on the sales performance of the group micro enterprises. The statistically significant negative coefficient of the 'Thiruvananthapuram' district dummy variable indicates that the average gross sales turnover of enterprises in Thiruvananthapuram district was significantly lower than that of enterprises in Malappuram district, which was the base category (Mahmud & Hilmi, 2014).
| Table 8 Explains the Summary of Decisions on Hypothesis Tested in the Present Study | ||
| Hypothesis Number | Statement | Decision |
| H1 | A large majority of the group micro enterprises under the Kudumbashree project in Kerala earn more than 10 per cent net profit margin in their business. | |
| Fails to be rejected | ||
| H2 | The sales performance positively influences the profitability performance of the group micro enterprises under the Kudumbashree project in Kerala. | |
| Fails to be rejected | ||
| H3 | The age of the enterprise has a positive relationship with profitability performance of the micro enterprise | |
| Rejected | ||
| H4 | The age of the enterprise has a positive relationship with sales revenue of the enterprise | |
| Fails to be rejected | ||
| H5 | There is a difference between rural and urban locations in the profitability performance and sales revenue. | |
| Fails to be rejected | ||
| H6 | There is inter regional variation in the profitability and sales performance of the group micro enterprises under Kudumbashree projects in Kerala | |
| Fails to be rejected | ||
Summary of Decisions on Hypothesis Tested
Findings and Discussion
The study points out the following findings.
1. Sales turnover had a positive effect on the profitability of the micro enterprises. It indicates that there was a positive association between the sales turnover and the profitability of the enterprises, and its magnitude indicates that a one per cent increase in the sales revenue of the enterprise, on average, leads to 0.88 per cent increase in the net profit of the enterprise.
2. The study revealed that the age of the enterprise, rural-urban location of the enterprise, and the category of product produced by the enterprises did not influence the profitability of the group micro enterprises under the Kudumbashree project in Kerala.
3. The study showed that there is inter regional variation in the profitability performance and sales performance of the micro enterprises. Average gross sales turnover and average gross profit of the enterprises located in Thiruvananthapuram district was significantly lower than that of Malappuram district which was kept as the base category.
4. There is a statistically significant difference in the sales revenue of the enterprises across the three pairs compared (Years 2017-18, 2018-19 & 2019-20). Net profit was maximum in 2019-20 and as minimum in 2017-18. Sales performance registered a positive growth over the three years.
5. The regression analysis revealed that age of the enterprise had a positive effect on the sales performance. Estimated coefficient indicated that other things remaining constant, one per cent increase in the age of the enterprise leads to 0.15 per cent increase in the sales turnover. Enterprises with higher experience would, thus earn more sales.
6. The location of the enterprise (i.e., rural or urban) and the category of product produced by the enterprises had no significant effect on the sales performance.
Conclusion
Micro enterprises not only boost national productivity and create jobs, but they also help rural women develop economic independence as well as personal and social capabilities. According to Mahmud & Hilmi, SMEs have become a critical component of economic development in the majority of developed and developing countries alike. It contributes significantly to global economic growth by providing high-quality products/services in order to compete in a competitive environment. Increased female entrepreneurial motivation will eventually allow both regional development and affect a country's overall economic status. Notably, it helps to keep a number of people employed within their own social system. The scope of the study was limited to the role of financial (profitability and sales revenue) factors in micro enterprises and the factors influencing their performance. Other financial factors influencing an enterprise's performance, such as investment, intensity of use of own capital, and credit availability, require extensive examination.
References
Al-Mamun, A., Rajennd, A., Muniady, L., Ibrahim, M.A.H.B., & Nawi, N.B.C. (2018). Effect of economic vulnerability on entrepreneurial competencies among Malaysian micro-entrepreneurs. Asia Pacific Journal of Innovation and Entrepreneurship.
Indexed at, Google Scholar, Cross Ref
Barringer, B.R., & Jones, F.F. (2004). Achieving rapid growth: revisiting the managerial capacity problem. Journal of Developmental Entrepreneurship, 9(1), 73.
Berrone, P., Gertel, H., Giuliodori, R., Bernard, L., & Meiners, E. (2014). Determinants of Performance in Microenterprises: Preliminary Evidence from A rgentina. Journal of Small Business Management, 52(3), 477-500.
Indexed at, Google Scholar, Cross Ref
Bhargava, S. (2008). Entrepreneurial Management. SAGE Publications India.
Chong, H.G. (2008). Measuring performance of small-and-medium sized enterprises: The grounded theory approach. Journal of Business & Public Affairs.
Chowdhury, M.J.A. (2009). Microcredit, micro-enterprises, and self-employment of women: experience from the Grameen Bank in Bangladesh. Center for Microfinance and Development working paper, 209.
Colombo, M.G., & Grilli, L. (2005). Founders’ human capital and the growth of new technology-based firms: A competence-based view. Research Policy, 34(6), 795-816.
Indexed at, Google Scholar, Cross Ref
David, S., & Kovacs, L. (2019). The development of clearing services–paradigm shift. Economy and Finance: English-Language Edition of Gazdaság És Pénzügy, 6(3), 296-310.
Indexed at, Google Scholar, Cross Ref
Du Rietz, A., & Henrekson, M. (2000). Testing the female underperformance hypothesis. Small Business Economics, 14(1), 1-10.
Indexed at, Google Scholar, Cross Ref
Haider, S.H., Officer, C.S., Asad, M., Fatima, M., & Abidin, R.Z.U. (2017). Microfinance and performance of micro and small enterprises; Does training have an impact. Indicators, 4(1).
Indexed at, Google Scholar, Cross Ref
Jamil, N.N., & Ahmad, N.N. (2020). Measuring the Financial and Nonfinancial Performance of Micro-Enterprise in Pahang, Malaysia. International Journal of Academic Research in Business and Social Sciences.
Indexed at, Google Scholar, Cross Ref
Kantor, P. (2005). Determinants of women's microenterprise success in Ahmedabad, India: Empowerment and economics. Feminist Economics, 11(3), 63-83.
Indexed at, Google Scholar, Cross Ref
Khodakivska, A, & Michelitsch, R. (2012). Assessing Private Sector Contributions to Job Creation: IFC Open Source Study, International Finance Corporation, World Bank Group.
Mahmud, N., & Hilmi, M.F. (2014). TQM and Malaysian SMEs performance: The mediating roles of organization learning. Procedia-Social and Behavioral Sciences, 130, 216-225.
Indexed at, Google Scholar, Cross Ref
Mamun, A.A., Saufi, R.A., & Ismail, M.B. (2016). Human capital, credit, and startup motives: A study among rural micro-enterprises in Malaysia. The Journal of Developing Areas, 50(4), 383-400.
Indexed at, Google Scholar, Cross Ref
Man, T.W., Lau, T., & Snape, E. (2008). Entrepreneurial competencies and the performance of small and medium enterprises: An investigation through a framework of competitiveness. Journal of Small Business & Entrepreneurship, 21(3), 257-276.
Indexed at, Google Scholar, Cross Ref
Margaretha, F., & Supartika, N. (2016). Factors affecting profitability of small medium enterprises (SMEs) firm listed in Indonesia Stock Exchange. Journal of Economics, Business and Management, 4(2), 132-137.
Indexed at, Google Scholar, Cross Ref
Montagno, R.V., Kuratko, D.F., & Scarcella, J.H. (1985). Perception of entrepreneurial success characteristics. American Journal of Small Business, 10(3), 25-32.
Indexed at, Google Scholar, Cross Ref
Nagaya, N. (2017). SME impact on output growth, case study of India. Palma Journal, 16(13), 11-170.
Google Scholar, Cross Ref
Nyangoma, P.S. (2012). Credit terms, access to finance and financial performance of SMES in Kampala (Doctoral dissertation, Makerere University).
Otieno, S., Martin, L., Nyamao, N.R., Ojera, P., & Odondo, A.J. (2013). Effect of provision of micro-finance on the performance of micro-enterprises: A study of youth micro-enterprises under Kenya Rural Enterprise Program (K-REP), Kisii County, Kenya.
Indexed at, Google Scholar, Cross Ref
Roy, M.A., & Wheeler, D. (2006). A survey of micro-enterprise in urban West Africa: drivers shaping the sector. Development in Practice, 16(5), 452-464.
Indexed at, Google Scholar, Cross Ref
Sharma, R.K., & Sah, A.N. (2022). Impact of demographic factors on the financial performance of women?owned micro?enterprises in India. International Journal of Finance & Economics.
Indexed at, Google Scholar, Cross Ref
Streletzki, J.G., & Schulte, R. (2013). Which venture capital selection criteria distinguish high-flyer investments?. Venture Capital, 15(1), 29-52.
Indexed at, Google Scholar, Cross Ref
Thapa, A. (2015). Determinants of microenterprise performance in Nepal. Small Business Economics, 45(3), 581-594.
Indexed at, Google Scholar, Cross Ref
Received: 18-Jan-22, Manuscript No. AAFSJ-22-10905; Editor assigned: 20-Jan-22, PreQC No. AAFSJ-22-10905(PQ); Reviewed: 31-Jan-2022, QC No. AAFSJ-22-10905; Revised: 17-Feb-2022, Manuscript No. AAFSJ-21-10905(R); Published: 25-Feb-2022