Research Article: 2022 Vol: 26 Issue: 1
Development of a Tool for Optimizing the Management Processes in the Field of Innovation in the Bulgarian Furniture Enterprises
Radostina Popova-Terziyska, University of Forestry – Sofia, Bulgaria
Nikolay Neykov, University of Forestry – Sofia, Bulgaria
Daniela Ventsislavova Georgieva, International business school - Bulgaria
Citation Information: Terziyska, R.P., Neykov, N., & Georgieva, D.V. (2022). Development of a tool for optimizing the management processes in the field of innovation in the bulgarian furniture enterprises. Academy of Accounting and Financial Studies Journal, 26(1), 1-11.
Abstract
Innovation is primarily associated with a high level of uncertainty, risk, and a lot of investments. These negatively affect the Bulgarian forest enterprises, which in general are “low-tech” and are investing less in innovation. The main goal of the paper is, by the use of the Markov Chains methodology, to propose an adapted methodology for risk assessment at the beginning of the innovation process in Furniture production in Bulgaria. Additionally, the study presents possible situations and describes them throughout the theoretical approaches in a probabilistic way. The research results can be used to avoid some decision-making mistakes before the start of the innovation process through an easy-to-use methodology.
Keywords
Innovation, Furniture Enterprises, Markov Chains, Decision-Making.
Introduction
Even though innovation is a major factor for achieving economic growth the forestry sector is considered to be less innovative. Researches regarding the Bulgarian forestry sector are primarily focused on the need for innovative development (Popova, 2019; Paligorov & Doychevska, 2002), evaluation of the innovation activity (Popova, 2013; Stoyanov, 2007), and digitalization in the sector (Popova & Georgieva, 2019). However, they do not offer an effective tool for supporting the decision-making process. This cal lead enterprises in forestry to stay “low-tech” and declining. In recent studies Popova (2019) and Georgieva (2020) state that from all of the forestry industries in Bulgaria the most developed are the companies operating in the field of manufacturing, design, and sales of furniture. In this respect, the current paper aims to propose an adapted methodology for risk assessment at the beginning of the innovation process in Furniture production in Bulgaria. The methodology is based on the information available in the periodic surveys on the innovation activity of the Bulgarian National Statistical Institute (BNSI). To achieve the presented goal the following research tasks are set:
1. To choose the appropriate theoretical framework that utilizes the available data from BNSI. 2. To outline the possible situations and describe them throughout the theoretical approaches in a probabilistic way. 3. To assess the possible risks and their probabilities. 4. To propose a generalized and easy-to-use methodology in favor of furniture enterprises in Bulgaria, and not only.
The applied research methods are based on the Markov Chains methodology as well as on the logical, deductive, and comparative methods. The results of the study support the development of the literature by presenting a more in-depth analysis of the possible ways to use the Markov Chains methodology in terms of the decision-making process regarding innovation and digitalization in furniture enterprises in Bulgaria.
Literature Review
In the literature, covering topics related to innovations planning, finance, and uncertainty estimation, the Markov Chains are widely implemented. Markov process can be defined as any process in which the current state of things depends solely on the state of those immediately preceding the current one (Špicar & Januška, 2015). Markov process creates Markov chain (Arya & Lardner, 1989, p. 366), which is a sequence of similar tries with finite outputs, with a probability of appearance each of them depends only on the previous outcome or so-called a state of the system.
Goh et al. (2018) use Markov Chains to assess the transition parameters in a given uncertainty set for cost efficiency in medical innovations. Doroshkevych (2020) directly involved Markov Chains to elaborate and choose an innovation strategy for the enterprise. They transform the strategic planning into Markov Process. Shpak et al. (2019) throughout Markov chains studied the dynamic and static characteristics of the states of the innovation systems under Industry 4.0 conditions. Sgurev et al. (2013) implemented Markov chains to control the innovation process. Bogatikov et al. (2019) maximized the possible revenues of the new and innovative technology by Markov Chains in order to estimate the optimal schedule of the innovation process. Zhang & Zhang (2009, p. 168) use the method to analyze and predict the stock market index and closing stock price stating that it is more effective under the market mechanism.
In the current study, we provide a methodology partially based on the Markov decision model created by Sgurev et al. (2013), but including the data from innovation surveys made by Bulgarian National Statistical Institute (BNSI). The initial data have been purchased for the needs of the current study in April 2021. The specifics here come from the data, which reveal the usual practices of the enterprises in sector C31 Production of Furniture in Bulgaria and the usual obstacles. To implement the selected model it is used data for the period 2016-2018.
Methodology Used and Data Collection
Markov chain needs the initial state vector and transition matrix. According to the data available in BNSI, the transition of one state to another can be derived from the obstacles investigated by the institute. No matter what kind of innovation a company will undertake the transition from the state of planning to the state of realization will depend on overcoming the struggles like low financing, lack of other resources like human resources, available partners, and market predictability. The initial vector is given by the results of BNSI data analysis. The vector has the following matrix form:

Where ei is the particular initial state, given by the probability of its appearance. The states are six types of obstacles (problems) that enterprises can struggle with according to available data and are as follows:
1. e1 – Lack of financing. The enterprise is problematic in the supply of venture capital, bank loans or subsidies. 2. e2 - High innovation costs. 3. e3 - Lack of other resources. Here the difficulties in ensuring the human resources, partner enterprises, and information are considered as obstacles or problems in front of the innovation process. 4. e4 - Market uncertainty. Uncertainty is a common problem for enterprises that undertake any innovation initiative. 5. e5 – Other problems. 6. e6 – No problems.
The possible initial states find their transformations into the next states if the particular enterprise finds any solutions to remove the obstacle. Otherwise, the innovation initiative transits to the state of No solutions. The so-called in the paper “corresponding states” are the same states as before, but the transition probabilities are these for success or remaining problematic. The initial state vector can be derived by the number of enterprises that face a particular obstacle to the total number of investigated by BNSI enterprises. Based on that, it is calculated the average initial vector for the entire country, following data for the period 2016-2018. This is a combined vector denoted by E. Furthermore in the current study the authors examine possible transitions and situations according to the appearance of one, or another obstacle – not combined. Through this approach, it would be easier for the particular entrepreneur to do the monitoring of the innovation possibilities and to use the Markov chain results to support his decision whether to begin or not an innovation process.
The transition probabilities are denoted by Pi,j, which means that P is the probability of transiting from state i to state j. The probabilities in the study are following:
1. P1,1 is the probability that the enterprise has faced financial problems of supplying the capital for innovations and will face them after the innovation process begin. 2. P1,6 is the probability that the enterprise has resolved the problems. 3. P2,2 is the probability of having high innovation costs and remaining to have such costs. 4. P2,6. is the probability of having high innovation costs and the problem disappears after the transition 5. P3,3 is the probability of not finding candidates for personnel for the innovation implementation and to remain difficult to find reliable business partners or available information for the process or technology. 6. P3,6 is the problems with personnel, partners, and information resolved. 7. P4,4 is the probability of not finding sufficient market information and diminishing uncertainty. 8. P4,6 is the problem with market information was resolved. 9. P5,5 is the probability appear any other problems on the road to innovation implementation. 10. P5,6 is the problem resolved. 11. P6,6 is the enterprise does not have any difficulties doing the innovation process and does not search for any problem solutions.
The transition matrix is presented in Table 1.
| Table 1 Transition Matrix Or P For Innovations Of The Bulgarian Production Of Furniture |
||||||
|---|---|---|---|---|---|---|
| State | e1 | e2 | e3 | e4 | e5 | e6 |
| e1 | P 1,1 | P 1,6 | ||||
| e2 | P 2,2 | P 2,6 | ||||
| e3 | P 3,3 | P 3,6 | ||||
| e3 | P 4,4 | P 4,6 | ||||
Source: own calculations.
Because of the requirement the sum of probabilities in each raw to be equal to 1, the transition probabilities for enterprise to be in state e6 are:
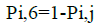 (2)
(2)
They play a compensational role. If any other states do not happen, then the enterprise transit to state e6, i.e. has resolved the problems and the innovation process can continue. The state vectors presenting probability distributions are following:

The vector includes the probability P6=0 because if all other states are presented (by dada from BNSI) there is no unproblematic state (e6). This is not the case with other initial vectors, which are following:
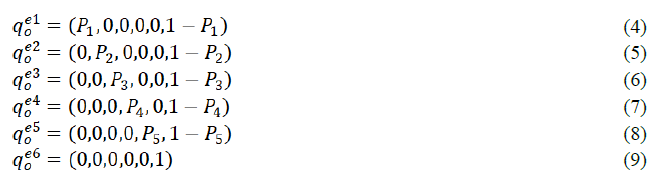
It is clear that the e6 is the recurrent state (Serfozo, 2009, p. 20). If the enterprise is in it, there are no problems with conducting the innovation process, whatever the innovation type is.
According to Sgurev et al. (2013) and Bogatikov et al. (2019) inclusion of complementary elements like an objective function of some economic criteria is a suitable approach to utilize the results of the Markov chain. Through this way, the enterprise will have an understandable and intuitive method for decision-making when beginning an innovation process. Following available data in the innovation database of BNSI the objective function for total costs (innovation costs + losses) is as follows:

Where  are the lost revenues of a particular type of innovation k multiplied by the probability of failure Pi, which is the probability of being in state ei.
 are the costs for the k type of innovation multiplied by the probability of success (which is 1-Pi=P6). Meaning that the enterprise will cover the expenses for the innovation. The possible total costs are relative to the innovation expenses. Through this, different scales of innovation alternatives are equated. Implementing the objective function (10) the enterprise can estimate the possible number of failures before the innovation happens in real. Furthermore, the enterprise can decide whether to begin or not the innovation process at the current moment or to wait for the future moment with fewer obstacles. The numerical calculations in the current study have been created by establishing different initial states. They are singular or combined. For example, an enterprise can face difficulties when looking for funding the innovation, but it can face a combination of different obstacles like lack of staff along with market information. This is why we calculated the probabilities for failures as results of the combination of two, three, four of max five obstacles. The kernel graphs have been calculated to reveal the shape of the density and the most likely probability Pi to be expected.
Results and Discussion
The implementation of the empirical data for equation (3) derived the following initial common vector for the Bulgarian enterprises, planning an innovation:
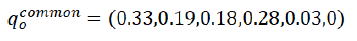
These probabilities are calculated like simple ones or just cases of particular obstacles divided into the total number of cases – 227. The financial problem cases are 74, high innovation costs - 42, other resources problems - 41, lack of market information - 63, and other problems - 7. The highest probability for innovative enterprises is to struggle with financial shortage and the second one is to face high market uncertainty. When an enterprise begins the innovation process it goes into stage one or the post-initial stage. After that, the state of the enterprise has transited from state 0 to state one, thanks to the transition matrix. In state one some of the probabilities or the problems remain. The transition matrix of the Bulgarian furniture industry, when substitute the BNSI data in Table 1 is presented in Table 2.
| Table 2 Transition Matrix For Bulgarian Innovative Enterprises |
||||||
|---|---|---|---|---|---|---|
| Available financing | Reasonable innovation costs | Availability of other resources | Market positioning | Other | No resolvement | |
| Available financing | 0.33 | 0 | 0 | 0 | 0 | 0.67 |
| Reasonable innovation costs | 0 | 0.19 | 0 | 0 | 0 | 0.81 |
| Availability of other resources | 0 | 0 | 0.18 | 0 | 0 | 0.82 |
| Market positioning | 0 | 0 | 0 | 0.28 | 0 | 0.72 |
Source: own calculations
The state one after the transition has been made is:

The vector above presents the strongly reduced probabilities of problems, but they remain, so the managers should keep them in mind. After additional efforts, these probabilities reduce one more time. Targeting to diminish any chance to have some of these problems, the innovative enterprise should transit through the matrix, i.e. to make efforts after every attempt to fix the problems to continue making effort to overcome the issue. In practice, this is hard to interpret, but the state matrices reveal the chance for success if something does not go well after the enterprise make effort to resolve the problem. Even if nothing is done, the transition matrix will move it from period to period. The steady-state approximation is presented in figure 1.

Figure 1: Approximation Of The Steady-State Of The Innovative Enterprise In Bulgarian Production Of Furniture.
The lines on figure 1 reveal that after three periods the problems would diminish and approach 0. This is the most pessimistic option for future development. The efforts can fix, diminish or not influence the obstacles. As a final option, the enterprise can wait for the problems to disappear in about three periods – whatever the periods are likely to be years. All these calculations are under the assumption that all the barriers are presented and their probabilities are close to these estimated above. Nevertheless, in the reality these probabilities can appear in different values or the managers to accept the presence of some of the barriers in a discrete manner – they are there or not. This is the reason in the current study to examine the behavior of the probability of failure in dependence of the different initial states like equations (4) – (9). We tested the Markov chain with different situations and the probability of appearance of some obstacles.
If the managers are fully convinced that some of the barriers are present they can define the probability of 1. After the transition, the probability will be equal to the initial ones. If there are two present obstacles the probability of appearing on any of them is 0.5. If they are three - the probability of each one is 0.333. The same is with four – 0.25 and five – 0.2. The higher the probability of failure the higher the risk. The enterprise should move to another initial state before the beginning of the innovation process. The possible states and probability of appearance of any state of type ei, iϵ[1;5]. States are presented in Table 3.
| Table 3 Different Initial States (Situations) |
|||||||
|---|---|---|---|---|---|---|---|
| Available financing |
Reasonable Innovation costs |
Availability of other resources |
Market positioning |
ther | No problems | Problems | |
| e 1-5 | 0.108 | 0.035 | 0.033 | 0.078 | .001 | 0.746 | 0.254 |
| e1 | 0.165 | 0.000 | 0.000 | 0.000 | .000 | 0.835 | 0.165 |
| e1 e2 | 0.165 | 0.095 | 0.000 | 0.000 | .000 | 0.740 | 0.260 |
| e1 e3 | 0.165 | 0.000 | 0.090 | 0.000 | .000 | 0.745 | 0.255 |
| e1 e4 | 0.165 | 0.000 | 0.000 | 0.140 | .000 | 0.695 | 0.305 |
| e1 e5 | 0.165 | 0.000 | 0.000 | 0.000 | .015 | 0.820 | 0.180 |
| e1 e2 e3 | 0.110 | 0.063 | 0.060 | 0.000 | .000 | 0.767 | 0.233 |
| e1 e2 e4 | 0.110 | 0.063 | 0.000 | 0.093 | .000 | 0.733 | 0.267 |
| e1 e2 e5 | 0.110 | 0.063 | 0.000 | 0.000 | .010 | 0.817 | 0.183 |
| e1 e3 e4 | 0.110 | 0.000 | 0.060 | 0.093 | .000 | 0.737 | 0.263 |
| e1 e3 e5 | 0.110 | 0.000 | 0.060 | 0.000 | .010 | 0.820 | 0.180 |
| e1 e4 e5 | 0.110 | 0.000 | 0.000 | 0.093 | .010 | 0.787 | 0.213 |
| e1 e2 e3 e4 | 0.083 | 0.048 | 0.045 | 0.070 | .000 | 0.755 | 0.245 |
| e1 e2 e3 e5 | 0.083 | 0.048 | 0.045 | 0.000 | .008 | 0.818 | 0.183 |
| e1 e3 e4 e5 | 0.083 | 0.000 | 0.045 | 0.070 | .008 | 0.795 | 0.205 |
| e1 e2 e4 e5 | 0.083 | 0.048 | 0.000 | 0.070 | .008 | 0.793 | 0.208 |
Table 3 shows that the probabilities of success vary with the inclusion of different obstacles. The company must carefully determine the state in which it is currently. The table includes all possible situations, in which the financial factor is present. The set of probabilities for failure are stochastic, because the situations, i.e. states are stochastic. It means the appearance of some of the states and the barriers that caused them to follow some probability distribution. The appearance of some of the probabilities for problems and their values can be defined by another probability of the stochastic process. This is because the initial state probabilities could be different from the implemented in the table, or the combination of barriers could be different, without the knowledge of the managers. In this way, managers can calculate the mathematical expectation for the real interval of probability for problems from table 3. For example, one can estimate whether the probability of not to success is less than 25% or more than it. For this purpose, we estimated the kernel densities and Shapiro-Wilk test for normality. We compared the probabilities for problems from table 3 and the same probabilities including various cases with the absence of e1 – financial problems. The Kernel densities are presented in figure 2, where it is shown that with the increase of the variety of situations, the distribution of the probabilities of failure is getting closer to normal. This statement is also supported by the Shapiro-Wilk test in table 4.
Such an amendment shows that the determination of a mathematical expectation for a certain amount of risk - the probability of failure is mandatory. This reduces the error of setting theoretical initial probabilities, such as 0.5 or 0.3333, or whatever else. Figure 2 and Table 4 show that many states are presented as more the distribution of the probabilities for problems approximate the normal distribution.

Figure 2:Kernel Densities For Problem Probabilities In Case Of Presence Of E1 The Line “Problems” And Line With Various States Without E1 – “Varproblems”.
Implementation Of Probabilities For Choice Of Strategy Before Starting The Innovation Process – A Numerical Example
Managers can determine the approximate initial state of the company before the innovation process begins. They can choose between several innovation strategies based on the innovative alternatives. For example, an enterprise can choose between product or process innovation, based on the initial state, i.e. the presence of barriers. It can also decide between two technological alternatives. The example is following - the enterprise can decide between two alternatives for process innovations:
Alternative 1 with innovation costs of 100000 EUR and possible revenues of 2000000 EUR in the next five years and barriers of financing, finding qualified personnel for the desired technology.
Alternative 2 with innovation costs of 400000 EUR and 3000000 EUR of possible revenues in the next five years. The main problems are financing, high innovation costs, and availability of qualified staff.
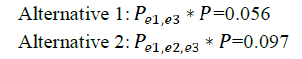
The comparison is possible thanks to the probabilities in Table 3, normal distribution, and formula (10). It is as follows:
Alternative 1
Probability for failure (problems): Pe1,e3=0.255
Probability of Pe1,e3 ≥0.255, or to be present barriers unknown at this time that worsen the situation – normal distribution is used: P=0.22.
Total costs (10):

Alternative 2
Probability for failure (problems): Pe1,e2,e3=0.233
Probability of Pe1,e3 ≥0.255, or to be present barriers unknown at this time that worsen the situation – normal distribution is used: P=0.22.
Total costs (10):

The results show that the more appropriate alternative is 2. Despite of more problems it has, the relative loss is less. This means that the loss has risen less than the innovation direct costs for the technology. In the example, the enterprise should decide on an innovation alternative, if the costs for the technology and revenues are close in both alternatives. However, if there are differences in the barriers then the enterprise has to reduce some of the barriers to begin the innovation. Here the product of the Pi*P is the answer. Taking into consideration the mentioned example, if the second alternative is with the same costs and revenues the two products are:
In this case, the more appropriate alternative is one. The enterprise has to remove the high innovation costs as an obstacle before the start of the innovation process and to move to another state with e1 and e3 present.
Conclusion
The results from the present study show that the information on the innovative activity of the enterprises in the furniture industry, provided by BNSI, is useful for the activity of the entities. It should serve as a basis for planning in any innovation initiative, regardless of the size of the enterprise. The problems with its application in practice can be overcome with the help of Markov chains. The Bulgarian furniture industry is characterized by an average probability of failure of about 22%. This probability, like the others estimated here, can be used in all innovation plans, regardless of the type of innovation and technology. At the same time, managers must use the stochastic correction of the Markov probabilities. By that, they will secure the planning with possible mistakes of preliminary assessment of the situation, when they decide to innovate.
The main limitations of the study are:
1. All of the calculations are made only on the available information provided by Bulgarian National Statistical Institute (BNSI). 2. The implementation of Markov chains has been made with minimum hypothetical assumptions about the behavior of the system, in order not to lead the results in a particular way. 3. The numerical examples are illustrative for the methodology and do not comprise all the possible situations that can appear in reality.
Regardless of the mentioned limitations, the paper results can be used to avoid some decision-making mistakes before the start of the innovation process. This can lower the risk and the level of uncertainty when planning the whole innovation at the micro-level.
Acknowledgement
This article is financed by the University of Forestry in Republic of Bulgaria according to the project from Scientific Research Sector – NIS-B- 1143 / 05.04.2021 - Development of an algorithm for making management decisions for innovation and digitalization in the Forest industry in Republic of Bulgaria, 2021.
References
Paligorov, I., & Doychevska, K. (2002). Study on the opportunities for development of entrepreneurship in the forest policy of Bulgaria, Management and Sustainable Development, 1(2), 124-128.
Popova, R. (2013). Innovations in the furniture sector, Ed. Intel Entrance, Sofia.
Serfozo, R. (2009). Basics of Applied Stochastic Processes. Probability and its Applications. Springer-Verlag Berlin Heidelberg.
Stoyanov, N. (2007). Marketing, Innovation and Entrepreneurship in Forestry, Handbook of the Entrepreneur in Forestry, University of forestry in Bulgaria.