Research Article: 2022 Vol: 26 Issue: 2S
Development of good corporate governance index and its influence on firm fundamental performance, stock performance, and firm value during the Covid and Non-Covid period of companies publicly listed in LQ45
Harry Santoso, Universitas Pelita Harapan
Roy Sembel, Universitas Pelita Harapan
Gracia Shinta S. Ugut, Universitas Pelita Harapan
Edison Hulu, Universitas Pelita Harapan
Rudy Pramono, Universitas Pelita Harapan
Citation Information: Santoso, H., Sembel, R., Ugut, G.S.S., Hulu, E., & Pramono, R. (2022). Development of good corporate governance index and its influence on firm fundamental performance, stock performance, and firm value during the Covid and Non-Covid period of companies publicly listed in LQ45. Academy of Accounting and Financial Studies Journal, 26(S2), 1-29.
Keywords
Corporate Governance Scorecard, Firm Fundamental Performance, Stock Performance, Firm Value
Abstract
This study aims to determine the influence of good corporate governance on firm fundamental performance, stock performance, and firm value of companies (main and comparing samples) during the period of 2012-2020 (9 years). The good corporate governance is proxied by using ASEAN Corporate Governance Scorecard explained in The Globe and Mail guidelines, where the score is taken from the firm’s annual report. There was a total of 18 main and 8 comparing samples selected purposively. The data was analyzed using panel data regression. The results show that partially indicators of good corporate governance have significant value to Return on Asset and Firm Value, but indicators of good corporate governance have no significant value to Stock Performance.
Introduction
Today, the increasing business competition as well as the changing economic condition force companies to maintain their survival. The company management are in charge of everything related to the business and company, making them play an important role in making company decisions. Thus, the company owners need a high-quality management in running the company. All activities and decisions done and made by the management must be in accordance with the company owners’ goals which are also reflected in the company goals: maximizing the shareholders’ or company owners’ prosperity (Rahmawati & Kitriani, 2021).
This triggers a corporate scandal which results in losses, not only for investors, but also for other stakeholders. Corporate scandals in big companies lead to a financial crisis which make the investors and stakeholders begin to lose confidence to invest in the companies and question the issues related to the corporate governance implementation quality (Thakor, 2015). A weak corporate governance can be identified as a possible cause of a corporate scandal (Cheffins, 2015).
To respond to the corporate scandal, a more in-depth corporate regulation is issued and it is known as Sarbanes Oxley-Act (SOX). It refers to a form of regulation that must be obliged by public companies to restore public confidence to invest in companies. The SOX has several provisions, including Section 302 which focuses on increasing the firm value by strengthening the management’s responsibility on financial statements. Section 302 and Section 404 focus on the company which must use effective internal controls according to Committee of Sponsoring Organizations (COSO) (Mahdy, 2019).
An example of corporate scandals in Indonesia is the case of JiwaSraya Insurance where the company was unable to pay the policy that was due as much as IDR 16 trillion to the policyholders for the product issued called JS Saving Plan. This is similar to Asabri case which poorly gained losses in investment as they invested in 14 issuers whose shares fell. This failure was caused by an error in the management of income whereas it was invested to several companies with poor quality of firm performance. These investments made by the management indicated frauds alleged to be a form of corruption. Failures in the corporate governance were caused by the absences of transparency in the financial statements, the management’s accountability and responsibility in managing the investments, and the management’s independence and accuracy in managing the company’s business (Kompas, 2021).
According to Roy (2016), corporate governance is defined as a process providing confidence for the investors to get a reasonable return on the investment they made. It prioritizes the relationship between the management, board of directors, investors and stakeholders. An effective corporate governance requires a mechanism where the management must understand the rights and objectives of the shareholders and be responsible for carrying out and protecting the investments made by the company to maximize the shareholders’ prosperity.
The implementation of corporate governance in Indonesia refers to the General Guidelines for Indonesian Corporate Governance issued by the National Committee of Governance Policy which is based on five basic rules: transparency, accountability, responsibility, independence, and equality or fairness (KNKG, 2019).
Transparency is a principle ensuring that the company discloses all material and information accurately and on time. Accountability is a principle ensuring that the company has a strategic business plan to achieve their goals and an effective monitoring of all levels of management to achieve the company’s visions and missions. In addition, responsibility is a principle recognizing the shareholders’ rights and ensuring the company’s business sustainability. Further, independence refers to a principle which requires the company to be managed independently. Meanwhile, equality or fairness is a principle which protects all shareholders’ rights and ensures equal treatment for them (KNKG, 2019).
Previous studies have discussed this topic, where the implementation of corporate governance is measured using the corporate governance scorecard. A study by Arora & Bodhanwala (2017) entitled of Relationship between Corporate Governance Index and Firm Performance used the corporate governance rating measuring variables of governance such as board size rating, proportion of independent directors, dummy variable in board meetings, proportion of promoter’s equity, institutional shareholding and non-promoter shareholding. Meanwhile, Black, et al., (2017) entitled of Corporate Governance Indices and Construct Validity and used the corporate governance rating measuring the governance variables including board structure, disclosure, board ownership, and shareholder rights. Further, a study by Zitouni (2016) entitled of Index Approach of Corporate Governance used the corporate governance rating and examined the governance variables of ownership structure, structure of board of directors, structure of audit committee, and seven more variables. Dharmawan, Ulum & Wahyuni (2017) entitled of The Effect of Corporate Governance Index on Timeliness of Corporate Internet Reporting used the corporate governance rating and examined 13 aspects of governance variables from The Indonesian for Corporate Governance.
Another study was also done by Putra & Dewayanto (2019) entitled of Analysis of the Effect of Good Corporate Governance Index and Institutional Ownership on Firm Value used the corporate governance rating and examined the governance variables consisting of board composition, audit committee, remuneration committee, shareholder rights, financial affairs & audit, and disclosure.
These previous studies show differences in the measurement of the corporate governance scorecard which indicates that a definite measurement of the quality of corporate governance in the company has not been determined. Therefore, this study aims to examine the measurement of corporate governance indicators using the guidelines developed by Klein, Shapiro & Young (2004) with public companies consistently listed in LQ45 being compared to the companies invested by JiwaSraya & Asabri.
Firm performance is an indicator focused by the investors in evaluating the management performance in carrying out the operational activities. It is in line with one of the company goals to increase the shareholders’ welfare. The use of company resources is a reflection of how the company carries out its operational activities in order to achieve the desired performance which is in accordance with the company goals (Putra & Dewayanto, 2020).
One of the relevant benchmarks in evaluating the firm performance is financial ratios, one of which is Return on Asset (ROA). ROA is an indicator explaining that the higher the ROA, the greater the company’s profitability and the lower the risk faced by the company (Putra & Dewayanto, 2020). In this study, the ROA is used as a measurement of the firm fundamental performance.
Further, a reward obtained from the investors for the number of funds invested in the company in the form of shares is the return on shares. It can be seen in the financial statements published by the company and it has a direct impact on the stock price movements. It also triggers the disclosure of information on the published financial statements which leads to abnormal returns – excess returns that actually occur against the expected returns (Mutamimah, Hartono & Sugiyanto, 2011). In this study, the stock performance is measured by Market Adjusted Return.
In addition, stock price is one variable that can be seen to indicate the firm value. Companies with a high level of stock price imply that they have the ability to carry out their operational activities and earn profits, so that they are able to provide a return on investment to the shareholders (Wahyuni, 2018). In this study, the stock price is measured using Tobin’s Q.
In this study, there are several research problems. The research problems discussed in this study are: (1) the effect of board composition, shareholding and compensation policy, shareholder right policy, and disclosure policy on the firm fundamental performance; (2) the effect of board composition, shareholding and compensation policy, shareholder right policy, and disclosure policy on stock performance; and (3) the effect of board composition, shareholding and compensation policy, shareholder right policy and disclosure policy on firm value.
This study aims to examine how much the implementation of Good Corporate Governance (GCG) taken from the Corporate Governance Scorecard by Klein, Shapiro & Young (2004) published by the companies in their annual reports in influencing the firm fundamental performance, stock performance and firm value.
Literature Review
Agency Theory
Agency theory is seen as a conflict of interest in the company which assumes that all individuals act in accordance with their respective interest. In the agency theory, the principal refers to the shareholder and the agent refers to the management who manages the company. The shareholders expect the managers to act on their interests. For this reason, the managers are given the decision-making authority in managing the company (Abdulkadir & Alifiah, 2020).
Over time, there are several types of agency problems which are not limited to the principals and agents, but also creditors and majority and minority shareholders. Type I refers to the problems between principal and agent. Type II refers to the problems between the principals (majority shareholders and minority shareholders) where the majority shareholders have greater voting rights, are able to make decisions that benefit them, and hinder the minority shareholders’ interests. In this case, the minority shareholders have difficulties defending their interests and welfare. Meanwhile, Type III refers to the problem between principals and creditors where the shareholders tend to invest in projects with higher risk as they assume that they will get higher returns/profits. However, this affects the creditors because if the company funds the project with the debt from the creditors, the shareholders will get a high profit yet the creditors will only get the fixed rate agreed upon if the project runs well. In contrast, if the project is not successful, then the creditors will share the loss with the shareholders (Panda & Leppsa, 2017).
The agency problems cause agency costs. Thus, the implementation of GCG in companies is able to minimize the agency costs because the investors – especially the institutional investors – tend to invest in companies implementing GCG (Nguyen & Doan, 2020).
Stewardship Theory
Stewardship theory views the management working in the company as not concerned with their own interests and seeking profits for themselves. However, the management are given the authority by the stakeholders to run the company and all activities and decisions they made aim to support the company goals and maximize the shareholders’ welfare regardless of the power structure in the company. This theory believes that the principals and agents can share the same goals that shares the benefits for all employees, investors, and other stakeholders. This theory is not seen as a substitute for the agency theory in terms of governance, but as an alternative model that has a transformational change based on the assumptions of agency theory (Torfing & Bentzen, 2020).
Further, this theory also supports the corporate governance, such as the absence of prohibitions related to CEO duality, as this theory believes that the management can be trusted in carrying out the activities in the company (Villiers & Dimes, 2020). This theory views that the management will not only carry out the activities and cooperate with the principals to achieve the company goals, but will also be responsible for and maintain all shareholder ownership although the shareholders do not carry out full supervision (Lode & Noh, 2020).
Stakeholder Theory
The company has the goal to maximize the shareholders’ welfare. However, this may cause the management to prevent them from meeting the corporate social responsibility. The Corporate Social Responsibility (CSR) refers to a company's decision to integrate social and environmental relationships to improve the shareholders’ welfare. It can be carried out in various ways, such as carrying out corporate governance, maintaining relationships between employees and involvement in the community (Hung, 2020).
It is the company's business strategy for the management in carrying out the CSR as a tool to increase trust and relationships among shareholders. Companies can build a good corporate identity, expand consumers and increase revenue. Its implementation can also increase public awareness of the company's brand without having to spend a high cost for marketing activities in introducing the company's brand (Hung, 2020).
This theory emphasizes not only focusing on the interests of shareholders but also focusing on all company stakeholders whereas in carrying out the corporate governance, the company has to carry out their activities for the benefit of all company stakeholders. It can be seen in how the company carries out their CSR activities (Rubino & Napoli, 2020).
Resource Dependency Theory
This theory explains that the strategy, structure and survival of the company depend on the resources to connect with the external environment. These resources refer to the directors who are in charge of carrying out the company activities focusing on achieving the company goals. The Board of Directors is involved in monitoring and making the company decisions (Aprilia, Febriany, Haryono & Marsetio, 2017).
In building the relationships with the external parties, the Board of Directors is expected to have the access to resources important for the company and to protect the company from environmental changes. This theory holds that the directors appointed by the company are expected to carry out the company activities that will maximize the achievement of company goals (Lee, 2014).
According to Lee (2014), there are several advantages the efforts of the Board of Directors in building the relationships with external parties, namely:
a. Directors can build a good reputation by connecting the company with external organizations;
b. Directors have the expertise that can benefit the company, such as knowledge related to technology, finance or previous work experience that can be applied to the company;
c. The coordination between the Board of Directors and management related to the environmental changes that have an impact on the company;
d. To reduce the resource uncertainty, the coordination between the Board of Directors and external parties (such as suppliers) will benefit the company.
Corporate Governance
Corporate governance is a structure and a process used by the company in carrying out, directing, and supervising the company's business activities, including drafting the visions and missions as well as determining the steps to achieve them. Besides, the corporate governance also includes balancing between the company and other stakeholders. such as shareholders, company management, employees, suppliers, customers, creditors, regulators and the wider community (KNKG, 2019).
The Globe & Mail (2002) developed a guide to measure the corporate governance indicators consisting of 4 sub-indices, namely Board Composition, Shareholding and Compensation Policy, Shareholder Right Policy and Disclosure Policy. They were developed based on the regulations and recommendations from US and Canada. The following is the explanation of the sub-indices (Klein, Shapiro & Young, 2004):
a. Board Composition
This sub-index represents the structure, autonomy and effectiveness of the Board of Directors. The autonomy of the Board of Directors is measured using several indices related to independence. Independence is the absence of a relationship between the Board of Directors and the company or group in which the Board of Directors carries out its operational activities. Further, this index aims to determine the effectiveness of the Board of Directors by understanding the regularity in conducting meetings and evaluating the company's operational activities.
b. Shareholding and Compensation Policy
This sub-index is used to measure the incentives obtained by the management that are in line with the company's performance and the interests of shareholders. The company will get a high score if the Board of Directors is required to own the equity shares in the company and have the control over the selection of loans with low interest rates.
c. Shareholder Rights Policy
This sub-index prioritizes the protection of the rights and ability of shareholders to influence the company behavior. It focuses on the ownership of stock options or other shares held by the management that would undermine the shareholder ownership and voting rights.
d. Disclosure and Transparency
This sub-index prioritizes a transparent disclosure of all company conditions, including financial situation, firm performance, ownership, governance and all transactions with related parties.
Return on Asset (ROA)
Return on Asset (ROA) is a profitability ratio indicating the company’s profits in using the company assets. This ratio is one of the important firm performance indicators as it represents the firm’s profitability level (Jimoh, 2018).
Stock Performance
Stock return refers to the return obtained by the shareholders from the stock investments they made in the company. Sources of stock return consist of several main components, such as yield and capital gain (loss). The yield reflects the existence of cash flows obtained by the investors periodically or the investments made, where these profits are obtained in the form of cash and cash equivalents such as dividends. Meanwhile, the capital gain is a movement of increasing stock prices that can go up or down, providing profits or losses to the investors (Ajinto & Herawati, 2013).
Firm Value
Firm value can be seen in the quality of earnings generated by the company which causes errors in the decision making by the users of financial statements, such as the investors and creditors. Besides, the firm value can also be determined by how the company pay attention to the social and community environment (Prakoso, 2020).
Hypotheses
This present study is developed based on a study in The Globe & Mail (2002) which made a guideline to measure the corporate governance indicators consisting of 4 sub-indices, such as Board Composition, Shareholding and Compensation Policy, Shareholder Right Policy and Disclosure Policy which are developed based on the regulations and recommendations from US and Canada.
For this reason, the researchers attempt to conduct a study analyzing the effect of GCG implementation on the firm fundamental performance, stock performance and firm value.
In this study, the independent variable used is the score of Corporate Governance Scorecard published by companies in the financial statements. Meanwhile, the dependent variables used in this study are firm fundamental performance (measured using ROA), stock performance (measured using Market Adjusted Returns), and firm value (measured using Tobin's Q).
Relationship between Board Composition and Firm Fundamental Performance
According to a study conducted by Rashid, et al., (2010) on companies in Bangladesh, it was found that there was a negative relationship between the Board Composition and the firm fundamental performance. It is not in line with a research conducted by Bawaneh (2020) which found no influence between the Board Composition and the firm fundamental performance.
Therefore, the hypothesis that can be proposed is as follows:
H1 Board Composition influences firm fundamental performance (profitability).
Relationship between Board Compositions and Stock Performance
Rani, Yadav & Jain (2013) found a positive relationship between Board Composition and stock performance. This is similar to Brav, et al., (2008) who found that increasing the independence of the Board of Directors would improve the stock performance.
Therefore, the hypothesis that can be proposed is as follows:
H2 Board Compositions influences stock performance.
Relationship between Board Composition and Firm Value
Kiel & Nicholson (2003) claimed that there was a positive relationship between Board Composition and firm value. This is different from the research conducted by Elfaitori (2014) who found no effect between the Board Composition and firm value.
Therefore, the hypothesis that can be proposed is as follows:
H3 Board Compositions influences firm value.
Relationship between Shareholding and Compensation Policy and Firm Fundamental Performance
A study by Vo & Phan (2013) showed that there was a positive influence between Shareholding and Compensation Policy on the firm fundamental performance. Bayu & Hunde (2020) also explained that it supported the agency theory in which the management responsible for the company's activities was given appropriate compensation to reduce conflicts of interest between the principal and the agent.
Therefore, the hypothesis that can be proposed is as follows:
H4 Shareholding and Compensation Policy influences firm fundamental performance.
Relationship between Shareholding and Compensation Policy and Stock Performance
Datta, Iskandar-Datta & Raman (2001) stated that there was a positive relationship between Shareholding and Compensation Policy on stock performance. This is different from the research conducted by Masulis, Wang & Xie (2007) who found no effect between Shareholding and Compensation Policy on the stock performance.
Therefore, the hypothesis that can be proposed is as follows:
H5 Shareholding and Compensation Policy influences stock performance.
Relationship between Shareholding and Compensation Policy and Firm Value
Husni, Rahim & Aprayuda (2019) found that there was a positive relationship between Shareholding and Compensation Policy on firm value. However, Klein, Shapiro & Young (2004) claimed that that there was no influence between Shareholding and Compensation Policy on firm value.
Therefore, the hypothesis that can be proposed is as follows:
H6 Shareholding and Compensation Policy influences firm value.
Relationship between Shareholder Right Policy and Firm Fundamental Performance
Utami & Pernamasari (2019) found that there was a significant positive relationship between the Shareholder Right Policy and firm fundamental performance as measured using ROA. They added that if the company allowed the shareholders to be widely involved in the company, it would increase the ROA. In contrast, Dao & Nguyen (2020) found that the Shareholder Right Policy had a significant negative relationship with ROA, where if the company did not allow the shareholders to participate in the company decisions and limited their shareholder rights, the ROA would increase.
Therefore, the hypothesis that can be proposed is as follows:
H7 Shareholder Right Policy influences firm fundamental performance (profitability).
Relationship between Shareholder Right Policy and Stock Performance
Based on a research conducted by Utami & Pernamasari (2019), there was a positive influence between Shareholder Right Policy and stock performance. They explained that the role of shareholders affected the management performance, so that management would try their best to achieve the shareholder goals. However, this is in contrast to the research conducted by Toudas & Athanasios (2014) who did not find the effect of Shareholder Right Policy on the stock performance.
Therefore, the hypothesis that can be proposed is as follows:
H8 Shareholder Right Policy influences stock performance.
Relationship between Shareholder Right Policy and Firm Value
Sumatriani, et al., (2021) found that there was a significant positive influence between Shareholder Right Policy and firm value. The increased participation of shareholders in the company decisions in relation to the issuance of shares and dividend payments would increase the firm value and make the investors trust and encourage the company to move forward, making a positive impact on the firm performance. Further, a study by Simamora (2020) supported that the Shareholder Right Policy had a significant positive influence on the firm value. He added that the governance mechanism could increase the role of shareholders in supervising to ensure the shareholder involvement in the company decisions.
Therefore, the hypothesis that can be proposed is as follows:
H9 Shareholder Right Policy influences firm value.
Relationship between Disclosure Policy and Firm Fundamental Performance
Previously, Ntim & Soobaroyen (2013) found that there was a positive relationship between Disclosure Policy and firm fundamental performance where a transparent disclosure would reduce information asymmetry and enable the shareholders to supervise the management decisions on the firm fundamental performance. However, this is not in line with the research conducted by Zaman, Arslan & Siddiqui (2014) who found a negative relationship between Disclosure Policy and firm fundamental performance.
Therefore, the hypothesis that can be proposed is as follows:
H10 Disclosure Policy influences firm fundamental performance.
Relationship between Disclosure Policy and Stock Performance
Based on a research conducted by Chen, Chen & Wei (2003), they found a negative relationship between Disclosure Policy and stock performance because the shareholders paid less attention to the disclosure made and only focused on the return to be obtained. This is different from the research conducted by Siallagan (2014) who found a positive relationship between Disclosure Policy and stock performance.
Therefore, the hypothesis that can be proposed is as follows:
H11 Disclosure Policy influences stock performance.
Relationship between Disclosure Policy and Firm Value
Javed & Iqbal (2007) found that there was no effect of Disclosure Policy on firm value because the annual reports published by the company did not fully disclose the information needed by the shareholders. However, Rajakulanajagam & Nimalathasan (2020) claimed that a significant effect was found between Disclosure Policy and firm value.
Therefore, the hypothesis that can be proposed is as follows:
H12 Disclosure Policy influences firm value.
Relationship between Corporate Governance and Firm Fundamental Performance
Jimoh (2018) showed that there was a significant positive effect between corporate governance and ROA. It is in line with the research conducted by Azmy, Anggreini & Hamim (2019) which stated that the presence of corporate governance would make the company more sustainable and earn returns which was in accordance with the shareholders’ interests.
Therefore, the hypothesis that can be proposed is as follows:
H13 Corporate Governance influences firm fundamental performance.
Relationship between Corporate Governance and Stock Performance
Based on a research conducted by Rani, Yadav & Jain (2013), there was a significant positive influence between the corporate governance and stock performance. This is in line with Pagaddut (2020) who stated that with the responsibility and accountability of management, the company would run according to the company goals.
Therefore, the hypothesis that can be proposed is as follows:
H14 Corporate governance influences stock performance.
Relationship between Corporate Governance and Firm Value
Koji, Adhikary & Tram (2020) found that there was a positive relationship between the corporate governance and firm value. In contrast, Rossi, Nerino & Capasso (2015) stated that there was a negative relationship between the corporate governance and firm value.
Therefore, the hypothesis that can be proposed is as follows:
H15 Corporate governance influences firm value.
Relationship of Board Composition, Shareholding and Compensation Policy, Shareholder Right Policy, Disclosure Policy and Corporate Governance on Firm Fundamental Performance, Stock Performance and Firm Value in Companies Consistently Listed in LQ45
LQ45 are 45 companies selected based on liquidity from the stock market and adjusted for 6 months. The companies listed in LQ45 are companies with a high liquidity, good financial condition, good growth prospects, a large market capitalization, and a high stock trading frequency (Rahmawati & Handayani, 2017). The samples used are the main samples consisting of companies consistently listed in LQ45 during the research period of 2012-2020. The LQ45 companies are proven to have a good governance.
Meanwhile, for comparison, the comparing samples are used. They are companies invested by JiwaSraya and Asabri. They were selected for because their fundamentals were questionable or referred to as “fried stocks”, meaning that the stocks invested had a large value at the beginning and fell to the lowest stock price of IDR 50. Moreover, the stocks owned by JiwaSraya were also owned by Asabri. This indicated the existence of good governance (CNBC Indonesia, 2021).
For these reasons, the researches attempted to make a comparison between the two samples with the following hypothesis:
H16 There is a different effect of board composition on the firm fundamental performance (profitability) in the companies consistently listed in LQ45.
H17 There is a different effect of board composition on the stock performance in the companies consistently listed in LQ45.
H18 There is a different effect of board composition on the firm value in the companies consistently listed in LQ45.
H19 There is a different effect of shareholding and compensation policy on the firm fundamental performance (profitability) in the companies consistently listed in LQ45.
H20 There is a different effect of shareholding and compensation policy on the stock performance in the companies consistently listed in LQ45.
H21 There is a different effect of shareholding and compensation policy on the firm value in the companies consistently listed in LQ45.
H22 There is a different effect of shareholder right policy on the firm fundamental performance (profitability) in the companies consistently listed in LQ45.
H23 There is a different effect of shareholder right policy on the stock performance in the companies consistently listed in LQ45.
H24 There is a different effect of shareholder right policy on the firm value in the companies consistently listed in LQ45.
H25 There is a different effect of disclosure policy on the firm fundamental performance (profitability) in the companies consistently listed in LQ45.
H26 There is a different effect of disclosure policy on the stock performance in the companies consistently listed in LQ45.
H27 There is a different effect of disclosure policy on the firm value in the companies consistently listed in LQ45.
H28 There is a different effect of corporate governance on the firm fundamental performance (profitability) in the companies consistently listed in LQ45.
H29 There is a different effect of corporate governance on the stock performance in the companies consistently listed in LQ45.
H30 There is a different effect of corporate governance on the firm value in the companies consistently listed in LQ45.
Relationship of Board Composition, Shareholding and Compensation Policy, Shareholder Right Policy and Disclosure Policy on Firm Fundamental Performance, Stock Performance and Firm Value during the Covid and Non-Covid Period
On March 2, 2020, President Jokowi announced that there were two people affected by Corona virus infected from Japanese in Indonesia. The pandemic does not only last in Indonesia, but throughout the world. For these reasons, this pandemic has influenced and brought impacts on the collapse of the stock market, increasing volatility in the world market. Similarly, on March 5-9, 2020, the Jakarta Composite Index (JCI) declined to 6%. The Financial Service Authority (FSA) also issued a policy shift and allowed the JCI shares for a buyback without the shareholders’ approval (Kompas, 2021). Therefore, the researchers attempt to examine whether the application of corporate governance has any influences during the Covid and non-Covid period. The hypotheses that can be proposed are as follows:
H31 There is a different effect of Board Composition on the firm fundamental performance (profitability) during the Covid and non-Covid period.
H32 There is a different effect of Board Composition on the stock performance during the Covid and non-Covid period.
H33 There is a different effect of Board Composition on the firm value during the Covid and non-Covid period.
H34 There is a different effect of Shareholding and Compensation Policy on the firm fundamental performance (profitability) during the Covid and non-Covid period.
H35 There is a different effect of Shareholding and Compensation Policy with the stock performance during the Covid and non-Covid period.
H36 There is a different effect of Shareholding and Compensation Policy on the firm value during the Covid and non-Covid period.
H37 There is a different effect of Shareholder Right Policy on the firm fundamental performance (profitability) during the Covid and non-Covid period.
H38 There is a different effect of Shareholder Right Policy on the stock performance during the Covid and non-Covid period.
H39 There is a different effect of Shareholder Right Policy on the firm value during the Covid and non-Covid period.
H40 There is a different effect of Disclosure Policy on the firm fundamental performance (profitability) during the Covid and non-Covid period.
H41 There is a different effect of Disclosure Policy on the stock performance during the Covid and non-Covid period.
H42 There is a different effect of Disclosure Policy on the firm value during the Covid and non-Covid period.
H43 There is a different effect of corporate governance on the firm fundamental performance (profitability) during the Covid and non-Covid period.
H44 There is a different effect of corporate governance on the stock performance during the Covid and non-Covid period.
H45 There is a different effect of corporate governance on the firm value during the Covid and non-Covid period.
Methodology
Research Model
as shows in Figure 1, 2 and 3.

Figure 1: Research Model 1

Figure 2: Research Model 2

Figure 3: Research Model 3
The effect of independent variable, interaction variable, and control variable on the dependent variable can be explained to linear functions in the following equations:
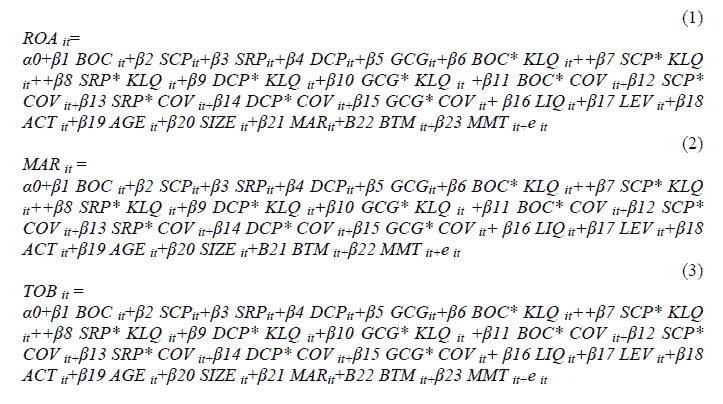
Notes:
BOC : Board of Composition
SCP : Shareholding and Compensation Policy
SRP : Shareholder Right Policy
DCP : Disclosure Policy
GCG : Good Corporate Governance
KLQ : The Company Consistently Listed in LQ45 during The Study Period
COV : Covid and Non-Covid Period
LIQ : Liquidity Ratio
LEV : Leverage Ratio
ACT : Activity Ratio
AGE : Firm Age
SIZE : Firm Size
MAR : Market Adjusted Return
BTM : Book to Market
MMT : Momentum
ROA : Return on Asset
TOB : Tobin’s Q
Α : Constanta
β : Variable Coefficient
e : Error
i : Representing Observation
t : Representing Year
Variable and Measurement
Variable and Measurement
as shows in Table 1.
| Table 1 Operational Definition Of Variables |
|
|---|---|
| Dependent Variable | Measurement |
| Return on Asset | Net Income/Total Asset (Koji, Adhikary & Tram, 2020) |
| Market Adjusted Return | ARit: Abnormal return for company i in period t Rit & Rmt: Return of company i in period t and Return of market index in period t Pt & Pt-1: Stock price in period t and stock price in period t-1 IHSGt & IHSGt-: Composite stock price indext at time t and at time t-1 (Mutamimah, Hartono & Sugiyanto, 2011) |
| Tobin’s Q | Market value of equity+Book value of debt/Book value of total asset (Singh, et al., 2017) |
| Independent Variable | Measurement |
| Corporate Governance Scorecard | Measurement will be made based on the answers of 25 questions taken from the content analysis from the annual reports, financial reports, governance reports or other information provided in the company’s official website with the following detail:
|
| Control Variable | Measurement |
| Liquidity Ratio | Current Asset/Current Liabilities (Bernardin & Indriani, 2020) |
| Leverage Ratio | Total Liabilities/Total Asset (Bernardin & Indriani, 2020) |
| Activity Ratio | Total Sales/Total Asset (Bernardin & Indriani, 2020) |
| Firm Age | The length of time when the company was first established to the research period (Putra & Dewayanto, 2019). |
| Firm Size | Ln Total Asset (Rahmatin & Kristanti, 2020). |
| Market Adjusted Return | ARit: Abnormal return for company i in period t Rit & Rmt: Return of company i in period t and Return of market index in period t Pt & Pt-1: Stock price in period t and stock price in period t-1 IHSGt & IHSGt-: Composite stock price indext at time t and at time t-1 (Mutamimah, Hartono & Sugiyanto, 2011) |
| Book to Market Ratio | Total Equity/stock price x stock volume (Ramadhan, 2012) |
| Momentum | Stock return in the previous period (Gompers, 2003) |
Data and Data Sources
The population of this study is all publicly listed companies on Indonesia Stock Exchange (IDX).
Criteria of the main samples used in this study are all publicly listed companies on IDX consistently listed in the LQ45 during the period of 2012-2020. In total, there are 18 companies used as the main samples of this study.
Meanwhile, criteria of the comparing samples used in this study are:
a. all publicly listed companies on IDX invested by JiwaSraya and Asabri during the period of 2012-2020;
b. IPO stock listed on IDX before 2012;
c. stock not suspended by IDX during the research period of 2012-2020;
d. firms excluded from the samples are the ones with an absence of stock movement for three consecutive months during the research period of 2012-2020.
There are 8 companies used as the comparing samples.
Based on the samples determined, this study attempts to examine the panel data to understand whether the corporate governance indicators influence the firm fundamental performance (profitability), stock performance, and firm value, including the comparison between the main samples and comparing samples.
This study uses a total of 26 samples, consisting of 18 main samples and 8 comparing samples during the research period of 2012-2020 which can be seen in the following Table 2 and Table 3:
| Table 2 Main Samples |
|
|---|---|
| No. | Company |
| 1. | PT Adaro Energy Tbk |
| 2. | PT AKR Corporindo Tbk |
| 3. | PT Astra International Tbk |
| 4. | PT Bank Negara Indonesia Tbk |
| 5. | PT Bank Rakyat Indonesia Tbk |
| 6. | PT Bank Mandiri Tbk |
| 7. | PT Gudang Garam Tbk |
| 8. | PT Indofood CBP Sukses Makmur Tbk |
| 9. | PT Indofood Sukses Makmur Tbk |
| 10. | PT Indocement Tunggal Prakasa Tbk |
| 11. | PT Jasa Marga Tbk |
| 12. | PT Kalbe Farma Tbk |
| 13. | PT Perusahaan Gas Negara Tbk |
| 14. | PT Tambang Batubara Bukit Asam Tbk |
| 15. | PT Semen Gresik (Indonesia) Tbk |
| 16. | PT Telekomunikasi Indonesia Tbk |
| 17. | PT United Tractors Tbk |
| 18. | PT Unilever Indonesia Tbk |
| Table 3 Comparing Samples |
|
|---|---|
| No. | Company |
| 1. | PT Trimegah Sekuritas Indonesia Tbk |
| 2. | PT Astrindo Nusantara Infrastruktur Tbk |
| 3. | PT Mahaka Media Tbk |
| 4. | Bank Pembangunan Daerah Jawa Barat dan Banten |
| 5. | PT Indofarma Tbk |
| 6. | PT Pelat Timah Nusantara Tbk |
| 7. | PT Kimia Farma Tbk |
| 8. | PT Sidomulyo Selaras Tbk |
This study uses a secondary data obtained from financial statements or annual reports published in the company’s official website.
Results and Discussion
There are 26 samples used in the 9-year-research period and in total, there are 234 samples used in this study. Further, this study uses balanced panel data regression with a total observation of 234 samples chosen based on the determined criteria established using the scoring guidelines from The Globe and Mail.
Classical Assumption Test of Model 1
Normality Test
as shows in Table 4.
| Table 4 Results Of Normality Test |
||
|---|---|---|
| Asymp. Sig | 0.091 | Data is normally distributed |
The data is considered normally distributed if the significance level is greater than 0.05. Table 4. shows that the significance level is greater than 0.05. Therefore, the results confirm that the data is normally distributed.
Heteroscedasticity Test
as shows in Table 5.
| Table 5 Results Of Heteroscedasticity Test |
||
|---|---|---|
| Model | Sig. | Conclusion |
| (Constant) | 0.0000 | Heteroscedasticity |
| BOC | 0.0073 | Heteroscedasticity |
| SCP | 0.4559 | No Heteroscedasticity |
| SRP | 0.0000 | Heteroscedasticity |
| DCP | 0.0003 | Heteroscedasticity |
| GCG | 0.0001 | Heteroscedasticity |
| KLQ | 0.5399 | No Heteroscedasticity |
| COV | 0.4924 | No Heteroscedasticity |
| BOCKLQ | 0.2607 | No Heteroscedasticity |
| SCPKLQ | 0.0597 | No Heteroscedasticity |
| SRPKLQ | 0.8895 | No Heteroscedasticity |
| DCPKLQ | 0.0558 | No Heteroscedasticity |
| GCGKLQ | 0.0001 | Heteroscedasticity |
| BOCCOV | 0.7077 | No Heteroscedasticity |
| SCPCOV | 0.0015 | Heteroscedasticity |
| SRPCOV | 0.6256 | No Heteroscedasticity |
| DCPCOV | 0.0128 | Heteroscedasticity |
| GCGCOV | 0.8299 | No Heteroscedasticity |
| LIQ | 0.1696 | No Heteroscedasticity |
| LEV | 0.0000 | Heteroscedasticity |
| ACT | 0.0000 | Heteroscedasticity |
| AGE | 0.0000 | Heteroscedasticity |
| SIZE | 0.0000 | Heteroscedasticity |
| MAR | 0.7653 | No Heteroscedasticity |
| BTM | 0.0000 | Heteroscedasticity |
| MMT | 0.8047 | No Heteroscedasticity |
To perform the heteroscedasticity testing a comparison was made on the absolute residual value of the proposed data with the existing values of the variables studied which exceeds the significance level of 0.05. They include the Board of Composition, Shareholder Right Policy, Disclosure Policy, Good Corporate Governance which interact with LQ45; Shareholding and Compensation Policy and Disclosure Policy which interact with the Covid and non-Covid period; the control variable of Leverage Ratio, Activity Ratio, Firm Age, Firm Size, and Book to Market which experience the heteroscedasticity; while the other variables experience no heteroscedasticity.
Model Testing
Based on the testing of Model 1, the common effect model is selected to process the data. as shows in Table 6.
| Table 6 Results Of Data Processing Of Model 1 |
|||||
|---|---|---|---|---|---|
| ROA | Independent Variable | Coefficient | Std Error | t-stat | Prob |
| BOC | -0.00196 | 0.003474 | -0.564081 | 0.5733 | |
| SCP | 0.012966 | 0.003167 | 4.093973 | 0.0001*** | |
| SRP | -0.00179 | 0.011056 | -0.161925 | 0.8715 | |
| DCP | 0.027902 | 0.005655 | 4.93443 | 0.0000*** | |
| GCG | 0.005184 | 0.001843 | 2.813471 | 0.0053*** | |
| Interaction Variable | |||||
| KLQ | -0.397803 | 0.354383 | -1.122524 | 0.2629 | |
| COV | 0.30791 | 0.347969 | 0.884877 | 0.3772 | |
| BOCKLQ | 0.00528 | 0.002602 | 2.029329 | 0.0437** | |
| SCPKLQ | -0.018886 | 0.002674 | -7.063899 | 0.0000*** | |
| SRPKLQ | 0.022068 | 0.016801 | 1.313476 | 0.1904 | |
| DCPKLQ | -0.00541 | 0.003451 | -1.567654 | 0.1185 | |
| GCGKLQ | -0.004379 | 0.001468 | -2.982476 | 0.0032*** | |
| BOCCOV | 0.00299 | 0.002415 | 1.237814 | 0.2172 | |
| SCPCOV | 0.001088 | 0.002138 | 0.509021 | 0.6113 | |
| SRPCOV | -0.005214 | 0.016309 | -0.319685 | 0.7495 | |
| DCPCOV | -0.022326 | 0.005125 | -4.356266 | 0.0000*** | |
| GCGCOV | -0.000629 | 0.001317 | -0.477919 | 0.6332 | |
| Control Variables | |||||
| LIQ | 0.000439 | 0.003342 | 0.131347 | 0.8956 | |
| LEV | -0.131219 | 0.02863 | -4.58324 | 0.0000*** | |
| ACT | 0.123477 | 0.01274 | 9.691746 | 0.0000*** | |
| AGE | 3.17E-05 | 0.000304 | 0.10434 | 0.9170 | |
| SIZE | 0.012454 | 0.004305 | 2.892847 | 0.0042*** | |
| BTM | -0.011513 | 0.007512 | -1.532608 | 0.1269 | |
| MAR | -0.013488 | 0.031922 | -0.422546 | 0.6731 | |
| MMT | 0.012572 | 0.031839 | 0.394851 | 0.6934 | |
| Adjusted R Squared | 0.723743 | ||||
| F-stat | 0.00000 | ||||
The model equation for the result of regression is as follows:
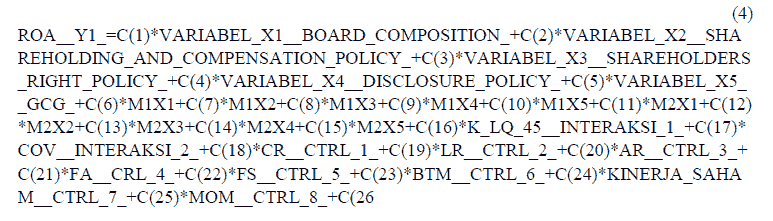
Hypothesis Testing
F Test
In Table 6, it can be seen that the F-count is 28.7462 with a significance level of 0.000 which is less than 0.05 (0.000<0.05). This proves that the regression model fits the study.
Determination Coefficient Test
Based on Table 6, it can be seen that the value of adjusted R-squared is 0.7237. It indicates that 72.37% of the ROA variance can be explained by the changes in the independent variables, interaction variables, and control variables. While the rest 27.63% can be explained by other factors not included in the model.
t Test
Table 6 shows that:
a. The sig. of BOC=0.5733>0.05, indicating that the Board of Composition variable has no significant effect on ROA. This is in line with the research conducted by Bawaneh (2020) which confirmed that the Board of Composition was not one of the variables in determining the ROA of a company.
b. The sig. of SCP=0.0001< 0.05, indicating that the Shareholding and Compensation Policy has a significant effect on ROA. This is in line with the research conducted by Bayu and Hunde (2020) which confirmed that the management had a direct responsibility for the company’s operations which must be compensated to reduce the agent-principal problems.
c. The sig. of SRP=0.8715>0.05, indicating that the independent variable of Shareholder Right Policy has no significant effect on ROA. It is in contrast with a study by Dao and Nguyen (2020) which stated that if a company allowed the shareholder to be widely involved in the company, it would increase the firm fundamental performance.
d. The sig. of DCP=0.0000<0.005, indicating that the independent variable of Disclosure Policy has a significant effect on ROA. It is in line with the research result by Ntim and Soobaroyen (2013) which revealed that a transparent disclosure would reduce the information asymmetry which would enable the shareholders to supervise in relation to the management decisions on the firm fundamental performance.
e. The sig. of GCG=0.0000<0.005, indicating that the independent variable of Good Corporate Governance has a significant effect on ROA. It is in line with Azmy, Anggraeni and Hamim (2019) who found that the existence of corporate governance would make the company more sustainable and earn more returns in accordance with the interests of shareholders.
f. The sig. of KLQ=0.2629 and COV=0.3772, indicating that they have no significant effect on ROA.
g. The sig. of interaction variable of KLQ between SCP on ROA=0.0000 and the interaction variable of KLQ between GCG on ROA=0.0032, indicating that they have a significant effect. Meanwhile, the interaction variable of KLQ between BOC, SRP, and DCP on ROA has no significant interaction effect.
h. The sig. of interaction variable of COV between DCP on ROA=0.0000, indicating that it has a significant interaction effect. However, the interaction variable of COV between BOC, SCP, SRP, and GCG on ROA has no significant interaction effect.
i. The sig. of control variable of LEV=0.0000, ACT=0.0000 and SIZE=0.0042, indicating that they have a significant effect as control variables. However, LIQ, AGE, BTM, MAR and MMT have no significant effect as control variables.
Classical Assumption Test of Model 2
Normality Test
as shows in Table 7.
| Table 7 Results Of Normality Test |
||
|---|---|---|
| Asymp. Sig | 0.027 | Data is not normally distributed |
The data is considered normally distributed if the significance level is greater than 0.05. However, Table 7. shows that the significance level is less than 0.05. Therefore, it can be concluded that the data processed is not normally distributed.
Model Testing
Based on the testing of Model 2, the common effect is selected to process the data. as shows in Table 8.
| Table 8 Results Of Data Processing Of Model 2 |
||||||
|---|---|---|---|---|---|---|
| Abnormal Return | Independent Variable | Coefficient | Std Error | t-stat | Prob | |
| BOC | 0.003348 | 0.007471 | 0.448163 | 0.6545 | ||
| SCP | -0.000335 | 0.006814 | -0.04913 | 0.9609 | ||
| SRP | -0.005647 | 0.023784 | -0.23742 | 0.8126 | ||
| DCP | -0.008424 | 0.012152 | -0.693241 | 0.4889 | ||
| GCG | -7.02E-06 | 0.00335 | -0.002096 | 0.9983 | ||
| Interaction Variable | ||||||
| KLQ | -0.206818 | 0.762326 | -0.271299 | 0.7864 | ||
| COV | 0.14256 | 0.748597 | 0.190437 | 0.8491 | ||
| BOCKLQ | -0.00337 | 0.005593 | -0.602504 | 0.5475 | ||
| SCPKLQ | 0.000642 | 0.005752 | 0.111527 | 0.9113 | ||
| SRPKLQ | 0.010268 | 0.036141 | 0.284101 | 0.7766 | ||
| DCPKLQ | 0.007662 | 0.007407 | 1.034381 | 0.3021 | ||
| GCGKLQ | -0.000145 | 0.002669 | -0.054191 | 0.9568 | ||
| BOCCOV | -0.000949 | 0.005196 | -0.182571 | 0.8553 | ||
| SCPCOV | 0.000725 | 0.004599 | 0.157655 | 0.8749 | ||
| SRPCOV | -0.017168 | 0.035069 | -0.489538 | 0.6250 | ||
| DCPCOV | 0.008317 | 0.011012 | 0.755268 | 0.4509 | ||
| GCGCOV | 0.001152 | 0.002393 | 0.481537 | 0.6306 | ||
| Control Variable | ||||||
| LIQ | 0.000358 | 0.007191 | 0.049806 | 0.9603 | ||
| LEV | -0.007413 | 0.061596 | -0.120355 | 0.9043 | ||
| ACT | 0.014391 | 0.027393 | 0.52534 | 0.5999 | ||
| AGE | 0.000568 | 0.000652 | 0.871716 | 0.3843 | ||
| SIZE | 0.003663 | 0.009259 | 0.395637 | 0.6928 | ||
| BTM | 0.036221 | 0.015969 | 2.268176 | 0.0243** | ||
| MMT | 0.99686 | 0.002239 | 445.1887 | 0.0000*** | ||
| Adjusted R Squared | 0.998924 | |||||
| F-stat | 0.00000 | |||||
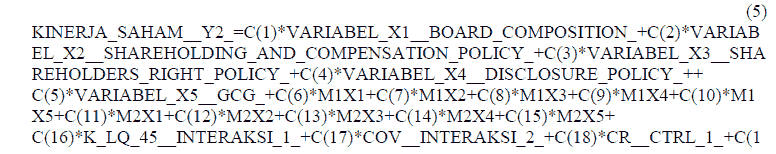
The model equation for the result of regression is as follows:

Hypothesis Testing
F Test
In Table 8, it can be seen that the F-count is 10303.76 with a significance level of 0.000 which is less than 0.05 (0.000<0.05). This proves that the regression model fits the study.
Determination Coefficient Test
Based on Table 8, it can be seen that the value of adjusted R-squared is 0.9989. This indicates that 99.89% of the ROA variance can be explained by the changes in the independent variables, interaction variables, and control variables. While the rest 0.11% can be explained by other factors not included in the model.
t Test
Table 8 shows that:
a. The sig. of BOC=0.6545>0.05, indicating that the independent variable of Board of Composition has no significant effect on stock performance. This is not in line with the research by Rani, Yadav & Jain (2013) which found that the independency of Board of Directors would increase the stock performance.
b. The sig. of SCP=0.9609>0.005, indicating that the Shareholding and Compensation Policy has no significant effect on stock performance. It is in line with a study by Masulis, Wang & Xie (2007) which confirmed that the shareholders assessed the stock performance from the firm performance, not focusing on the policy of compensation to the management.
c. The sig. of SRP=0.8126>0.05, indicating that the independent variable of Shareholder Right Policy has no significant effect on stock performance. It is in accordance with the study by Toudas & Athanasios (2014) which confirmed that the shareholders focused more on the market risks.
d. The sig. of DCP=0.4889>0.05, indicating that the independent variable of Disclosure Policy has no significant effect on stock performance. It is in line with a study by Chen, Chen & Wei (2003) which found that the shareholders did not pay more attention to the disclosure, but more on the orientation of return gained.
e. The sig. GCG=0.9983>0.005, indicating that the independent variable of Good Corporate Governance has no significant effect on the stock performance. It is in contrast with a study by Pagaddut (2020) which showed that the management’s responsibility and accountability would help the company to run according to the company goals.
f. The sig. of KLQ=0.7864 and COV=0.8491 have no significant effect on the stock performance.
g. The sig. of interaction variable of KLQ between BOC on MAR=0.5475, interaction of KLQ between SCP and MAR=0.9113, interaction of KLQ between SRP on MAR=0.7766, interaction of KLQ between DCP on MAR=0.3021, interaction of KLQ between GCG on MAR=0.9568, indicating that they have no significant interaction effect.
h. The sig. of interaction variable of COV between BOC on MAR=0.8553, interaction of COV between SCP on MAR=0.8749, interaction of COV between SRP on MAR -= 0.6250, interaction of COV between DCP on MAR=0.4509, interaction of COV between GCG on MAR=0.6306, indicating that they have no significant interaction effect.
i. The sig. of control variable of BTM=0.0243 and MMT=0.0000, indicating that they have a significant effect as control variables. Meanwhile, LIQ, LEV, ACT, AGE and SIZE have no significant effect as control variables.
Classical Assumption Test of Model 3
as shows in Table 9.
| Table 9 Results Of Normality Test |
||
|---|---|---|
| Asymp. Sig | 0.000 | Data is not normally distributed |
The data is considered normally distributed if the significance level is greater than 0.05. However, Table 9. shows that the significance level is less than 0.05. Therefore, it can be concluded that the data processed is not normally distributed. as shows in Table 10.
| Table 10 Results Of Heteroscedasticity Test |
||
|---|---|---|
| Model | Sig. | Conclusion |
| (Constant) | 0.4371 | No Heteroscedasticity |
| BOC | 0.0070 | Heteroscedasticity |
| SCP | 0.0361 | Heteroscedasticity |
| SRP | 0.5984 | No Heteroscedasticity |
| DCP | 0.0000 | Heteroscedasticity |
| GCG | 0.0044 | Heteroscedasticity |
| KLQ | 0.9992 | No Heteroscedasticity |
| COV | 0.6190 | No Heteroscedasticity |
| BOCKLQ | 0.0000 | Heteroscedasticity |
| SCPKLQ | 0.0189 | Heteroscedasticity |
| SRPKLQ | 0.6498 | No Heteroscedasticity |
| DCPKLQ | 0.0000 | Heteroscedasticity |
| GCGKLQ | 0.0012 | Heteroscedasticity |
| BOCCOV | 0.0417 | Heteroscedasticity |
| SCPCOV | 0.9378 | No Heteroscedasticity |
| SRPCOV | 0.9486 | No Heteroscedasticity |
| DCPCOV | 0.0000 | Heteroscedasticity |
| GCGCOV | 0.0982 | No Heteroscedasticity |
| LIQ | 0.6857 | No Heteroscedasticity |
| LEV | 0.0000 | Heteroscedasticity |
| ACT | 0.0072 | Heteroscedasticity |
| AGE | 0.0000 | Heteroscedasticity |
| SIZE | 0.0000 | Heteroscedasticity |
| MAR | 0.1297 | No Heteroscedasticity |
| BTM | 0.0000 | Heteroscedasticity |
| MMT | 0.5380 | No Heteroscedasticity |
To perform the heteroscedasticity testing a comparison was made on the absolute residual value of the proposed data with the existing values of the variables studied which exceeds the significance level of 0.05. They include the Shareholding and Compensation Policy, Disclosure Policy, and Good Corporate Governance which interact with KLQ; Board of Composition and Disclosure Policy which interact with COV; the control variable of Leverage Ratio, Activity Ratio, Firm Age, Firm Size and Book to Market which experience the heteroscedasticity; while other variables experience no heteroscedasticity.
Model Testing
Based on the testing of Model 3, the common effect model is selected to process the data. as shows in Table 11.
| Table 11 Results Of Data Processing Of Model 3 |
|||||
|---|---|---|---|---|---|
| Tobin's Q | Independent Variable | Coefficient | Std Error | t-stat | Prob |
| BOC | -1.281236 | 0.472483 | -2.71171 | 0.0072*** | |
| SCP | 0.991571 | 0.430717 | 2.302139 | 0.0223** | |
| SRP | -2.96948 | 1.503636 | -1.974866 | 0.0496** | |
| DCP | 2.754225 | 0.769026 | 3.581445 | 0.0004*** | |
| GCG | 0.037106 | 0.239724 | 0.154788 | 0.8771 | |
| Interaction Variable | |||||
| KLQ | -86.0886 | 48.19659 | -1.786197 | 0.0755* | |
| COV | -10.37526 | 47.32439 | -0.219237 | 0.8267 | |
| BOCKLQ | 1.102684 | 0.353876 | 3.116014 | 0.0021*** | |
| SCPKLQ | -1.614077 | 0.363607 | -4.439074 | 0.0000*** | |
| SRPKLQ | 3.569662 | 2.284995 | 1.562219 | 0.1197 | |
| DCPKLQ | -0.682339 | 0.469384 | -1.453688 | 0.1475 | |
| GCGKLQ | 19.30511 | 15.12851 | 1.276075 | 0.2033 | |
| BOCCOV | 0.707612 | 0.328493 | 2.154113 | 0.0324** | |
| SCPCOV | -0.214299 | 0.290748 | -0.737059 | 0.4619 | |
| SRPCOV | 0.616838 | 2.218032 | 0.278102 | 0.7812 | |
| DCPCOV | -1.960132 | 0.697008 | -2.812207 | 0.0054*** | |
| GCGCOV | -4.447828 | 13.3596 | -0.332931 | 0.7395 | |
| Control Variable | |||||
| LIQ | -0.260386 | 0.454551 | -0.572843 | 0.5674 | |
| LEV | 22.4577 | 3.893745 | 5.767635 | 0.0000*** | |
| ACT | 12.66735 | 1.732721 | 7.310671 | 0.0000*** | |
| AGE | 0.083029 | 0.041295 | 2.010633 | 0.0456 | |
| SIZE | -1.223516 | 0.585481 | -2.089761 | 0.0378** | |
| BTM | -1.299816 | 1.021635 | -1.27229 | 0.2047 | |
| MAR | -3.212688 | 4.341423 | -0.740008 | 0.4601 | |
| MMT | 3.336171 | 4.330107 | 0.770459 | 0.4419 | |
| Adjusted R Squared | 0.631644 | ||||
| F-stat | 0.00000 | ||||
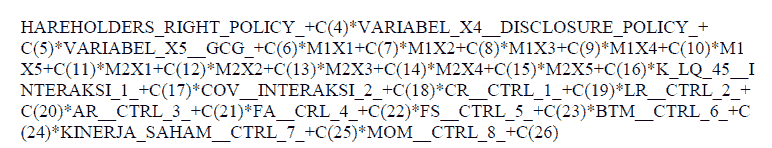
The model equation for the result of regression is as follows:

Hypothesis Testing
F Test
In Table 11, it can be seen that the F-count is 19.1609 with a significance level of 0.000 which is less than 0.05 (0.000<0.05). This proves that the regression model fits the study.
Determination Coefficient Test
Based on Table 11, it can be seen that the value of adjusted R-squared is 0.6316. It indicates that 63.16% of the ROA variance can be explained by the changes in the independent variables and control variables. While the rest 36.84% can be explained by other factors not included in the model.
t Test
Table 11 shows that:
a. The sig. of BOC=0.0072<0.05, indicating that the independent variable of Board of Composition has a significant effect on the firm value. It is in line with Kiel and Nicholson (2003) who explained the importance of management composition in supervising and running the company’s operational activities.
b. The sig. of SCP=0.0222<0.05, indicating that the independent variable of Shareholding and Compensation Policy has a significant effect on the firm value. It is in line with a study by Husni, Rahim and Aprayuda (2019) which found that the compensation was one of the factors improving the management performance in running the operational activities which simultaneously would increase the firm value.
c. The sig. of SRP=0.0496<0.05, indicating that the independent variable of Shareholder Right Policy has a significant effect on the firm value. It is in accordance with Sumatriani et al. (2021) who stated that the increase in the participation of shareholders in the company’s decisions in issuing shares and dividend payment would increase the firm value.
d. The sig. of DCP=0.0004<0.005, indicating that the independent variable of Disclosure Policy has a significant effect on the firm value. It is in line with Rajakulanajagam and Nimalathasan (2020) who found that the firm’s transparent disclosure would increase the shareholders’ confidence and firm value.
e. The sig. of GCG=0.8771>0.05, indicating that the independent variable of Good Corporate Governance has no significant effect on the firm value. It is different with a study by Koji, Adhikary and Tram (2020) who found that the implementation of corporate governance would increase the firm value as the shareholders also assessed the implementation of corporate governance in addition to the firm performance..
f. The sig. of KLQ=0.0755, indicating that it has a significant effect on the firm value and COV=0.8267 which indicates that it has no significant effect on the firm value.
g. The sig. of interaction variable of KLQ between BOC on Firm Value=0.0021, interaction variable of KLQ between SCP on Firm Value=0.000, indicating that they have a significant effect. Meanwhile, the interaction variable of KLQ between SRP on Firm Value=0.1197, interaction of KLQ between DCP on Firm Value=0.1475, interaction of KLQ between GCG on Firm Value=0.2033 show that they have no significant interaction effect.
h. The sig. of interaction variable of COV between BOC on Firm Value=0.0324, interaction variable of COV between DCP on Firm Value=0.0054, indicating that they have a significant effect. However, the interaction variable of COV between SCP and Firm Value=0.4619, interaction of COV between SRP on Firm Value=0.7812, interaction of COV between GCG on Firm Value=0.7395 show that they have no significant interaction effect.
i. The sig. of control variable of LEV=0.0000, ACT=0.0000 and SIZE=0.0378, indicating that they have a significant effect as control variables. However, LIQ, AGE, BTM, MAR and MMT have no significant effect as the control variables.
Conclusion
This study investigates the relationship between board of composition, shareholding and compensation policy, shareholder right policy, and disclosure policy as indicators of corporate governance on return on asset, stock performance and firm value. There are a total of 18 main samples consisting of firms consistently listed in LQ45, and 8 comparing samples consisting of firms invested by JiwaSraya and Asabri. The results of this study offer essential implications on the implementation of good corporate governance of the firms in Indonesia.
At the present, the business competition among companies is growing and both micro and macroeconomic conditions are increasingly challenging, forcing the companies to have a way to run their operational activities to achieve the company goals: increasing the prosperity of shareholders. Further, the companies must also make their shareholders believe in their business activities carried out by implementing a good corporate governance.
Based on the results of this study, it can be concluded that only several indicators of corporate governance which have a significant effect on the ROA and firm value. Meanwhile, the corporate governance indicators have no significant effect on the stock performance. These findings imply that the investors would still consider a good corporate governance as an important guideline that should be implemented by the companies in improving the firm performance which would also simultaneously increase the firm value in the investors’ perspectives.
Further, this study also benefits the management in investigating which indicators of corporate governance that play an important role in bringing effects on the firm performance. Therefore, beside focusing on the operational activities, the company management must also comply with the governance which creates added value considered by the shareholders in assessing the firm performance. Furthermore, this study also benefits the shareholder in investigating whether the corporate governance indicators are an important guideline that needs to be considered in assessing the firm’s operational conditions. Apart from considering the firm performance, the investors could be more confident that the management conducts the business operations in a transparent and obedient manner according to the applicable law.
Limitations and Suggestions
This study has several limitations. First, this study only uses the scoring guidelines from The Globe and Mail. Future researches are suggested to use a qualitative and quantitative testing in forming the corporate governance scoring in relation to investigate its effect on the firm fundamental performance, stock performance and firm value. Second, this study uses a 9-year-research period. Future researchers are expected to use a longer research period. Third, the comparing samples of this study are cases of JiwaSraya and Asabri, and LQ45. Future researches are expected to use other sample criteria in investigating the effect of good corporate governance on the firm fundamental performance, stock performance, and firm value.
References
Umar, A., & Alifiah, M.N. (2020). Review of related literature on the influence of corporate governance attributes on corporate social responsibility disclosure. Journal of Critical Reviews, 7(7).
Aprilia, A.W., Febriany, R., Haryono, L., & Marsetio, N.C. (2020). The effect of the characteristics of directors on the performance of companies listed on the Indonesia Stock Exchange. Accounting journal, 12(2), 233-255.
Arora, A., & Bodhanwala, S. (2017). Relationship between corporate governance index and firm performance: Indian evidence. Global Business Review, 19(3), 675-689.
Crossref, Indexed at, Google Scholar
Azmy, A., Anggreini, D.R., & Hamim, M. (2019). Effect of good corporate governance on company profitability RE & property sector in Indonesia. Accounting journal, 15(1).
Crossref, Indexed at, Google Scholar
Bawaneh, S.S. (2020). Impact of corporate governance on financial institution’s performance: A board composition case. Asian Economic and Financial Review, 10(1), 54-63.
Crossref, Indexed at, Google Scholar
Bayu, K.B., & Hunde, D.A. (2020). Corporate governance and its effects on financial performance of banks evidence from selected private commercial banks in Ethiopia. Journal of Economics and International Finance, 12(4), 187-195.
Crossref, Indexed at Google Scholar
Black, B., Carvallho, A.G., Khanna, V., Kim, W.C., & Yutroglu, B. (2017). Corporate governance indices and construct validity. Finance Working Paper, 483.
Crossref, Indexed at Google Scholar
Cheffins, R.B. (2015). The corporate governance movement, banks, and the financial crisis. Theoretical inquiries in law, 16(1).
Crossref, Indexed at, Google Scholar
Chen, K.C.W., Chen, Z., & Wei, K.C.J. (2003). Disclosure, corporate governance, and the cost of equity capital: Evidence from Asia’s emerging markets. SSRN.
Crossref, Indexed at, Google Scholar
Dao, T.T.B., & Nguyen, P.H.C. (2020). Analysis of corporate governance index using ASEAN balanced scorecard and firm performance. Research Journal of Finance and Accounting, 11(6).
Dharmawan, I.C., Ulum, Ihyaul., & Wahyuni, E.D. (2017). The effect of the corporate governance index on the timeliness of corporate internet reporting (empirical study of participating companies in the corporate governance perception index). Scientific Journal of Accounting, 15(2).
Husni, T., Rahim, R., & Aprayuda, R. (2019). Cash compensation, corporate governance, ownership and dividend policy on banking performance. Advances in Economics, Business and Management Research, 132.
Crossref, Indexed at, Google Scholar
Kiel, G.C., & Nicholson, G.J. (2003). Board composition and corporate performance: How the Australian experience informs contrasting theories of corporate governance. Blackwell Publishing.
Crossref, Indexed at, Google Scholar
Klein, P., Shapiro, D., & Young, J. (2004). Corporate governance, family ownership and firm value: The Canadian evidence. CIBC Centre for Corporate Governance and Risk Management.
Crossref, Indexed at, Google Scholar
KNKG. (2019). General guidelines for Indonesian corporate governance. Jakarta: Publisher of the National Committee on Governance.
Koji, K., Adhikary, B.K., & Tram, L. (2020). Corporate governance and firm performance: A comparative analysis between listed family and non-family firms in Japan. Journal of Risk and Financial Management.
Crossref, Indexed at, Google Scholar
Jimoh, I., Adesina, K.O., Olufowobi, T.A., & Ayinde, P.K. (2018). Corporate governance and return on assets of quoted banks in Nigeria. International Journal of Business and Management Review, 6(10), 1-13.
Lee, P.C. (2014). A theoretical analysis of the audit committee’s role in China. Journal of management and business research, 14(5).
Lode, N.A., & Noh, I.M. (2020). Corporate governance disclosures and family firm’s performance: The moderating role of CEO choice. Journal of Critical Reviews, 7(3).
Mahdy, F.D. (2019). Corporate governance and the financial crisis: What we have missed? Journal of accounting and finance, 19(2).
Masulis, R.W., Wang, C., & Xie, F. (2007). Corporate governance and acquirer returns. The Journal of Finance, 62(4).
Crossref, Indexed at, Google Scholar
Mutamimah, Hartono, S., & Sugiyanto, E.K. (2011). Model of increasing stock returns and financial performance through corporate social responsibility and good corporate governance on the Indonesia Stock Exchange. Journal of Theoretical and Applied Management, 1.
Ntim, C.G., & Soobaroyen, T. (2013). Corporate governance and performance in socially responsible corporations: New empirical insights from a neo-institutional framework. Corporate Governance: An International Review, 468-494.
Crossref, Indexed at, Google Scholar
Nguyen, A.H., Doan, D.T., & Nguyen, L.H. (2020). Corporate governance and agency cost: Empirical evidence from Vietnam. Journal of Risk and Financial Management.
Crossref, Indexed at, Google Scholar
Pagaddut, J.G. (2020). The effect of corporate governance on abnormal returns around business combination using PLS-SEM. International Journal of Management, 11(9).
Panda, B. & Leepsa, N.M. (2017). Agency theory: Review of theory and evidence on problems and perspectives. Indian Journal of Corporate Governance, 10(1), 74-95.
Crossref, Indexed at, Google Scholar
Putra, I.M.S., & Dewayanto, T. (2019). Analysis of the influence of good corporate governance index and institutional ownership on company performance. Journal of Accounting, 8(4).
Rahmawati, I., & Kitrianti, P. (2021). The effect of good corporate governance on the company's financial performance. Journal of Education, Accounting and Finance, 4(1).
Rajakulanajagam, N., & Nimalathasan, B. (2020). Corporate transparency and firm value: Evidence from Sri Lanka. 6th International Conference for Accounting Researchers and Educators.
Crossref, Indexed at Google Scholar
Rani, N., Yadav, S.S., & Jain, P.K. (2013). Impact of corporate governance on abnormal returns of mergers and acquisitions. Procedia Economics and Finance. 5.
Crossref, Indexed at Google Scholar
Rashid, A., Lodh, S.C., Zoysa, A.D., & Rudkin, K. (2010). Board composition and firm performance: Evidence from Bangladesh. Finance Journal, 4.
Crossref, Indexed at Google Scholar
Roy, A. (2016). Corporate governance and firm performance: An exploratory analysis of Indian listed companies. Jindal Journal of Business Research, 3(1&2), 1-28.
Crossref, Indexed at Google Scholar
Rubino, F., & Napoli, F. (2020). What impact does corporate governance have on corporate environmental performances? An empirical study of Italian Listed Firms. Journal of Sustainability.
Crossref, Indexed at, Google Scholar
Sumatriani, S., Pagulung, G., Said, D., & Pontoh, G.T. (2021). The effects of shareholders’ rights, disclosures, and transparency on firm value. Journal of Asian Finance, Economics and Business, 8(3).
Crossref, Indexed at Google Scholar
Thakor, V.A. (2015). The financial crisis of 2007-2009: Why did it happen and what we did to learn? Review of Corporate Finance Studies, 4(2).
Crossref, Indexed at Google Scholar
Torfing, J., & Bentzen, T.O. (2020). Does stewardship theory provide a viable alternative to control fixated performance management. Journal Administration, 10(86).
Crossref, Indexed at Google Scholar
Toudas, K., & Athanasios, B. (2014). Corporate governance and its effect on firm value and stock returns of listed companies on the Athens stock exchange. European Research Studies, 17(2).
Utami, W., & Pernamasari, R. (2019). Study on ASEAN listed companies: Corporate governance and firm performance. International Journal of Business, Economics and Law, 19.
Villiers, C.D., & Dimes. R. (2020). Determinants, mechanisms and consequences of corporate governance reporting: A research framework. Journal of Management and Governance, 25, 7-26.
Crossref, Indexed at Google Scholar
Wahyuni, F. (2018). Firm value, corporate governance index and capital structure. Scientific Journal of Accounting and Business, 13(2).
Zitouni, T. (2016). Index approach of corporate governance. Global Journal of Management and Business Research, 16.
Received: 24-Dec-2021, Manuscript No. AAFSJ-21-10007; Editor assigned: 26-Dec-2021, PreQC No. AAFSJ-21-10007 (PQ);Reviewed: 14-Jan-2022, QC No. AAFSJ-21-10007; Revised: 17-Jan-2022, Manuscript No. AAFSJ-21-10007 (R); Published: 24-Jan-2022