Research Article: 2021 Vol: 25 Issue: 1
Dividend Policy: Scores Modeling Within Neutral Implementation Approach Conditions
Sergey Krylov, Ural Federal University, Russian Federation
Abstract
The article treats a concept of the formalized modeling of the dividend policy scores and company marketing performance scores derived (stock market position) within neutral dividend policy implementation approach conditions as an instrument of the scores analysis and forecasting. The methodology of the research consists of the Dividend Irrelevance theory, Dividend Policy Significance theory and sustainable company development concept. It has been stated that a formalized approach of the dividend policy implementation presumes a construction of the basic relevent scores models characterizing the company dividend policy and its marketing performance as Dividend Payout, Dividend Cover, expected Share Price, Dividend Yield, Price / Earnings Ratio (common stock price/earnings ratio). The formalized models of the scores mentioned are applicable for a forecast-analytical scores evaluation and their variances as well by estimating an impact of the models defining factors exercised by the appropriate factoring analysis method within the neutral dividend policy implementation approach conditions. The conclusion is drawn, that the formalized models of the dividend policy scores and company marketing performance scores derived, having been developed, are an effective instrument for their forecasting and analysis so that proactive decisions to manage the company dividend policy implementation within neutral approach conditions are ensured.
Keywords
Dividend Policy, Neutral Approach, Analysis, Forecasting, Modeling, Company.
JEL Classifications
G32, G34, G35
Introduction
In present-day environment a selection of the dividend policy as a complex of decisions dealing with the Dividend Payout to shareholders is an essential aspect of the Public Limited Company (PLC) operation. The Dividend payout decisions are generally referred to financial decisions as dividend payables reduce the company retained earnings and thereby affect the company financial position.
Meanwhile, the dividend policy on the one hand has to ensure the basic financial management goal to be attained, i.e., the maximum shareholders well-being, on the other, take into account all company stakeholders’ interests.
Therefore, the dividend policy management developing and justifying, an important role is paid to the formalized analysis and forecasting of the scores related to the requirements stated above.
Previous Research
It should be noted, that the issue of the dividend policy scores analysis and forecasting has been so far researched and covered in the relevant references, (Akhigbe & Madura, 1996; Black, 1976; Block et al., 2011; Brealey et al., 2017; Brigham & Houston, 2015; Brooks, 1996; Fama & French, 1989; Goetzmann & Jorion, 1995; Helfert, 2001; Higgins et al., 2016; Lambrecht & Myers, 2012; Petit, 1972; Rozeff, 1982; Shim & Siegel, 2008; Van Horne, 1989).
Generalizing and classifying their views we present the key scores employed to analyze and forecast the company dividend policy as they form a sufficiently important company marketing performance scores subgroup (stock market position) in the following (Table 1).
| Table 1 Key Scores of the Company Dividend Policy Analysis and Forecasting (Compiled by the Author of the Paper) | ||
| Score | Estimation formula | |
| Numerator | Denominator | |
| Dividend Payout (formula 1) | Dividend | Earning per Share |
| Dividend Payout (formula 2) | Dividends | Net income – Preferred Dividends |
| Dividend Cover | Earnings per Share | Dividend |
| Dividend Yield | Dividend | Share Price |
| Share Price/Dividend | Share Price | Dividend |
| Equity Profit | Common and Preferred Dividends | Net Income |
| Preferred Dividend Coverage | Net Income | Preferred Dividends |
| Common/Preferred Dividend | Dividends | Preferred Dividends |
The estimated ratio values in Table 1 are analyzed in their dynamics compared with the plan and other issuers. The final analysis concludes the company dividend policy efficiency degree (the most efficient, generally efficient, and non-efficient) and the change causes.
Furthermore, the analysis and forecasting by the relevant determined factoring models construction enables to determine the dividend policy scores impact on the basic company performance scores, first and foremost Price / Earnings Ratio.
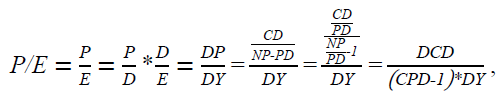
A factoring model of Price / Earnings Ratio is constructed as follows:
 (1)
(1)
where P/E – Price / Earnings Ratio;
DCD – Common/Preferred Dividend;
CPD – Preferred Dividend Coverage;
DP – Dividend Payout;
DY – Dividend Yield;
P – Share Price;
E – Earnings per Share;
D – Dividend;
CD – Dividends;
PD – Preferred Dividends;
NP – Net Income.
The factoring Price / Earnings Ratio model serves as its forecasting value instrument basing on the anticipated values of the defining ratio factors.
Relying on the company dividend policy analysis and forecasting results the management decisions are worked out.
Having generalized the views of the previous researches covering a present-day state of the problem considered in the article we transfer to the methodology of the research.
Methodology of Research
The methodology of the research, the results being presented in the paper, is based on the following concepts:
a. Dividend Irrelevance theory;
b. Dividend Policy Significance theory;
c. Sustainable company development concept.
The “corner stone” of the dividend policy defining its kinds (methods) is, in the end, the ratio between common stock dividend and earnings per share (Dividend and Net Income and Preferred Dividend net) that makes Dividend Payout (or Dividend Cover in inverse proportion to it) the most important score for the dividend policy analysis.
The value estimation results depend, for the most part, on the dividend policy implementation approach selected: passive or active one (Van Horne, 1989).
A passive dividend policy implementation approach or Dividend Irrelevance theory developed by Miller & Modiliani (1961), implies, the Dividend Payout, with the set investment decisions choice, being a mere part of a general picture of no impact on the investors’ well-being. Miller & Modiliani consider a company value to be defined exclusively by its assets yield or its investment policy rather than Equity Profit and retained earnings.
In other words, the Dividend Payout presents a “passive balance” left after the company investment projects funding. The Dividend Payout value changes periodically in accordance with the variation of the investment projects number acceptable by the company management. Should the company run a huge number of beneficial projects then the Dividend Payout would likely equal zero. Vice versa, a lack of profitable investment opportunities would drive the Dividend Payout to 1. The Dividend Payout value would fall from 0 to 1 for any intermediate situation (Van Horne, 1989). The shareholders seem to be indifferent to the factor of their well-being improvement either Dividend or fair value rise owing to the company investment projects implementation.
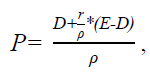
A formalized picture of the passive dividend policy approach is James E. Walter model (Walter, 1956) considered to be the first and favorable in terms of its simplicity and visualization:
 (2)
(2)
where P – forecast Share Price,
D – Dividend,
E – Earnings per Share,
r – Investment company profitability,
ρ - market capitalization level (an average market discount rate employed to determine expected cash flows).
Under the active dividend policy approach or Dividend Policy Significance theory proposed by M. Gordon (Gordon, 1963) and G. Lintner (Lintner, 1962) the dividend payout decisions play an essentially active role. The thing is that in conditions of uncertainty inherent in practically any company activity in market environment it does matter for the investors whether they obtain their income in the form of dividends or Share Price rise. The Dividend Payout provides a sense of certainty to the shareholders since the dividends are referred to current income rather than capital gain in the future. That is why the investors are concerned about the factors improving their well-being: Dividend or Share Price gain due to the company investment projects implementation. Moreover, if potential investors prefer earlier uncertainty settlement, they will be prepared to pay higher Share Price entitling higher Dividend (Van Horne, 1989).
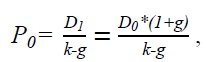
The formalized reason in favor of the active dividend policy implementation is the economic growth model by M. Gordon (Gordon, 1959):
 (3)
(3)
where P0 – forecast current (theoretical) share value at zero moment,
D1 – expected future period Dividend,
D0 – present period Dividend,
k – acceptable discount rate (Equity Profit stipulated by investors),
g – Dividend growth rate (taken as constant in time).
The above models (2) and (3) are considered as formalized instruments of the dividend policy forecasting and management within active and passive implementation approach defining the relevant criteria (Van Horne, 1989).
The following criteria provide a sufficiently distinct definition of the passive dividend policy:
a. A need for accounting of the company financial requirements and financial budget accuracy.
b. A necessity for the required company liquidity to be retained.
c. A consideration of the opportunity for debt capital employment at beneficial terms.
d. A research of the Dividend Payout change impact on other share prices in the industry.
e. A need for taking into account potential investors expectations.
f. A necessity for retaining control over the company.
g. A need for taking into account Dividend limitations stipulated by the contracts.
The active dividend policy is to presume a kind of confidence on the part of shareholders towards the company anticipating a part of the Dividend to be reinvested at their free-will. It should be taken into account that the company dividend policy is to provide both maximum shareholders well-being and its stakeholders’ interests (suppliers, customers, employees, government, etc.) so that a sustainable company development is ensured in the long run providing a long-term company value (Dunphy et al., 2007; Freeman, 2010; Friedman & Miles, 2006).
Having briefly described the methodology of the research, the results being presented in the article, the author comes to its detailed discussion.
Results and Discussion
The postulated above statement that the dividend policy is to facilitate the achievement of the basic financial management goal maximum shareholders well-being, on the one hand, take into account other company stakeholders on the other, so that a sustainable company development is ensured in the long run. The balance is to be attained between passive and active approaches within so called neutral dividend policy implementation approach that considers both the need of the financially beneficial investment projects and dividend payout to company shareholders (non-residual principle) driving its common stock to maximum Share Price.
Formalization of the neutral dividend policy implementation approach assumes appropriate models construction of Dividend Payout, Dividend Cover and Expected Share Price.
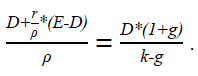
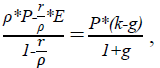
To construct the models of the Dividend Payout, Dividend Cover let us set the Expected Share Price estimated under Walter’s model (2), equal to that determined under M. Gordon model for the economic growth (3) of the forecast current (theoretical) Share Price gain at zero moment; anticipating that a current expected Dividend complies with its Share Price (Van Horne, 1989) essential for the Stock Market condition:
 (4)
(4)
entering a common symbol for a Dividend as D (D = D0).
We obtain the following equation:
 (5)
(5)
By a number of transformations in formula (5) we get the Dividend Payout (DP) and Dividend Cover (DC) models:
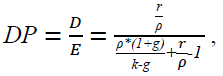 (6)
(6)
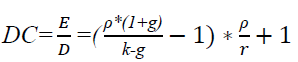 (7)
(7)
The formulae (6) and (7) demonstrate that in the neutral dividend policy implementation conditions the Dividend Payout and Dividend Cover are influenced by the following factors: investment company profitability, market capitalization level, Equity Profit required by investors and Dividend gain rate taken as constant in time. The Dividend Payout growth and Dividend Cover decrease correspondingly would be facilitated by the increase of the investment company profitability and Equity Profit required by investors, Dividend gain rate and market capitalization level fall as well. And vice versa the Dividend Payout decline and Dividend Cover rise would result from the decrease of the investment company profitability and Equity Profit required by investors, Dividend gain rate and market capitalization level drop. The estimation of the defining factors impact on the outcome scores variances in the models (6) and (7) is exercised with the relevant factoring analysis methods.
The Dividend Payout (formula 6) and Dividend Cover (formula 7) models having been constructed by the author of the article might be applied for the forecasting-analytical ratios values estimation within the neutral dividend policy implementation conditions. Other dividend policy scores analysis (e.g, common stock profitability (Dividend Yield)) and company market performance (e.g. Share Price) might be estimated with the models as well.
To construct a Share Price model let us express Dividends from D.E. Walter model (formula 2) and present-day period Dividend from the economic growth model by M. Gordon (formula 3) as follows:
 (8)
(8)
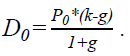 (9)
(9)
Then let us make Dividend from the D.E. Walter model (formula (8)) equal to the present-day period Dividend from the economic growth model by M. Gordon (formula (9)):
D = D0, (10)
entering a common symbol for a Share Price expected, i.e., balanced to a specific investor position as P (P = P0).
Thus, we get an equation:
 (11)
(11)
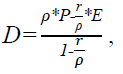
obtaining the expected Share Price model:
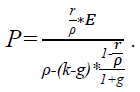 (12)
(12)
Under the formula (12) within the neutral dividend policy implementation conditions the expected Share Price is impacted by the following factors: the investment company profitability, market capitalization level, Dividend, Equity Profit required by investors and Dividend gain rate taken constant in time. The expected Share Price gain would be facilitated by the increase of the investment company profitability, Equity Profit required by investors, Dividend and slower Dividend gain rate and market capitalization level growth. Vice versa, the expected Share Price drop would result from the decline of the investment company profitability, Equity Profit required by investors and the rise of the Dividend gain rate and market capitalization level growth. The estimation of the defining factors impact on the outcome scores variances in the model (12) is exercised with relevant factoring analysis methods.
The expected Share Price model (formula 12) obtained by the author might be employed for the forecasting-analytical estimation of the company market performance and investment attractiveness ratios values within the neutral dividend policy implementation conditions. Other dividend policy scores analysis (e.g, Dividend Yield) and company market performance (e.g. Price / Earnings Ratio) might be estimated with the models as well.
Thus, within the neutral dividend policy implementation conditions and basing on the entered above conventional symbols the following Dividend Yield and Price / Earnings Ratio models might be formed:
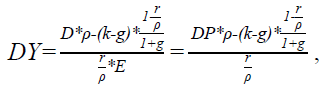 (13)
(13)
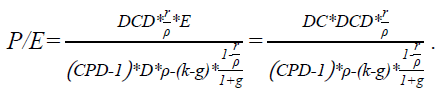 (14)
(14)
According to the formula (13) within the neutral dividend policy implementation conditions the Dividend Yield is defined by the following factors: the Dividend Payout (i.e., Dividend and Earnings per Share ratio), market capitalization level, Equity Profit required by investors and Dividend gain rate taken constant in time. The Dividend Yield gain is ensured by the increase of the Dividend Payout (i.e., Dividend and Earnings per Share ratio), market capitalization level, Dividend gain and the drop of the investment company profitability and Equity Profit required by investors. The Dividend Yield decline is caused by the fall of the Dividend Payout (i.e., Dividend and Earnings per Share ratio), market capitalization level, Dividend gain and the rise of the company investment profitability and Equity Profit required by investors. The estimation of the defining factors impact on the outcome scores variances in the model (13) is exercised with corresponding factoring analysis methods.
The Dividend Yield model (formula 13) formed by the author of the article might be applied for the forecasting-analytical ratios values estimation within the neutral dividend policy implementation conditions and some other company market performance scores (e.g., Share Value) estimated with the model as well.
Under to the formula (14) within the neutral dividend policy implementation conditions the Price / Earnings Ratio depends on such factors as Dividend Cover (i.e., Dividend and Earnings per Share ratio), Common/Preferred Dividend, investment company profitability, market capitalization level, Preferred Dividend Coverage, Equity Profit required by investors and Dividend gain rate taken constant in time. The Price / Earnings Ratio is encouraged by the increase of the Dividend Cover (i.e., Earnings per Share and Dividend ratio), Common /Preferred Dividend, the company investment profitability and Equity Profit required by investors and the decrease of the company market performance level, Preferred Dividend Coverage and Dividend gain rate. The Price / Earnings Ratio decline is driven by the fall of the Dividend Cover (i.e., Earnings per Share and Dividend ratio), Common/Preferred Dividend ratio, company investment profitability, Equity Profit required by investors and the growth of the market capitalization level, Preferred Dividend Coverage and Dividend gain rate. The estimation of the defining factors impact on the outcome scores variances in the model (14) is exercised with the relevant factoring analysis methods.
The Price / Earnings Ratio model (formula 14) under the author of the paper might be employed for the forecasting-analytical ratio values estimation characterizing the company market performance within the neutral dividend policy implementation conditions depending in the key scores.
The forecast values of the company dividend policy and market performance scores obtained above with the formulae (6), (7), (12), (13) and (14) might be analyzed by specific stakeholders interested in the sustainable company development, the results presenting a forecasting evaluation of the dividend policy management efficiency level (Large, Significant, Essential, Fairly small).
A practical application example of the models (6), (7), (12), (13) and (14) developed by the author presents forecasting of the corresponding annual data of Gamma PLC within the neutral dividend policy implementation conditions, the company name having been changed.
Model (6). Gamma PLC last year end data are as follows: r=0.239, i.?. 23.9%; ρ 0.153 , i.?. 15.3%; k=0.12, i.?. 12%; g=0.05, i.?. 5%, then in the conditions DP=0,547, i.?. 54.7%. Hence within the neutral company dividend policy approach conditions at year end data the Dividend Payout is expedient to be set at the level of 54.7%. Today under Gamma PLC dividend policy its Dividend Payout equals 25%.
Model (7). The last year Gamma PLC bottom line data were measured as: r=0.239, i.?. 23.9%; ρ 0.153 , i.?. 15.3%; k=0.12, i.?. 12%; g=0.05, i.?. 5%, then in the conditions DC=1.829. The estimations show that within the neutral dividend policy approach conditions at year end company data the Dividend Cover is needed to be set at the level 1.829. Currently under Gamma PLC dividend policy its Dividend Cover equals 4.
Model (12). Under the last year end bottom line data Gamma PLC reported on the following: r=0.239, i.?. 23.9%; ρ 0.153, i.?. 15.3%; k=0.12, i.?. 12%; g=0.05, i.?. 5%; E=157.48 roubles then in the conditions P=1294.73 roubles. According to the estimation in the neutral dividend policy approach conditions the company has to reach the Share Price up to 1294.73 roubles. At present the Share Price of Gamma PLC equals around 1019-1039 ??????.
Model (13). Gamma PLC reported the following last year data: r=0,239, i.?. 23.9%; ρ 0.153, i.?. 15.3%; k=0.12, i.?. 12%; g=0.05, i.?. 5%; DP=0.547, then in the conditions DY=0.077, i.?. 7.7%.
The estimation clarifies that within the neutral dividend policy approach conditions under the year end figures the company is to attain the Dividend Yield at the level of 7.7%. Today the Dividend Yield for Gamma PLC measures 6.5%.
Model (14). Gamma PLC last year end data are as follows: r=0.239, i.?. 23.9%; ρ 0.153, i.?. 15.3%; k=0.12, i.?. 12%; g=0.05, i.?. 5%; DC=1.829, DCD=23, CPD=60, then in the conditions P/E=7.250. According to the estimation in the neutral dividend policy approach conditions the company has to reach the Price / Earnings Ratio at the level of 7.250. The actual present figure of it by the year end data equals 6.3.
Thus the neutral dividend policy approach discussed above as a practical application example in Gamma PLC presumes that the company exercises certain score value changes and market performance ones derived (stock market position) as well; the author believes the move is certain to improve Public Limited Company attractiveness for all stakeholders interested with a view to ensure its long-term sustainable development.
Let us compare the results of the author’s research obtained with those of the well-known scientists and specialists in the field discussed above in the sections: “Previous Research” and “Methodology of Research”, concerning formalized models application for dividend policy forecasting anal analysis as a whole and within active and passive implementation approach.
The comparison has stated the following:
a. The neutral dividend policy implementation approach proposed by the author is distinct from the dividend irrelevance theory and dividend policy significance theory enabling in a much greater extent consider all company stakeholders’ interests ensuring thereby its sustainable development in the long run;
b. the formalized (mathematical) models of the most significant dividend policy scores and those of the company marketing performance derived developed within the neutral dividend policy approach are more detailed and representative since they reflect the scores dependence upon a greater number of the defining factors compared with the existing models;
c. the most significant dividend policy scores and those of the company marketing performance derived available in the author’s models as well as a greater number of the defining factors permit to carry out a more detailed factoring analysis of the scores by the relevant methods and their forecasting basing on the anticipated defining factor values, the whole of these improving a decision making process in the field of the company dividend policy management.
Meanwhile the proposed by the author formalized models of the most significant dividend policy scores and those of the company marketing performance derived aimed at the permanent Dividend gain and high stock market efficiency bear certain restrictions. The restrictions to be overcome imply a problem for future research.
Conclusion
Having completed the treatment of the formalized models to analyze and forecast the dividend policy scores and company marketing performance scores derived within neutral approach conditions of the company dividend policy implementation having been developed by the author the following conclusions are drawn:
a. The neutral approach conditions of the company dividend policy implementation enables taking into account all company stakeholders’ interest ensuring its sustainable development in the long run;
b. The methodology of the neutral dividend policy implementation approach research is based on the concepts of the Dividend Irrelevance theory, Dividend Policy Significance theory and Sustainable company development concept;
c. The formalized statement of the neutral approach conditions of the dividend policy implementation implies the corresponding formalized models construction of the most significant dividend policy scores and company marketing performance scores derived: Dividend Payout, Dividend Cover, expected Share Price, Dividend Yield and Price / Earnings Ratio;
d. The formalized models of the most significant dividend policy scores and company marketing performance scores derived developed within the neutral dividend policy implementation approach reflect the score dependence upon a great number of the defining factors;
e. The factoring analysis execution of the most significant dividend policy scores and company marketing performance scores derived by corresponding methods due to the formalized models principles permits finding out the basic reasons of their changes within the neutral dividend policy implementation approach;
f. The formalized models of the most significant dividend policy scores and company marketing performance scores derived might be applied for their forecasting proceeding from the anticipated defining factors value that allows to improve and streamline the proactive management decisions making within the neutral dividend policy implementation approach.
References
- Akhigbe, A., & Madura, J. (1996). Dividend policy and corporate performance. Journal of Business Finance and Accounting, 23, 1267-1289.
- Black, F. (1976). The dividend puzzle. Journal of Portfolio Management, 2(2), 5-8.
- Block, S.B., Hirt, G.A., & Danielsen, B. (2011). Foundations of financial management. New York: McGraw-Hill Education.
- Brealey, R.A., Mayers, S.C., & Allien, F. (2017). Principles of corporate finance. New York: McGraw-Hill Education.
- Brigham, E.F., & Houston, J.F. (2015). Fundamentals of financial management: Concise. Boston: Cengage Learning.
- Brooks, R.M. (1996). Changes in asymmetric information at earnings and dividend announcements. Journal of Business Finance & Accounting, 23(3), 359-370.
- Dunphy, D.D., Griffiths, A., & Suzanne, B. (2007). Organizational change for corporate sustainability: A guide for leaders and change agents of the future. London: Rountledge.
- Fama, E.F., & French, K.R. (1989). Business conditions and expected returns on stocks and bonds. Journal of Financial Economics, 25, 23-49.
- Freeman, R.E. (2010). Strategic management: A stakeholder approach. New York: Cambridge University Press.
- Friedman, R.E., & Miles, S. (2006). Stakeholders: Theory and practice. New York: Oxford University Press.
- Goetzmann, W.N., & Jorion, P. (1995). A longer look at dividend yields. Journal of Business, 68(4), 483-508.
- Gordon, M.J. (1959). Dividends, earnings and stock prices. The Review of Economics and Statistics, 41(2),99-105.
- Gordon, M.J. (1963). Optimal investment and financial policy. Journal of Finance, 18(2), 264-272.
- Helfert, E.A. (2001). Financial analysis: Tools and techniques. A guide for managers. New York: McGraw-Hill.
- Higgins, R.C., Koski, J., & Mitton, T. (2016). Analysis for financial management. New York: McGraw-Hill Education.
- Lambrecht, B.M., & Myers, S.C. (2012). A Lintner model of payout and managerial rents. Journal of Finance, 67, 1761-1810.
- Lintner, J. (1962). Dividend, earnings, leverage, stock prices and the supply of capital to corporations. The Review of Economics and Statistics, 44(3),243-269.
- Miller, M.H., & Modiliani, F. (1961). Dividend policy, growth and the valuation of share. Journal of Business, 34(4),411-433.
- Petit, R.R. (1972). Dividend announcement, security performance and capital market efficiency. Journal of Finance, 27, 993-1007.
- Rozeff, M.S. (1982). Growth, beta, and agency cost as determinants of dividend payout ratios. Journal of Financial Research, 5(3), 461-488.
- Shim, J.K., & Siegel, J.G. (2008). Financial management. New York: Barron’s Educational Series, Inc.
- Van Horne, J.C. (1989). Fundamentals of financial management. Englewood Cliffs: Prentice-Hall.
- Walter, J.E. (1956). Dividend policies and common stock prices. Journal of Finance, 11(1),29-41.