Research Article: 2021 Vol: 25 Issue: 3
Do Female Directors Influence Future Stock Price Crash Risk? Firm-Level Evidence from Korea
Boyoung Moon, Dankook University
Soo Yeon Park, Chung-Ang University
Citation Information: Moon, B.M., & Park, S.Y. (2022). Do female directors influence future stock price crash risk? Firm-level evidence from korea. Academy of Accounting and Financial Studies Journal, 26(1), 1-13.
Abstract
This study examines whether female directors contribute to reducing firm-level future stock price crashes. A sample of Korean firms revealed that female directors mitigate the risk of future stock price crashes. This result was more pronounced in firms with high information asymmetry, and the findings are shown to be robust to endogeneity concerns. Accordingly, we find that female directors play an essential role in monitoring managerial private disclosure behavior, reducing future stock price crash risk.
Keywords
Female Directors, Stock Crash Risk, Monitoring, Information Asymmetry.
JEL Classifications
G30, G34, J16.
Introduction
A firm-level stock price crash refers to a phenomenon in which bad information accumulated inside a firm reaches a certain limit and leaks out at once, causing the stock price to collapse (Jin & Myers, 2006; Hutton et al., 2009; Callen & Fang, 2013; Kim & Zhang, 2016; Andreou et al., 2016). Managers have an information advantage over external stakeholders due to the separation of ownership and management and can use strategic disclosure forms based on the superiority of information when information asymmetry with external stakeholders is substantial (Jensen & Meckling, 1976). In particular, managers are known to postpone the disclosure of bad news, fearing of reduced compensation or dismissal due to bad news; or delay the disclosure of bad news, believing that the company's financial condition will improve (Graham et al., 2005; He, 2015; Kim et al., 2011a; Kim et al., 2014; Kothari et al., 2009). The crash of firm-level stock prices can inflict huge losses on investors who have invested in the firm and impair the capital market’s efficiency.
According to previous studies on stock price crashes related to firm characteristics, the lower the quality of financial reporting, the lower the conservative accounting treatment, the comparability of accounting information, or the fewer corporate disclosures associated with greater stock price crash risk (Ertugrul et al., 2017; Hutton et al., 2009; Kim & Zhang, 2016; Kim et al., 2011b; Francis et al., 2016). In an environment where information asymmetry is relatively significant, if negative news is accumulated within the firm due to managerial incentives, such as stock options or overconfidence, the risk for future stock price crashes will increase. However, it has been reported that external or internal governance contributes to reducing the firm-level stock price crash. High-quality external auditors, institutional investors, and financial analysts monitor firms externally and reduce stock price crash risk (Callen & Fang, 2013; Robin & Zhang, 2014). In addition, Chen et al. (2017a) found that high-quality internal control mitigates the risk of stock price crashes.
This study focuses on whether female directors, known to enhance firm value, play a role in reducing the stock price crash risk. Gender diversity studies report that women have different values, perceptions, preferences, and attitudes than men (Barber & Odean, 2001;Croson & Gneezy, 2009). Previous studies on gender differences decision-making processes within firms reported that females are more conservative and less overconfident than males (Olsen & Cox 2001; Schubert, 2006; Sunden & Surette, 1998). Also, female directors are known to be more independent and compliant with regulations. Heminway (2007) posits that the possibility of arbitrarily adjusting corporate financial disclosures is low because female directors have high reliability standards. Barber & Odean (2001) argue that female directors tend to make independent decisions from a long-term perspective and ultimately enhance firm value through monitoring managers. The female directors’ role as monitoring managers is expected to suppress bad-news-hoarding activities caused by managers' personal incentives or overconfidence. Further, this study examines the effect of information asymmetry on the relationship between female directors and future stock price crash risk. If information asymmetry is very low, it will be challenging for managers to make strategic disclosures; thus, there would not be much room for female directors to monitor managers’ disclosure behavior. Conversely, if information asymmetry is inherently high, the role of female directors in curbing the bad-news-hoarding activities of managers will be significant. To test this, we divide our sample into firms audited by Big 4 auditors and those audited by non-Big 4 auditors. Robin & Zhang (2014) found that if the audit quality is high, information asymmetry is lowered, and the future stock price crash risk is reduced. Big 4 auditors are generally considered as providing higher audit quality (Becker et al., 1998; Francis et al., 1999; Francis & Krishnan, 1999). If the role of female directors in monitoring managers’ disclosure behavior is prominent in a situation where the level of information asymmetry is high, the degree of reduction in the stock price crash risk is expected to be stronger in the Non-Big 4 auditors.
Evidence from a sample of Korean public firms for the years 2014–2019 revealed that female directors are significantly negatively associated with future stock price crash risk. This implies that the role of female directors in monitoring managerial bad-news-hoarding activities eventually mitigates a firm’s future stock crash risk. In addition, the role of female directors in reducing future stock price crashes was significant in the group of firms audited by non-Big 4 auditors, implying that the monitoring role of female directors is more pronounced in firms with high information asymmetry.
This study contributes to the literature in several ways. First, this is the first study to assess the relationship between female directors and firm-level stock price crash risk. Although the interest in securing gender equality opportunities is high around the world, the rate of women's participation in management is still too low. This study has produced useful evidence to understand the role of female directors in affecting managerial behavior and overall shareholder welfare. Second, this study extended research on the bad-news-hoarding theory of stock price crash risk. Recent studies on stock crash risk have reported that bad-news-hoarding activities are mitigated mainly by external governance factors. This study fills a void in the literature by providing empirical evidence that female directors act internal monitoring mechanisms, reducing future stock crash risk. Third, this study’s results provide policy implications on the need for gender equality workforce policy in Korea and similar Asian countries, where the power of women in the workforce is still undervalued due to deeply rooted Confucian ideology.
The paper proceeds as follows: Section 2 describes sample data and empirical methodology. Section 3 presents the main empirical tests, and Section 4 concludes.
Empirical Methodology
The Sample
This study is based on a sample of firms’ data listed on the Korea Composite Stock Price Index (KOSPI) from 2014 to 2019. We extract accounting from the FnGuide database and female director’s data and stock return data. In November 2013, the Financial Supervisory Service of Korea added the obligation to disclose gender information in the executive status table to increase the proportion of female executives. Accordingly, this study’s sampling period starts from 2014. Additionally, financial institutions and firms with non-December 31 fiscal year-end dates were excluded to improve the comparability of samples. The final samples with all the financial statement data required to compute the main variables consist of 6,852 firm-year observations from 2014 to 2019.
Stock crash risk measure
Following prior literature (Hutton et al., 2009), the following two firm-specific measures of stock price crash risk were constructed for each firm-year observation: (1) CRASH; (2) the negative coefficient of skewness of firm-specific weekly returns (NCSKEW). Firm-specific weekly returns from the following market model regression are first estimated to calculate firm-specific measures of stock price crash risk:
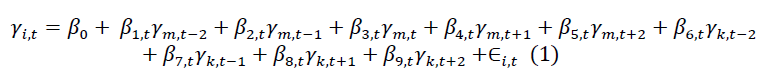
where γi,t is the return on stock i in week t, γm,t is the KOSPI value-weighted market index in week t, and γk,t is the return on the value-weighted industry index based on two-digit SIC codes. The firm-specific weekly return for firm i in week t (Wi,t )is defined as the natural log of one plus the residual return from Eq. (1). Stock crash weeks in a given fiscal year for a given firm are defined as those weeks during which the firm experiences firm-specific weekly returns 3.09 standard deviations below the mean firm-specific weekly returns over the entire fiscal year. The firm-specific measure of likely stock price crash risk, denoted by CRASH, is an indicator variable, equaling one for a firm-year that experiences one or more crash weeks during the fiscal-year period, and zero otherwise.

where Wi,t is the firm-specific weekly return as defined above, and n is the observation numbers of firm-specific returns during the fiscal year t. A negative sign is placed before the third moment such that a larger value of NCSKEW t+1 signifies greater crash risk.
Empirical Models
The following regression model is estimated to investigate how female directors in the boardroom are associated with firm-specific future stock price crash risk:
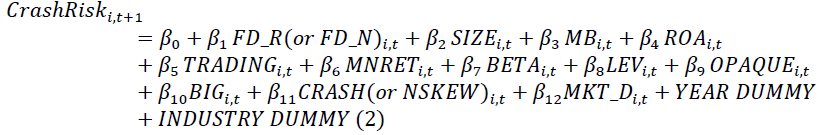
where
 = 1 if a firm experiences one or more crash events in year t+1, and zero otherwise;
NSKEWt+1= negative skewness coefficient of firm-specific weekly return over the fiscal year;
FemaleDirector
FD_R t the ratio of female directors on the board
FR_N t the number of female directors on the board
SIZEt=the logarithm of total assets value of a firm in year t
MBt= market value divided by total equity in year t
ROAt= operating income divided by total asset in year t
TRADINGt= increment in monthly turnover rate year on year in year t
MNRET t= arithmetic average of firm specific weekly returns in year t
BETAt= beta index of market model during the previous 60 months
LEVt= firm leverage measures as the ratio of total liabilities to total asset in year t
OPAQUE t= 3 year moving sum of the absolute value of annual performance adjusted discretionary accruals in year t
BIG t = 1 if auditing is done by one of the Big 4 accounting firms, and 0 otherwise;
MKT_Dt = 1 if the firm is listed in the KOSPI stock market, and 0 if the firm is listed in the KOSDAQ stock market;
Empirical Results
Descriptive Statistics
Table 1 presents descriptive statistics for the variables used in the study’s main regression models. The mean values of future crash risk measures, CRASH t+1 and NSKEW t+1, are0.113 and -0.366, respectively. The mean of CRASH t+1suggests that 11.3% of firms experienced at least one stock crash event during the given years. The mean and standard deviation of NSKEW t+1are similar to the estimates by Park and Park (2019). The mean of FD_Rt is 0.034, indicating that the percentage of female executives on the board of directors is 3.4%. Further, the mean of FD_Nt is 0.204, indicating that the number of female executives is 0.2.
| Table 1 Descriptive Statistics (N=6,852) |
|||||||
|---|---|---|---|---|---|---|---|
| Variable | Mean | Std. Dev. | Min | 25% | Median | 75% | Max |
| CRASH t+1 | 0.113 | 0.316 | 0.000 | 0.000 | 0.000 | 0.000 | 1.000 |
| NSKEW t+1 | -0.366 | 0.704 | -2.747 | -0.748 | -0.322 | 0.043 | 2.171 |
| FD_Rt | 0.034 | 0.081 | 0.000 | 0.000 | 0.000 | 0.000 | 0.400 |
| FD_N t | 0.204 | 0.482 | 0.000 | 0.000 | 0.000 | 0.000 | 3.000 |
| SIZE | 19.572 | 1.508 | 16.846 | 18.499 | 19.249 | 20.368 | 24.521 |
| MB | 1.691 | 1.650 | 0.227 | 0.729 | 1.158 | 1.964 | 11.859 |
| ROA t | 0.006 | 0.097 | -0.519 | -0.012 | 0.021 | 0.054 | 0.226 |
| TRADINGt | -0.001 | 0.020 | -0.112 | -0.004 | 0.000 | 0.003 | 0.100 |
| MNRETt | 0.016 | 0.002 | 0.013 | 0.015 | 0.015 | 0.017 | 0.020 |
| BETAt | 0.869 | 0.410 | -0.148 | 0.581 | 0.858 | 1.143 | 1.936 |
| LEV t | 0.443 | 0.202 | 0.056 | 0.280 | 0.450 | 0.597 | 0.929 |
| OPAQUEt | 0.134 | 0.106 | -0.416 | 0.066 | 0.110 | 0.174 | 0.770 |
| BIG t | 0.507 | 0.500 | 0.000 | 0.000 | 1.000 | 1.000 | 1.000 |
CRASH t+1 is 1 if a firm experiences one or more crash events in year t+1, and zero otherwise; NSKEW t+1 is negative skewness coefficient of firm-specific weekly return over the fiscal year; FD_R t is the ratio of female directors on the board; FR_N t is the number of female directors on the board; SIZE t is the logarithm of total assets value of a firm in year t; MB t is market value divided by total equity in year t; ROA t is operating income divided by total asset in year t; TRADING t is increment in monthly turnover rate year on year in year t; MNRET t is arithmetic average of firm-specific weekly returns in year t; BETA t is beta index of market model during the previous 60 months; LEV t is firm leverage measures as the ratio of total liabilities to total asset in year t; OPAQUE t is 3-year moving sum of the absolute value of annual performance-adjusted discretionary accruals in year t; BIG t is 1 if auditing is done by one of the Big 4 accounting firms, and 0 otherwise; MKT_Dt is 1 if the firm is listed in the KOSPI stock market, and 0 if the firm is listed in the KOSDAQ stock market.
Table 2 presents the Pearson correlation for the variables used in the study’s main regression models. The future stock price crash risk dependent variables, CRASH t+1 and NSKEW t+1, are significantly correlated at a 1% significant level, suggesting that they contain much the same information. FD_R t is negatively correlated with the future crash risk (CRASH t+1 and NSKEW t+1) at the 10% and 1% significant levels, respectively, implying that a higher proportion of female board directors could mitigate subsequent stock crash risk in the full sample. Also, FD_N t is significantly negatively correlated with NSKEW t+1,implying that themore female directors on the board, the lower the firm’s stock crash risk.In addition, the results of the analysis on variance inflation factors suggest that multicollinearity is not a concern.
| Table 2 Pearson Correlation Between Variables Of Interest (N=6,852) |
||||||||||||
|---|---|---|---|---|---|---|---|---|---|---|---|---|
| Variable | (2) | (3) | (4) | (5) | (6) | (7) | (8) | (9) | (10) | (11) | (12) | (13) |
| (1) CRASH t+1 | 0.493 | -0.022 | -0.018 | -0.001 | -0.017 | -0.073 | -0.030 | -0.029 | -0.039 | 0.018 | 0.028 | 0.004 |
| (<.0001) | (0.066) | (0.145) | (0.925) | (0.167) | (<.0001) | (0.014) | (0.016) | (0.001) | (0.130) | (0.019) | (0.719) | |
| (2) NSKEW t+1 | -0.040 | -0.031 | 0.169 | -0.038 | 0.008 | -0.123 | -0.035 | -0.070 | 0.001 | -0.017 | 0.100 | |
| (0.001) | (0.011) | (<.0001) | (0.002) | (0.504) | (<.0001) | (0.004) | (<.0001) | (0.903) | (0.162) | (<.0001) | ||
| (3) FD_Rt | 0.952 | -0.112 | 0.060 | -0.043 | -0.008 | -0.030 | 0.013 | -0.085 | 0.016 | -0.085 | ||
| (<.0001) | (<.0001) | (<.0001) | (0.000) | (0.487) | (0.013) | (0.291) | (<.0001) | (0.178) | (<.0001) | |||
| (4) FD_N t | -0.083 | 0.065 | -0.054 | -0.004 | -0.028 | 0.011 | -0.073 | 0.021 | -0.083 | |||
| (<.0001) | (<.0001) | (<.0001) | (0.762) | (0.020) | (0.369) | (<.0001) | (0.080) | (<.0001) | ||||
| (5) SIZEt | -0.191 | 0.229 | 0.012 | -0.024 | 0.021 | 0.270 | -0.181 | 0.445 | ||||
| (<.0001) | (<.0001) | (0.336) | (0.044) | (0.089) | (<.0001) | (<.0001) | (<.0001) | |||||
| (6) MBt | -0.145 | 0.032 | 0.033 | 0.213 | 0.004 | 0.176 | -0.049 | |||||
| (<.0001) | (0.007) | (0.006) | (<.0001) | (0.754) | (<.0001) | (<.0001) | ||||||
| (7) ROA t | 0.008 | 0.036 | -0.066 | -0.271 | -0.056 | 0.116 | ||||||
| (0.533) | (0.003) | (<.0001) | (<.0001) | (<.0001) | (<.0001) | |||||||
| (8) TRADING t | 0.082 | -0.001 | 0.016 | -0.033 | 0.002 | |||||||
| (<.0001) | (0.961) | (0.174) | (0.006) | (0.868) | ||||||||
| (9) MNRETt | 0.139 | 0.016 | -0.046 | 0.046 | ||||||||
| (<.0001) | (0.184) | (0.000) | (0.000) | |||||||||
| (10) BETA t | 0.073 | 0.114 | -0.025 | |||||||||
| (<.0001) | (<.0001) | (0.042) | ||||||||||
| (11) LEV t | -0.011 | 0.089 | ||||||||||
| (0.379) | (<.0001) | |||||||||||
| (12) OPAQUE t | -0.093 | |||||||||||
| (<.0001) | ||||||||||||
| (13) BIG t | 1.000 | |||||||||||
Refer to Table 1 for variable definition. P-values are parentheses.
Multivariate Analysis
Table 3 presents the results of the regression analysis on the effect of female directors on future price crash risk. Column 1 of Panel A shows the results of the logistic regression of the CRASH t+1on FD_Rt and various risk proxies. The coefficient of FD_Rt is -0.951, which is negatively significant at the 10% level, suggesting that increased female directors on the board lower the probability of a subsequent stock price crash risk. Column 2 presents the result from the regression of the NSKEW t+1 on FD_Rt. The coefficient of FD_Rt is -0.202, which is negatively significant at the 5% level. The finding supports that the higher the ratio of female directors on the boardroom, the lower the future stock price crash risk. Panel B shows that the coefficient of FD_Nt is significantly negatively associated with the CRASH t+1 and NSKEW t+1 at the 1% level. The result implies that the greater the number of female directors on the board, the lower the future stock price crash risk. The finding in Table 3 implies that female directors play the role of a monitoring manager, thereby curbing managerial bad-news-hoarding activities.
| Table 3 Effect Of Female Directors On Future Stock Price Crash Risk Using Crash T+1 And Nskew T+1 As The Dependent Variables (N=6,852) |
||||||
|---|---|---|---|---|---|---|
| Panel A: FD_R | ||||||
| Variable | (1)CRASH t+1 | (2)NSKEW t+1 | ||||
| Estimate | Wald χ2value | Estimate | t-value | |||
| Intercept | 0.145 | 0.003 | -1.951 | -3.19 | *** | |
| FD_R t | -0.951 | 3.362 | * | -0.202 | -1.97 | ** |
| SIZE t | 0.025 | 0.473 | 0.091 | 11.57 | *** | |
| MB t | -0.047 | 3.044 | * | -0.001 | -0.17 | |
| ROA t | -2.328 | 34.821 | *** | -0.409 | -4.31 | *** |
| TRADING t | -4.065 | 4.457 | ** | -4.212 | -10.17 | *** |
| MNRETt | -195.700 | 1.204 | 12.024 | 0.32 | ||
| BETAt | -0.309 | 9.072 | *** | -0.102 | -4.72 | *** |
| LEV t | 0.015 | 0.005 | -0.227 | -4.84 | *** | |
| OPAQUE t | 0.850 | 5.155 | ** | 0.206 | 2.43 | ** |
| BIG4 t | 0.015 | 0.029 | 0.025 | 1.36 | ||
| CRASHt | 0.117 | 0.918 | ||||
| NSKEW t | 0.032 | 2.77 | *** | |||
| MKT_D t | 0.155 | 2.616 | -0.004 | -0.18 | ||
| Industry Dummy | Included | |||||
| Year Dummy | Included | |||||
| Likelihood Ratio χ2 Adjusted R2 |
98.603*** | 0.061 | ||||
| Table 3 Effect Of Female Directors On Future Stock Price Crash Risk Using Crash T+1And Nskew T+1 As The Dependent Variables (N=6,852) |
||||||
|---|---|---|---|---|---|---|
| Panel B: FD_N | ||||||
| Variable | CRASH t+1 | NSKEW t+1 | ||||
| Estimate | Wald χ2value | Estimate | t-value | |||
| Intercept | 0.061 | 0.000 | -1.968 | -3.22 | *** | |
| FD_N t | -0.142 | 2.720 | * | -0.033 | -1.93 | * |
| SIZEt | 0.027 | 0.547 | 0.091 | 11.63 | *** | |
| MB t | -0.047 | 3.059 | * | -0.001 | -0.16 | |
| ROA t | -2.337 | 35.075 | *** | -0.412 | -4.34 | *** |
| TRADING t | -4.042 | 4.406 | ** | -4.208 | -10.16 | *** |
| MNRET t | -193.000 | 1.171 | 12.597 | 0.33 | ||
| BETA t | -0.309 | 9.099 | *** | -0.103 | -4.73 | *** |
| LEV t | 0.017 | 0.006 | -0.227 | -4.84 | *** | |
| OPAQUEt | 0.858 | 5.257 | ** | 0.207 | 2.45 | ** |
| BIG4 t | 0.016 | 0.033 | 0.026 | 1.36 | ||
| CRASH t | 0.117 | 0.919 | ||||
| NSKEWt | 0.032 | 2.78 | *** | |||
| MKT_Dt | 0.155 | 2.606 | -0.004 | -0.19 | ||
| Industry Dummy | Included | |||||
| Year Dummy | Included | |||||
| Likelihood Ratio χ2 Adjusted R2 |
97.915*** | 0.062 | ||||
*/**/***denote significance at the 10%, 5%, and 1% levels, respectively. Refer to Table 1 for the variable definitions.
Additional Analyses
Table 4 presents the effect of information asymmetry on the relationship between female directors and future stock price crash risk. Panel A reports the effect of the ratio of female executives on the future stock crash risk from the sub-sample classified by whether a firm is audited by a Big 4 — a proxy for information asymmetry. In the sub-sample of firms audited by Big 4, the coefficient of FD_Rt does not have a statistically significant value. Conversely, in the sub-sample of firms audited by non-Big 4, FD_Rt shows a significantly negative relationship with the CRASH t+1 and NSKEW t+1 within 10% and 1%, respectively. Similarly, in Panel B, no significant relationship appears between FD_Nt and stock crash risk (CRASH t+1and NSKEW t+1) within the sub-sample of Big 4. However, in the sub-sample of non-Big 4, FD_Nt is significantly negatively associated with the CRASH t+1and NSKEW t+1 within 10% and 1%, respectively. These findings indicate that the monitoring role of female directors in mitigating future stock crash risk is strengthened in firms with high information asymmetry.
| Table 4 Sub-Sample Analysis By Audit Quality Of The Effect Of Female Directors On Future Stock Price Crash Risk, Using Crash T+1 And Nskew T+1 As The Dependent Variables |
||||||||||||
|---|---|---|---|---|---|---|---|---|---|---|---|---|
| Panel A: FD_R | ||||||||||||
| Variable | BIG4=1 | BIG4=0 | ||||||||||
| CRASH t+1 | NSKEW t+1 | CRASH t+1 | NSKEW t+1 | |||||||||
| Estimate | Wald χ2value | Estimate | t-value | Estimate | Wald χ2value |
stimate | t-value | |||||
| Intercept | 2.589 | 0.411 | -1.967 | -7.48 | *** | -11.059 | 0.003 | -0.900 | -1.43 | |||
| FD_R t | -0.530 | 0.454 | 0.046 | 0.3 | -1.171 | 2.819 | * | -0.398 | -2.84 | *** | ||
| SIZEt | 0.054 | 1.508 | 0.092 | 10.05 | *** | -0.016 | 0.046 | 0.071 | 4.33 | *** | ||
| MBt | -0.055 | 1.781 | 0.001 | 0.09 | -0.052 | 1.929 | -0.001 | -0.11 | ||||
| ROAt | -1.638 | 5.708 | ** | -0.129 | -0.86 | -2.582 | 25.275 | *** | -0.494 | -3.84 | *** | |
| TRADING t | -5.017 | 1.808 | -5.327 | -7.07 | *** | -3.487 | 2.394 | -3.921 | -7.72 | *** | ||
| MNRET t | -376.400 | 2.169 | 12.468 | 1.3 | 16.360 | 0.004 | -23.244 | -2.09 | ** | |||
| BETA t | -0.476 | 10.582 | *** | -0.103 | -3.57 | *** | -0.166 | 1.269 | -0.134 | -4.21 | *** | |
| LEVt | 0.122 | 0.154 | -0.157 | -2.42 | ** | -0.007 | 0.001 | -0.229 | -3.3 | *** | ||
| OPAQUE t | 1.411 | 5.972 | ** | 0.177 | 1.41 | 0.521 | 1.091 | 0.215 | 1.86 | * | ||
| CRASHt | -0.085 | 0.213 | 0.291 | 3.039 | * | |||||||
| NSKEW t | 0.013 | 0.81 | 0.051 | 3.12 | *** | |||||||
| MKT_Dt | 0.048 | 0.120 | -0.004 | -0.12 | 0.234 | 3.021 | * | 0.004 | 0.14 | |||
| Industry | Included | |||||||||||
| Year | Included | |||||||||||
| Likelihood Ratio χ2 Adjusted R2 |
45.027*** | 0.058 | 99.783*** | 0.048 | ||||||||
| N | 3,473 | 3,473 | 3,379 | 3,379 | ||||||||
| Table 4 Sub-Sample Analysis By Audit Quality Of The Effect Of Female Directors On Future Stock Price Crash Risk, Using Crash T+1 And Nskew T+1 As The Dependent Variables |
||||||||||||
|---|---|---|---|---|---|---|---|---|---|---|---|---|
| Panel B: FD_N | ||||||||||||
| Variable | BIG4=1 | BIG4=0 | ||||||||||
| CRASH t+1 | NSKEW t+1 | CRASH t+1 | NSKEW t+1 | |||||||||
| Estimate | Wald χ2value | Estimate | t-value | Estimate | Wald χ2value |
Estimate | t-value | |||||
| Intercept | 2.526 | 0.392 | -1.965 | -7.49 | *** | -11.160 | 0.003 | -0.919 | -1.46 | |||
| FD_N t | -0.051 | 0.165 | 0.007 | 0.30 | -0.206 | 2.961 | * | -0.071 | -2.89 | *** | ||
| SIZE t | 0.055 | 1.568 | 0.092 | 10.05 | *** | -0.014 | 0.035 | 0.072 | 4.40 | *** | ||
| MB t | -0.056 | 1.833 | 0.001 | 0.09 | -0.052 | 1.925 | -0.001 | -0.09 | ||||
| ROAt | -1.635 | 5.687 | ** | -0.129 | -0.86 | -2.604 | 25.691 | *** | -0.504 | -3.91 | *** | |
| TRADING t | -4.999 | 1.796 | -5.328 | -7.08 | *** | -3.453 | 2.345 | -3.914 | -7.71 | *** | ||
| MNRETt | -374.300 | 2.145 | 12.452 | 1.30 | 20.982 | 0.007 | -22.988 | -2.07 | ** | |||
| BETA t | -0.476 | 10.564 | *** | -0.103 | -3.56 | *** | -0.166 | 1.278 | -0.134 | -4.23 | *** | |
| LEV t | 0.126 | 0.164 | -0.157 | -2.42 | -0.006 | 0.000 | -0.230 | -3.30 | *** | |||
| OPAQUE t | 1.416 | 6.024 | ** | 0.176 | 1.41 | 0.533 | 1.144 | 0.219 | 1.89 | * | ||
| CRASH t | -0.086 | 0.217 | 0.291 | 3.051 | * | |||||||
| NSKEWt | 0.013 | 0.81 | 0.051 | 3.15 | *** | |||||||
| MKT_D t | 0.048 | 0.118 | -0.004 | -0.12 | 0.232 | .963 | * | 0.003 | 0.10 | |||
| Industry | Included | |||||||||||
| Year | Included | |||||||||||
| Likelihood Ratio χ2 Adjusted R2 |
44.728*** | 0.058 | 99.934*** | 0.048 | ||||||||
| N | 3,473 | 3,379 | ||||||||||
Robustness Checks
The regression could possibly be subject to potential simultaneity bias. Heckman’s (1979) two-stage procedure is applied to address the potential endogeneity problem, the results of which are presented in Table 5. Consistent with the preliminary results, the coefficient of the fitted values of FD_Rt and FD_Ntis significantly negatively associated with the CRASH t+1and NSKEW t+1. The result confirms that the study’s empirical results are robust regarding endogeneity concerns.
| Table 5 Robustness Test: 2sls Regression, Using Crash T+1 And Nskew T+1 As The Dependent Variables (N=6,852) |
|||||||||
|---|---|---|---|---|---|---|---|---|---|
| Panel A: FD_R | |||||||||
| Variable | 1st stage | CRASH t+1 | NSKEW t+1 | ||||||
| 2nd stage | 2nd stage | ||||||||
| Estimate | t-value | Estimate | Wald χ2value | Estimate | t-value | ||||
| Intercept | 0.129 | 3.45 | *** | 2.621 | 0.674 | -1.269 | -4.66 | *** | |
| FE_FULLt | 0.012 | 6.09 | *** | ||||||
| PREDFDR | -15.826 | 4.044 | * | -3.392 | -2.56 | ** | |||
| SIZE t | -0.002 | -2.52 | ** | -0.010 | 0.056 | 0.082 | 9.88 | *** | |
| MB t | 0.002 | 2.57 | ** | -0.017 | 0.288 | 0.007 | 1.11 | ||
| ROA t | -0.030 | -2.66 | *** | -2.811 | 36.858 | *** | -0.499 | -4.76 | *** |
| TRADINGt | -0.033 | -0.67 | -4.743 | 5.924 | ** | -4.438 | -10.66 | *** | |
| MNRETt | 320.614 | 1.1 | -262.100 | 2.066 | -8.434 | -1.12 | |||
| BETA t | 0.002 | 0.81 | -0.283 | 7.445 | *** | -0.109 | -5.00 | *** | |
| LEV t | -0.027 | -5.02 | *** | -0.422 | 1.828 | * | -0.310 | -5.06 | *** |
| OPAQUE t | -0.013 | -1.32 | 0.663 | 2.906 | * | 0.157 | 1.81 | * | |
| BIG4t | -0.006 | -2.93 | *** | -0.080 | 0.613 | 0.008 | 0.38 | ||
| CRASHt | 0.112 | 0.843 | |||||||
| NSKEWt | 0.035 | 3.02 | *** | ||||||
| MKT_D t | -0.006 | -2.58 | *** | 0.061 | 0.324 | -0.021 | -0.94 | ||
| Industry Dummy | Included | 3.057 | |||||||
| Year Dummy | Included | ||||||||
| Likelihood Ratio χ2 Adjusted R2 |
0.023 | 99.438*** | 0.060 | ||||||
| Table 5 Robustness Test: 2sls Regression, Using Crash T+1 And Nskew T+1 As The Dependent Variables (N=6,852) |
|||||||||
|---|---|---|---|---|---|---|---|---|---|
| Panel B: FD_N | |||||||||
| Variable | 1st stage | CRASH t+1 | NSKEW t+1 | ||||||
| 2nd stage | 2nd stage | ||||||||
| Estimate | t-value | Estimate | Wald χ2value | Estimate | t-value | ||||
| Intercept | 0.503 | 1.26 | 1.155 | 0.153 | -1.490 | -6.13 | *** | ||
| FE_FULLt | 0.080 | 7.21 | *** | ||||||
| PREDFDN | -2.322 | 4.044 | ** | -0.403 | -1.91 | * | |||
| SIZE t | -0.002 | -0.30 | 0.023 | 0.399 | 0.088 | 11.30 | *** | ||
| MB t | 0.011 | 3.09 | *** | -0.016 | 0.271 | 0.006 | 0.91 | ||
| ROAt | -0.262 | -4.10 | *** | -2.951 | 34.396 | *** | -0.500 | -4.45 | *** |
| TRADING t | 0.010 | 0.04 | -4.203 | 4.747 | ** | -4.337 | -10.45 | *** | |
| MNRET t | -13.084 | -0.51 | -216.000 | 1.456 | -5.785 | -0.78 | |||
| BETAt | 0.008 | 0.55 | -0.297 | 8.314 | *** | -0.115 | -5.34 | *** | |
| LEV t | -0.167 | -5.40 | *** | -0.383 | 1.645 | -0.283 | -4.66 | *** | |
| OPAQUE t | -0.030 | -0.54 | 0.794 | 4.436 | ** | 0.187 | 2.19 | ** | |
| BIG4 t | -0.031 | -2.45 | ** | -0.050 | 0.274 | 0.018 | 0.92 | ||
| CRASH t | 0.121 | 0.977 | |||||||
| NSKEWt | 0.036 | 3.12 | *** | ||||||
| MKT_Dt | -0.043 | -3.09 | *** | 0.060 | 0.310 | -0.017 | -0.75 | ||
| Industry Dummy | Included | 3.057 | |||||||
| Year Dummy | Included | ||||||||
| Likelihood Ratio χ2 Adjusted R2 |
0.026 | 99.438*** | 0.060 | ||||||
*/**/***denote significance at the 10%, 5%, and 1% levels, respectively. Refer to Table 1 for the variable definitions.
Conclusions
Firm-level stock price crash undermines the credibility of corporate financial disclosure information. In severe cases, stock price crashes, such as Enron and Lehman, may shock capital markets. This study investigates whether female directors influence future stock price crashes. Our evidence suggests female directors play a monitoring role in reducing future stock price crash risk through pre-empting bad news hoarding activities by management. Our results also imply that such a role is more pronounced in firms with high information asymmetry. Considering the impact of gender staffing composition on the level of internal corporate governance mechanisms, investors may have a positive view on the quality of the information provided by firms with a high proportion of female board directors
Author Contributions
Conceptualization, methodology, data curation, and formal analysis, S.P.; writing— original draft preparation, review and editing, B.M.
Authorship
1st author: Boyoung Moon; Corresponding author: Soo Yeon Park.
References
- Andreou, P. C., Antoniou, C., Horton, J., & Louca, C. (2016). Corporate governance and firm-specific stock price crashes. European Financial Management, 22(5), 916-956.
- Barber, B. M., & Odean. T. (2001). Boys will be boys: Gender, overconfidence, and common stock investment. The Quarterly Journal of Economics, 116(1), 261-292.
- Becker, C.L., DeFond, M.L., Jiambalvo, J., & Subramanyam, K.R. (1998). The effect of audit quality on earnings management. Contemporary Accounting Research, 15(1), 1-24.
- Callen, J. L., & Fang, X. (2013). Institutional investor stability and crash risk: Monitoring versus short-termism? Journal of Banking & Finance, 37(8), 3047-3063.
- Chen, J., Chan, K. C., Dong, W., & Zhang, F. (2017a). Internal control and stock price crash risk: evidence from China. European Accounting Review, 26(1), 125-152.
- Croson, R., & Gneezy, U. (2009). Gender differences in preferences. Journal of Economic Literature, 47(2), 448-474.
- Ertugrul, M., Lei, J., Qiu, J., & Wan, C. (2017). Annual report readability, tone ambiguity, and the cost of borrowing. Journal of Financial and Quantitative Analysis, 52(2), 811-836.
- Francis, B., Hasan, I., & Li, L. (2016). Abnormal real operations, real earnings management, and subsequent crashes in stock prices. Review of Quantitative Finance and Accounting, 46(2), 217-260.
- Francis, J., & Krishnan, J. (1999). Accounting Accruals and Auditor Reporting Conservatism. Contemporary Accounting Research, 16(1), 135-165.
- Francis, J., Maydew, L.E., & Sparks, H.C. (1999). The Role of Big 6 Auditors in The Credible Reporting of Accruals. Auditing: A Journal of Practice & Theory, 18(2), 17-34.
- Graham, J. R., Harvey, C. R., & Rajgopal, S. (2005). The economic implications of corporate financial reporting. Journal of Accounting and Economics, 40(1-3), 3-73.
- He, G. (2015). The effect of CEO inside debt holdings on financial reporting quality. Review of Accounting Studies, 20(1), 501-536.
- Heckman, J. J. (1979). Sample selection bias as a specification error. Econometrica, 47(1), 153-161.
- Heminway, J. M. (2007). Sex, trust, and corporate boards. Hastings Women’s Law Journal, 18, 173-199.
- Hutton, A. P., Marcus, A. J., & Tehranian, H. (2009). Opaque financial reports, R2, and crash risk. Journal of Financial Economics, 94(1), 67-86.
- Jensen, M. C., & Meckling, W. H. (1976). Theory of the Firm: Managerial Behaviour, Agency Costs, and Ownership Structure. Journal of Financial Economics, 3(4), 305-360.
- Jin, L., & Myers, S. C. (2006). R2 around the world: New theory and new tests. Journal of Financial Economics, 79(2), 257-292.
- Kim, J. B., Li, Y., & Zhang, L. (2011a). CFOs versus CEOs: Equity incentives and crashes. Journal of Financial Economics, 101(3), 713-730.
- Kim, J. B., Li, Y., & Zhang, L. (2011b). Corporate tax avoidance and stock price crash risk: Firm-level analysis. Journal of Financial Economics, 100(3), 639-662.
- Kim, Y., Li, H., & Li, S. (2014). Corporate social responsibility and stock price crash risk. Journal of Banking and Finance, 43, 1–13.
- Kim, J. B., Wang, Z., & Zhang, L. (2016). CEO overconfidence and stock price crash risk. Contemporary Accounting Research, 33(4), 1720-1749.
- Kim, J. B., & Zhang, L. (2016). Accounting conservatism and stock price crash risk: Firm-level evidence. Contemporary Accounting Research, 33(1), 412-441.
- Kothari, S. P., Shu, S., & Wysocki, P. D. (2009). Do managers withhold bad news? Journal of Accounting Research, 47(1), 241-276.
- Olsen, R. A., & Cox, C.M. (2001). The influence of gender on the perception and response to investment risk: The case of professional investors. The Journal of Psychology and Financial Markets, 2(1), 29-36.
- Robin, A. J., & Zhang, H. (2014). Do industry-specialist auditors influence stock price crash risk? Auditing: A Journal of Practice & Theory, 34(3), 47-79.
- Schubert, R. (2006). Analyzing and managing risks on the importance of gender difference in risk attitudes. Managerial Finance, 32(9), 706-715.
- Sunden, A. E., & Surette, B. J. (1998). Gender differences in the allocation of assets in retirement savings plans. American Economic Review, 88(2), 207-211.