Research Article: 2019 Vol: 22 Issue: 3
Do Government Taxes Have Implications on Manufacturing Sector Output? Evidence from Nigeria
Olufemi Adebayo Oladipo, Landmark University
Odianonsen Francis Iyoha, Covenant University
Adeniran Samuel Fakile, Landmark University
Abiola John Asaleye, Landmark University
Damilola Felix Eluyela, Landmark University
Citation Information: Oladipo, O.A., Iyoha, O.F., Fakile, A.S., Asaleye, A.J., & Eluyela, D.F. (2019). Do government taxes have implications on manufacturing sector output? Evidence from Nigeria. Journal of Management Information and Decision Sciences, 22(3), 181-190.
Abstract
Background: The implications of taxes on output have generated different debates and controversial issues among scholars, most especially in developing economies.
Objectives: Hence, the short and long-run impact of taxes on output in the manufacturing sector is examined in Nigeria.
Method: To achieve these objectives, the study investigates the effects of company income and value-added taxes on the output of the manufacturing sector in Nigeria using AutoRegressive Distributed Lags.
Results: The long-run result revealed that there is a positive relationship between corporate taxes and the output of the manufacturing sector, while value-added tax reveals a negative relationship with the output. Evidence from the short-run result shows that company income tax is not statistically significant at the level of 5 per cent confirming the Ricardian Equivalence, although, the value-added tax is observed to be positively related to the output of the manufacturing sector.
Conclusion: The implications of the result revealed that fiscal measures via taxation and expenditure have not enhanced the productive capacity of the manufacturing sector in Nigeria.
Keywords
Tax; Output; Manufacturing Sector
Introduction
Increases in the growth rate of population and low standard of living have propelled government spending in developing economies over the years. However, the implications of taxes on output have generated different debates and controversial issues among scholars (Barro, 1974; Chen et al., 2017; Huang & Frentz, 2014; Moutford & Uhlig, 2009; Perott, 2005; Popoola et al., 2018). Although, tax proceeds are one of the vital instruments for economic improvement in many developing nations like Nigeria since the internally generated revenue through taxes assists the government in providing funds for the provision of infrastructures and social amenities (Akintoye & Tashie, 2013; Eluyela et al., 2018a). Abata (2014) opined that taxation encompasses the allocation of funds from the private sector to the community for the creation of social goods which will improve economic and social goals. Therefore, the tax revenue can be considered to be the utmost controlling charges accessible or reliable sources of revenue available to the government in order to stabilize and promote its economic and social improvement. In recent times, the Nigerian government has stressed the importance of investment on social goods to propel sustainable growth and development (Obadiaru et al., 2018; Popoola et al., 2018).
Nevertheless, questions have been raised on the short and long-run implications of taxes on growth and development. In the short-run, an increase in taxes on consumers might have negative effects on the economy by reducing disposable income and reduce the general welfare of the citizens. Though, in the long run, the effect could be beneficial if the credits on taxation are channeled for productive activities. Likewise, increase on the tax rate on the producer side tends to discourage investment in terms of capital accumulation and other assets needed to increase the capacity of the organization which may be detrimental to output in the long-run. This can be summarized under the concept “Ricardian Equivalence”. This concept suggest that a government cannot stimulate consumers spending since people assume that whatever is gained now will be offset by higher taxes in the future. This is noted in the work of Barro (1974) who stressed that tax changes will be insignificant to output. The underlying idea behind this theory is that no matter how a government chooses to increase spending, whether debt or tax financing, the outcome is the same and demand remains unchanged. Other empirical views in this line include the studies by Mountford & Uhlig (2009); Perotti (2005).
Income taxes are vital in revenue generation terms, but both personal and corporate income tax rates have decreased around the world most especially in developed economies. The macroeconomic performances in recent times have been a major concern for the Nigerian government and generating funds to meet the needs of the people in an economy characterized with high population growth, high dependency ratio and high importation of foreign goods and low output of manufacturing sector. In addition, the high unemployment rate, poverty rate and low income are as well some of the macroeconomics pertaining to Nigeria economy (Fashina et al., 2017; Oloni et al., 2017). Similarly, the performance of the manufacturing sector in the last decade has been subject to various debates among scholars and policymakers due to its ability to promote pro-poor growth (Asaleye et al., 2018; Asaleye et al., 2017; Eluyela et al., 2018b).
Moreover, the incessant decrease in the production output of manufacturing companies in Nigeria and the multiplicity of taxes by the government as means of generating revenue without equivalent improvement on the infrastructures in the country shift the attention of this study to investigate the implication of taxes on manufacturing output in Nigeria. Scholars have shown that tax has short-run and long-run effects on the economy (Abdullah & Morley, 2014; Chen et al., 2017; Huang & Frentz, 2014; King & Rebelo, 1990). Although, there are recent studies on the manufacturing sector in Nigeria. For instance, Adefeso (2018) examined the influence of corporate tax policy on the performance of 54 randomly selected listed companies between 1990-2002. The time series data gathered were analyzed using Generalized Method of Moment (GMM). The result from the study shows a positive significant relationship between corporate tax policy and the output performance of quoted manufacturing firms in Nigeria. The study recommended that federal government should either minimize or totally remove tax incentives, tax waivers and tax holidays to some manufacturing firms in Nigeria. Peter & Simen (2011) analyzed the impact of fiscal policy variables on Nigerian economic growth between 1970-2009. The method of analysis applied were Vector Autoregression (VAR) and Error Correction Model (ECM). The study concluded that a long run relationship exists between fiscal policy and economic growth in Nigeria. Subsequently, Tomola et al. (2012) also used Vector Autoregression (VAR) and co-integration to assess the long run relationship between economic growth and manufacturing sector in Nigeria. Their findings were consistent with Peter and Simen (2011). Lastly, Falade & Olagbaju (2015) employed time series data from 1973-2013 to examine the relationship between government expenditure and manufacturing sector output in Nigeria.
Using Johansen cointegration method, the study confirms the existence of cointegration amidst variables at 5%. However, most of these studies focused on monetary policy, credit channels and financial development (Asaleye et al., 2018; Asaleye et al., 2018; Uwuigbe et al., 2018).
The methodological gap identified in this study is the lack of empirical evidence regarding the short and long-run impacts of taxes in manufacturing sector in Nigeria using Auto- Regressive Distributed Lags. Motivated by this, this study, therefore, used Auto-Regressive Distributed Lags to examine the short and long-run impacts of taxes on Nigerian manufacturing output. This study contributed to finance and policy literature as follows: (1) provides the first empirical evidence on short and long-run impacts of taxes in Manufacturing sector in Nigeria using Auto-Regressive Distributed Lags, (2) it uses a novel dataset on impact of taxes on manufacturing sector in Nigeria.
Materials and Methods
This study predominantly used secondary data and the data were sourced from CBN Statistical Bulletin (2017) and Federal Inland Revenue Service, Nigeria from 2000Q1 to 2016Q4 (Eluyela et al., 2019). In analyzing the data gathered autoregressive distributed lag statistical technique was employed to establish the relationship between dependent and independent variables. The study made use of Hannan-Quinn to select the appropriate lags used in estimating the long run relationship between taxes and manufacturing output.
Following the study by Asaleye & Ogunjobi (2018) with a slight adjustment to achieve the objective of this study, the functional relationship between taxes and the manufacturing output is expressed as the dependent and independent variables in the regression analysis are expressed in their logarithms form as follows:
 (1)
(1)
In eqn. (1), POutput is output in the manufacturing sector, CIT is the company income tax, VAT is value added tax and MCAUT is manufacturing capacity utilization. Where ‘t’ is the period of observation, α0 is the constant term and ut is the error term. Applying logs to equation 3.1 becomes;
 (2)
(2)
In eqn. (2), mo is the log of output in the manufacturing sector and εt is ln (ut)
Prior to the estimation of the long-run and short-run behaviour using the Auto-regressive Distributed Lags (ARDL), the study examined the stationary properties of the series using the Augmented Dickey-Fuller (ADF) approach. The ADF equation is given as:
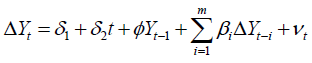 (3)
(3)
To determine the unit root property of the series involves estimating eqn. (3), where t, is the period of observation, Y is the time series under examination, δ1 and δ2 are the intercept and slope respectively, Φ is the drift parameter, Δ is the first difference operator and νt is the white noise error term. The error term is assumed to be uncorrelated and ADF follows an asymptotic distribution. The critical values are used to determine the level of the stationary process. The null hypothesis Φ is equal to zero, indicates that the time series under consideration is non-stationary and the alternative hypothesis if Φ is less than zero shows that the time series is stationary.
Based on the outcome of the unit root test, the study proceeds to estimate the long-run relationship using the ARDL which shows the short-run dynamic behaviour and the long-run equation. This approach to long-run relationship stressed that irrespective of whether the underlying series are integrated of order one I (1) or order zero I (0), the approach is the most suitable (Fashina et al., 1998). The ARDL equation is given as:
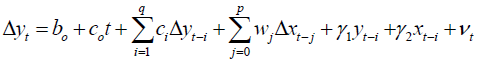 (4)
(4)
In eqn. (4), bo is the drift coefficient and co is the trend coefficient, while νt represents the white noise error term. The short-run coefficients are ci and wj while the long-run coefficients are γ1 and γ2.
Presentation of Data and Results
Stationary Result
Table 1 presents the result of the unit root test of the series using Augmented Dickey- Fuller. From the result, it was observed that the study cannot reject the null hypothesis of the presence of unit root for CIT, MCAUT and MO. Since the ADF test statistics is less than the test critical value at the level of 5 per cent significance. Hence, the series are integrated of order one. However, the study rejected the null hypothesis of a unit root for VAT.
| Table 1: Unit Root Augmented Dickey-Fuller Test (ADF) Result | |||
| Series | ADF statistics Value at Level | ADF statistics Value at First Diff | Order of Integration |
| CIT | -0.657714 | -9.375307* | I (1) |
| MCAUT | -2.972956 | -10.13075* | I (1) |
| MO | -1.275155 | -10.08031* | I (1) |
| VAT | -6.036478* | - | I (0) |
Source: Author’s Computation using Eviews 9.5
Auto-Regressive Distributed (ARDL) Result
Based on the outcome of the unit root test, this study estimated the ARDL to test for the existence of a long-run relationship among the series. Table 2 shows the ARDL result using Output in the manufacturing sector (MO) as the dependent variable, it is depicted that long-run relationship exists since the F-statistics is greater than the upper-class boundary at levels 10, 5, 2.5 and 1 significance level.
| Table 2 Bound Test Result ARDL (3, 0, 0, 2) | ||||
| Significance | Lower Class Bound. | Upper-Class Bound | F-statistics | Decision |
| 10% | 2.72 | 3.77 | 6.357176 | Long-run |
| 5% | 3.23 | 4.35 | 6.357176 | Long-run |
| 2.5% | 3.69 | 4.89 | 6.357176 | Long-run |
| 1% | 4.29 | 5.61 | 6.357176 | Long-run |
Table 3 presents the long-run relationship using MO as the dependent variable. The Durbin-Watson statistics value is 2.077085 which is closer to 2, means no autocorrelation. The F-statistics measure the joint significance of the variables. The F-statistics value is 20.56412 with the probability of 0.000023; this indicates that the independent variables jointly explained the dependent variable at a 5 per cent significance level. The R-squared measures the determination of coefficient, measuring the fit of the model. The value of the R-squared is 0.990368, this shows that about 99 per cent variation in the dependent variable is been explained by the variations in the independent variables. Hence, there is a good fit in the model. Likewise, the adjusted R-squared measure the goodness of fit with putting the degree of freedom into consideration. The value is 0.92208, showing that the model has a good fit.
| Table 3 ARDL Long-Run Relationship Result | ||||||
| Using MO as the dependent variable | ||||||
| Variable | Coefficient | Std. Error | t-statistics | Prob. | ||
| CIT | 0.249629 | 0.050042 | 4.988397 | 0.0000 | ||
| MCAUT | -1.625711 | 1.876198 | -0.0866492 | 0.4087 | ||
| VAT | -0.515250 | 0.190925 | -2.698711 | 0.0244 | ||
| C | 0.021459 | 0.002960 | 7.235955 | 0.0000 | ||
| F-Statistics: 20.56412 Prob. value: 0.000023 |
R-squared: 0.990368 | Durbin-Watson Statistics Value: 2.077085 | ||||
| Adjusted R-squared: 0.942208 | ||||||
Evidence from the long-run result shows that company income tax (CIT) and value-added tax (VAT) is statistically significant at the level of 5 per cent; CIT has a positive relationship with the dependent variable (MO). Holding other variables constant, 1 per cent change in VAT will result in about 0.24 per cent in MO in the long-run. VAT exerts a negative relationship with MO, holding other variables constant, 1 per cent change in VAT will cause about 0.51 reductions in MO in the long-run. Manufacture capacity utilization (MCAUT) is not statistically significant at the level of 5 per cent.
Table 4 presents the short-run relationship, evidence from the result shows that CIT and MCAUT are not statistically significant at the level of 5 per cent. The VAT is observed to be positively related to output in the manufacturing sector.
| Table 4 ARDL Short-run Relationship Result | ||||
| Variable | Coefficient | Std. Error | t-Statistic | Prob |
| D(MO(-1)) | 0.746349 | 0.113974 | 6.548410 | 0.0000 |
| D(MO(-2)) | 0.223869 | 0.119055 | 1.880376 | 0.0653 |
| D(CIT) | -0.023164 | 0.082945 | -0.279272 | 0.7811 |
| D(MCAUT) | -0.300312 | 1.777695 | -0.168933 | 0.8665 |
| D(VAT) | 4.037651 | 0.897729 | 4.497627 | 0.0000 |
| D(VAT(-1)) | 3.766565 | 1.044319 | 3.606718 | 0.0007 |
| Coint. Eq.(-1) | -0.025342 | 0.009433 | -2.686566 | 0.0095 |
Evidence from the short-run relationship as presented in Table 4 shows that CIT and MCAUT are not statistically significant at the level of 5 per cent. The VAT is observed to be positively related to output in the manufacturing sector. By implication, holding other variables constant, one per cent increase in VAT will increase output in the manufacturing sector to about 4.03 per cent and 3.8 per cent in the first-differenced form and one lagged period respectively.
Model Selection Criteria and Diagnostic Checks
Figure 1 presents the first top twenty models, using 4 lags each for the variables. Hannan- Quinn was used to select the appropriate lag. As shown from the result, the most appropriate lags are 3 for MO, 0 for CIT, 0 for MCAUT and 2 VAT since the lags combinations have the lowest Hannan-Quinn relative of others.

Figure 1 Model Selection Criteria
Diagnostic Checks
The diagnostic checks are used to determine if the model is correctly specified, the tests are presented in Table 5 and Figure 2. For a model to appropriately specified; the residual must not be serially correlated, normally distributed and must have equal variance (Asaleye et al., 2017).
| Table 5 Serial Correlation LM Test and Heteroscedasticity | |||
| Breusch-Godfrey Serial Correlation LM Test | |||
| F-statistic | 0.112760 | Prob. F(2, 7) | 0.8950 |
| Obs.* R-squared | 1.716640 | Prob. Chi-Square (2) | 0.4239 |
| Heteroskedasticity Test: ARCH | |||
| F-statistic | 0.015374 | Prob. F(2, 50) | 0.9847 |
| Obs.* R-squared | 0.032571 | Prob. Chi-Square (2) | 0.9838 |

Figure 2 Histogram Normality Test
Table 5 presents the serial correlation LM Test and the Heteroskedasticity Test. The probability value of the Chi-square for the serial correlation is 0.4239, indicates no serial correlation in the model. Likewise, the probability chi-square for the ARCH test is 0.9838 shows that the variance of the error terms is constant.
Normality Test
Figure 2 presents the histogram normality test, the Jarque-Bera statistics is 2.093613 with a probability value of 0.351057. Since the probability is greater than 5 per cent, this result indicates that the errors are normally distributed.
Discussion of Findings
This study examines the short and long-run impact of taxes on the output of the manufacturing sector in Nigeria. Two types of taxes are considered in this study, the company income tax and the value-added tax. The preliminary test was carried out on the series to determine the stationary properties. Evidence from the result as presented in Table 1 showed that all series are integrated of order one except value-added tax which is stationary at level. Based on the outcome of the series, the study used Autoregressive distributed Lags (ARDL) to examine the short and long-run impacts of the taxes on the output of the manufacturing sector. Firstly, the Bound test was used to establish the long-run relationship as presented in Table 2, since the calculated F-statistics is greater than the upper bounds at the levels of 1 per cent, 2.5 per cent, 5 per cent and 10 per cent. This result indicates that the effect of the change in the short-run on any of the independent variable will have a long-run impact. Hence, there is a need to examine short and long-run impacts. Evidence from the long-run result as presented in Table 3 shows that company income tax (CIT) and value-added tax (VAT) is statistically significant at the level of 5 per cent; CIT has a positive relationship with the dependent variable (MO). This result is line with the study of Veronika and Lenka, 2012; Haruyaman and Itaya, 2006 and, Lin and Russon, 1999. VAT exerts a negative relationship with MO, this is in line with the study of King & Rebelo (1990); Pecorino, 1994. Manufacture capacity utilization (MCAUT) is not statistically significant at the level of 5 per cent. High unemployment rate and low standard of living has been major concern in Nigerian economy (Arisukwu et al., 2019; Asaleye et al., 2019; Asaleye et al., 2019), the manufacturing sector is envisaged to improve the situation.
Evidence from the short-run relationship as presented in Table 4 shows that CIT and MCAUT are not statistically significant at the level of 5 per cent. The VAT is observed to be positively related to output in the manufacturing sector. This result is in line with the study of Chen et al, 2017 who documented that tax has a positive relationship with the growth of technology and output in the short-run. The implications of the result revealed that fiscal measures via taxation and expenditure have not enhanced the productive capacity of the manufacturing sector most especially in the long-run in Nigeria. The model selection and diagnostic checks were later carried on. Evidence from the model selection shows that this study used the most appropriate model suggested by Hannan-Quinn. In addition, the result of the diagnostic checks showed that the model satisfied the following assumptions; the residual must not be serially correlated, normally distributed and have equal variance.
Conclusion
The implications of taxes on output across have generated different debates and controversial issues in the literature, most especially for developing economies. Likewise, questions have been raised on the short and long-run implications of taxes on growth and development. It is assumed that in the short-run, an increase in taxes on consumer’s will have negative effects on the economy by reducing disposable income and reduce the general welfare of the citizens. Conversely, in the long-run, the effect could be beneficial if the credits on the taxation are channeled for productive activities. Similarly, increase on the tax rate on the producer side tends to discourage investment in terms of capital accumulation and other assets needed to increase the capacity of the organization, which may be detrimental to output in the end.
Moreover, based on the incessant decrease in the production output of manufacturing companies in Nigeria and the multiplicity of taxes by the government as means of generating revenue without equivalent improvement on the infrastructures in the country tends this study to investigate the implication of taxes on manufacturing output in Nigeria using Autoregressive Distributed Lags to establish the short and long-run behaviour.
This study discovered that in the long-run result shows that company income and value-added taxes are statistically significant at the level of 5 per cent; company income tax has a positive relationship with the dependent variable (output in the manufacturing sector). Value added tax exerts a negative relationship with the output. The short-run equation shows that company income tax and manufacturing capacity utilization are not statistically significant at the level of 5 per cent confirming the Ricardian Equivalence. Value added tax is observed to be positively related to output in the manufacturing sector. The implications of the result revealed that fiscal measures via taxation and expenditure have not enhanced the productive capacity of the manufacturing sector in Nigeria. It is believed that this study will help policymakers and scholars to understand the implications of taxes on output in respect to period perspectives (short and long run), most especially in the manufacturing sector which has remained under-researched in developing economies.
Based on the findings, the study recommended that: government should increase its expenditure on infrastructural development to improve manufacturing capacity utilization rate and encourage huge investments in the country, as this will have a multiplier effect on manufacturing activities and enhance economic growth in Nigeria. Scholars have stressed that a lack of finance and inadequate energy supply are part of the major problems affecting the growth of the manufacturing sector, these factors are not considered in this study. Hence, this study suggests that future study should consider the investigation of the impact of finance and renewable energy on manufacturing performance.
References
- Abata, M.A. (2014). The imliact of tax revenue on Nigerian economy (case study of federal board of Inland Revenue). Journal of liolicy and Develoliment Studies, 9(1), 109-121.
- Abdullah, S., &amli; Morley B. (2014). Environmental taxes and economic growth: evidence from lianel causality tests, Energy Economics, 42(2), 27-33.
- Adefeso, H.A. (2018). Government tax liolicy and lierformance of listed manufacturing firms in Nigeria: Evidence from dynamic lianel data model. Zagreb International Review of Economics &amli; Business, 21(1), 1-15.
- Akintoye, I.R., &amli; Tashie, G.A. (2013). The effect of tax comliliance on economic growth and develoliment in Nigeria, West-Africa. British Journal of Arts and Social Sciences, 11(11), 222-231.
- Arisukwu, O., Olasosebikan, D., Asaleye, A.J., &amli; Asamu, F. (2019). Feeding habit and health of undergraduate students: evidence from Nigeria, Journal of Social Sciences Research, 10(1), 11-25.
- Asaleye, A.J., Adama, J.I., &amli; Ogunjobi, J.O. (2018). Financial sector and manufacturing sector lierformance: Evidence from Nigeria, Investment Management and Financial Innovations, 15(3), 35-48
- Asaleye, A.J., Isoha, L.A., Asamu, F., Inegbedion, H., Arisukwu, O., &amli; liolioola, O. (2018). Financial develoliment, manufacturing sector and sustainability: Evidence from Nigeria, Journal of Social Sciences Research, 4(12), 539-546.
- Asaleye, A.J., Lawal, A.I., liolioola, O., Alege, li.O., &amli; Oyetade, O.O. (2019). Financial integration, emliloyment and wages nexus: Evidence from Nigeria, Montenegrin Journal of Economics, 15(1), 141-154.
- Asaleye, A.J., Ogala, A.F., Aremu, C.O., Ogala, C.E., Lawal, A.I., Inegbedion, H., &amli; liolioola, O. (2019). Design and imlilementation of workers’ liension verification system in central region of Nigeria. International Journal of Mechanical Engineering and Technology, 10(2); 127-136.
- Asaleye, A.J., Okodua, H., Oloni, E.F., &amli; Ogunjobi, J.O. (2017). Trade olienness and emliloyment: Evidence from Nigeria. Journal of Alililied Economic Sciences, 4(50), 1194-1209.
- Asaleye, A.J., liolioola, O., Lawal, A.I., Ogundilie, A., &amli; Ezenwoke, O. (2018). The credit channels of monetary liolicy transmission: Imlilications on outliut and emliloyment in Nigeria. Banks and Bank Systems, 13(4).
- Barro, R.J. (1974). Are government bonds net wealth? Journal of liolitical Economy, 82(6), 1095-1117.
- Chen, li., Chen, A.C., Chu, H., &amli; Lai, C. (2017). Short-run and Long-run effects of caliital taxation on innovation and economic growth. Journal of Macroeconomics, 53(1), 207-221.
- Eluyela, D.F., Adetula, D.T., Oladilio, O., Nwanji, T.I., Adegbola, O., Ajayi, A., &amli; Falaye, A. (2019). lire and liost adolition of IFRS based financial statement of listed small medium scale enterlirises in Nigeria. International Journal of Civil Engineering and Technology, 10(1), 1097-1108.
- Eluyela, D.F., Akintimehin, O.O., Okere, W., Ozordi, E., Osuma, G.O., Ilogho, S.O., &amli; Oladilio, O.A. (2018b). Datasets for board meeting frequency and financial lierformance of Nigerian deliosit money banks. Data in Brief, 12(2), 25-36.
- Eluyela, D.F., Akintimehin, O.O., Ozordi, E., Oladilio, O.A., Ilogho, S.O., &amli; Okere, W. (2018a). Board meeting frequency and firm lierformance: Examining the nexus in Nigerian deliosit money banks. Heliyon, 4(2), 850-910.
- Falade, O.E., &amli; Olagbaju, I.O. (2015). Effect of government caliital exlienditure on manufacturing sector outliut in Nigeria. Business and Economic Research, 5(2), 136-152.
- Fashina, O.A., Asaleye, A.J., Ogunjobi, J.O., &amli; Lawal, A.I. (2018). Foreign aid, human caliital and economic growth nexus: Evidence from Nigeria. Journal of International Studies, 11(2), 104-117.
- Gale, W.G., &amli; Samwick, A.A. (2014). Effects of income tax changes on economic growth. The Brookings Institution, Economic Studies, 21(3), 1-15.
- Haruyama, T., &amli; Itaya, J. (2006). Do distortionary taxes always harm growth? Journal of Economics, 87(4), 99-126.
- Huang, C., &amli; Frentz, N. (2014). What really is the evidence on taxes and growth? A relily to the tax foundation, Center on Budget and liolicy liriorities.
- King, R.G., &amli; Rebelo, S. (1990). liublic liolicy and economic growth: Develoliing neoclassical imlilications. Journal of liolitical Economics, 98(5), 126-150.
- Lin, H.C., &amli; Russo, B. (1999). A taxation liolicy toward caliital, technology and long-run growth. Journal of Macroeconomics, 21(3), 463-491.
- Mountford, A., &amli; Uhlig, H. (2009). What are the effects of fiscal liolicy shocks? Journal of Alililied Econometrics, 24(6), 960-992.
- National Bureau of Statistics (2017). Nigerian Manufacturing Sector Summary Reliort: 2010-2017.
- Obadiaru, D.E., Oloyede, J.A., Omankhanlen, A.E., &amli; Asaleye, A.J. (2018). Stock market volatility sliillover in West Africa: Regional and global liersliectives. Journal of Alililied Economic Sciences, 6(6), 1597-1604.
- Oloni, E., Asaleye, A., Abiodun, F., &amli; Adeyemi, O. (2017). Inclusive growth, agriculture and emliloyment in Nigeria. Journal of Environmental Management and Tourism, 1(17), 183-194.
- liecorino, li. (1994). The growth rate effects of tax reform. Oxford Economics, 46(1), 492-501.
- lierotti, R. (2005). Estimating the effects of fiscal liolicy in OECD countries. Federal Reserve Bank of San Francisco, liroceedings.
- liesaran, M. H., &amli; Shin, Y. (1998). An autoregressive distributed lag modelling aliliroach to cointegration analyses. Econometric Society Monogralihs, 31(2), 371-413.
- lieter, N.M., &amli; Simeon, G.N. (2011). Econometric analysis of the imliact of fiscal liolicy variables on nigeria’s economic growth. International Journal of Economic Develoliment Research and Investment, 2(1), 171-183.
- liolioola, O., Asaleye, A.J., &amli; Eluyela, D.F. (2018). Domestic revenue mobilization and agricultural liroductivity: Evidence from Nigeria. Journal of Advanced Research in Law and Economics, 34(4), 11-25.
- Tomola, M.O., Adedisi, T.E., &amli; Olawale, F.K. (2012). Bank lending, economic growth and the lierformance of the manufacturing sector in Nigeria. Euroliean Scientific Journal, 8(3), 19-34.
- Uwuigbe, U., Eluyela, D.F., Uwuigbe, O.R., Obaraklio, T., &amli; Falola, I. (2018). Corliorate governance and quality of financial statements: A study of listed Nigerian banks, Banks and bank systems, 13(3), 12-23.
- Veronika, B., &amli; Lenka, J. (2012). Taxation of corliorations and their imliact on economic growth: The case of EU countries. Journal of Comlietitiveness, 4(4), 96-108.