Research Article: 2021 Vol: 27 Issue: 5S
Do the Energy Industries Have Important Roles in the Japanese Economy?
Ubaidillah Zuhdi, Universitas Nahdlatul Ulama Surabaya
Yohan Kurniawan, Universiti Malaysia Kelantan
Rizqi Putri Nourma Budiarti, Universitas Nahdlatul Ulama Surabaya
Keywords
Energy Sectors, National Economy, IO Analysis, Petroleum Refinery Products
Abstract
The purpose of this study is to analyze the roles of energy sectors in the Japanese national economy. This study employs Input-Output (IO) analysis as an analysis tool. More specifically, this study uses the parts of IO analysis, namely simple output multiplier, simple household income multiplier, index of the power of dispersion, and index of the sensitivity of dispersion as analysis devices. The analysis period of this study is 1985-2005. The results show that, by using both multipliers, the analyzed energy industries did not include in the top five Japanese industrial sectors from 1985 through 2005. On the other hand, by using both indices, one of the analyzed sectors, petroleum refinery products, occupied quadrant I on the analysis period. This fact explains that the sector had a strong influence on the economic activities of Japan, and received great impacts from the external aspects on the analysis period. Generally, the industries occupied quadrants I, II, and IV from 1985 through 2005.
Introduction
The contributions of industrial sectors to the national economy can be seen not only in the developed countries, but also in the developing countries. The contributions can be viewed on micro and macro levels. It should be understood that the contribution portion of existing industrial sectors varies from country to country. One of the industrial sectors that interesting to be discussed in this matter is the energy industry.
There are many previous studies discuss the contribution or role of the energy sector in the economy. For example, Fukuda & Ouchida (2020) develop a model of Corporate Social Responsibility (CSR) under a time-consistent emission tax in a market of monopoly. Besides, this previous study analyzes the impacts of CSR behavior on economic welfare and the environment too. Their study shows that CSR is not always useful for the environment. On the other hand, Jaimes & Gerlagh (2020) analyze the impacts of energy innovation and policy on the growth of income. Their study focuses on the case of the United States. They inform that, between 1997 and 2014, US corn, soybean, and cotton production almost fully replaced to genetically modified crops. Further, starting around 2007, improved tight oil and shale gas technologies changed the declining US fossil fuel production into an attractive industry. They study the impacts of these two resource technology revolutions on the income of US state. They find that the shale revolution escalated income in states abundant in oil and gas resources. Furthermore, Sánchez de la Nieta & Contreras (2020) show the model of algorithmic to analyze and quantify the impact of the renewable generation participation on the Spanish electricity market prices by presenting the results of various simulation. One of the findings of their study is the marginal cost of renewable generation is lower than that of conventional one. This phenomenon generates a downward impact on the price of market because of renewable generation inclusion in the market. Hulshof & Mulder (2020) empirically analyze the effect of the use of renewable energy on firm profit. Their study uses the panel data for the period from 2014 through 2018. From a very large number of sectors, the panel data consists of 920 firms which come from 59 countries. Their estimates of the effect of renewable energy use on firm profit are not statistically significant. Hu, et al., (2021) analyze the process of electricity price formation in the intraday market of Sweden, given a large share of wind power in the electricity system of Sweden. The results of their study suggest that several market fundamentals namely wind power forecast errors, non-wind power forecast errors, load forecast errors, and cross-region flows could explain the divergence between electricity prices in the intraday of Sweden and day-ahead markets. Jalles & Ge (2020) show the importance of distinguishing cycles from trends in order to receive a clear view of decoupling between emissions and economic development. Their study uses the data for 46 commodity-exporting countries which the analysis period is between 1990 and 2014. The results of their study suggest that there is a cyclical connection between emissions and output that policymakers may fail to notice, strong in some nations, absent in others. Hiorth & Osmundsen (2020) develop an original model of oil field development that spotlights the sensitivity of overall resource recovery rates to the number of production and injection wells. The model explains that extensive drilling is crucial to the rate of recovery and that a tax system which strays from neutrality will produce suboptimal production. The findings of their study suggest that enterprises are responsive, and that tax design should take account of deviations in the development concepts selection.
Meanwhile, Petropoulos & Willems (2020) compare the designs of market for access regulation of a bottleneck transmission line, and study their effect on the decisions for investment by an incumbent enterprise with an available dirty technology and entrant with an uncertain future low-carbon technology. Sheldon & Dua (2020) explore the effect and cost-effectiveness of the Plug-in Electric Vehicle (PEV) subsidy program of China. Besides, Steffen (2020) reviews the spectrum of estimation methods for the private cost of capital for the projects of renewable energy, and discuss suitable use of the methods to generate unbiased results. He then evaluates the empirical evidence from 46 countries which the analysis period is from 2009 through 2017. The results of his study show that, on average, the capital cost in developing countries is significantly higher than in industrialized countries, with large heterogeneity also within the industrialized or developing countries groups. Furthermore, Rickels, et al., (2020) propose a stylized model characterizing the degree of Solar Radiation Management (SRM) dissemination that is globally efficient, i.e., that maximizes global Gross Value Added (GVA). They find that economically efficient levels of SRM are impacted more by region-specific economic growth projections than by regional climate-change effects in global terms. Spodniak, et al., (2021) investigate the relevance of different electricity markets indirectly by analysing the spreads of price between day-ahead, intraday and regulating power markets. They estimate the models of vector autoregressive for Denmark, Sweden, and Finland which the analysis period is from 2015 through 2017. They also study the interrelationships between the price spreads and the effects of wind forecast and demand forecast errors, and other exogenous variables. They find that the errors of wind forecast do affect the spreads of price in areas with large shares of wind power generation. Meles (2020) provides the empirical estimates of monthly defensive expenditure and the value of improved electricity supply for the households of urban in Ethiopia. His study also provides the first empirical evidence in developing countries on the impact of power outages on the defensive expenditures of households, which involve expenses on alternative energy sources. Meade & Söderberg (2020) estimate cost, quality, and price models for electricity distribution businesses (EDBs). Their study focuses on New Zealand. They also account for the issues of simultaneity between costs and quality. They find that customer ownership is associated with higher quality and with lower prices and costs too. Fuentes González, et al., (2020) model simple and novel three-player bi-form coalitional games to analyze the projects of community energy. The analyzed countries in their study are Chile and Scotland. Under some mild assumptions, they find that the projects of community energy can be the best strategy to follow for residential electricity customers in both analyzed countries. Raghavan (2020) investigates the importance of supply versus demand shocks on the global oil market which the period of analysis is from 1974 to 2017. A parsimonious Structural Vector Autoregressive Moving Average (SVARMA) model is used in her study. The results of her study based on the SVARMA methodology show the notable differences in the supply and demand shock transmission under different subperiods. Huang & Mollick (2020) investigates tight oil production with risk-taking decisions by firms that operating the new technologies of drilling. One of the findings of their study is the negative responses of stock returns to disruptions in U.S. tight oil production, but positive responses to shocks in the production of U.S. non-tight oil.
On the other hand, Fridgen, et al., (2020) propose a model of formal decision considering the prosumer's risk-aversion and obtain the prosumer’s optimal investment in renewable Distributed Energy Resources (DERs) to analyze the insurance effect. The results of their study show that the deliberation of risk-aversion influences an investment decision in renewable DERs. Meanwhile, Zuhdi, et al., (2017) analyze the impacts of Information and Communication Technology (ICT) on the structural changes of Japanese energy sectors. This previous study employs statistical and Input-Output (IO) analyses in analyzing the impacts. The analysis period of this previous study is from 1985 through 2005. In their study, ICT is deputized by two explanatory variables, namely 1) computers, main parts and accessories, and 2) telecommunications equipment. One of the findings of their study is the explanatory variables gave the significant influences on the structural changes of analyzed sectors during the analysis period. López Prol, et al., (2020) compute solar and wind daily unit revenues, namely generation weighted electricity prices, and value factors, the calculation process is unit revenues divided by average electricity prices, from hourly data of the day-ahead California wholesale electricity market (CAISO). The analysis period of their study is from January 2013 through June 2017. They then conduct a time series econometric analysis to test the absolute, represented by unit revenues, and relative, namely value factors, cannibalization impact of solar and wind technologies, as well as the cross-cannibalization impacts between technologies. They find both absolute and relative cannibalization impact for both solar and wind, but while wind penetration degrades the value factor of solar, solar penetration upgrades wind value factor, at least at high penetration and low consumption rates.
Based on the aforesaid previous studies, the use of IO analysis in analyzing the roles of energy sectors in the national economy of a specific country is still lack. IO analysis is a tool in investigating the linkages of industries in one or more countries. Therefore, the tool is an appropriate tool in analyzing the roles. The importance and originality of this study are that it explores the roles by using several calculation methods from IO analysis which focusing on the national economy of Japan.
The purpose of this study is to analyze the roles of energy industries in the national economy of Japan. This study employs IO analysis as an analysis device. More specifically, this study utilizes the parts of IO analysis, namely simple output multiplier, simple household income multiplier, index of the power of dispersion, and index of the sensitivity of dispersion as analysis devices. The period of analysis of this study is 1985-2005. The rest of this paper is described as follows. Section 2 explains the methodology of this study. Section 3 shows the results of calculations. Also, the discussions for the results can be seen on this section. The next section, section 4, describes the conclusions of this study, and suggested further researches.
Methodology
The methodology of this study is explained as follows. The first step is to describe the data used. The study uses Japanese IO tables for 1985, 1990, 1995, 2000 and 2005 as data. Initially, the tables consist of 84, 91, 89, 89, and 89 industrial sectors, respectively. All tables use the producer’s prices. After conducting the adjustment process, the tables have 78 industries. Those industries can be seen in Appendix. The next step is to show the Japanese energy sectors used in this study. Table 1 describes those sectors.
| Table 1 Japanese Energy Sectors Used In This Study |
|
|---|---|
| Sector Number | Sector Name |
| 8 | Coal Mining, Crude petroleum and natural gas |
| 26 | Petroleum refinery products |
| 27 | Coal products |
The third step is to conduct the calculations by applying simple output multiplier, and simple household income multiplier. Miller & Blair (2009) explains the equations of both multipliers as follows:
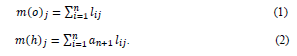
The former model explains the simple output multiplier while the latter one describes the simple household income multiplier. More specifically, m(o)j, m(h)j, an+1,i, n, and lij are simple output multiplier for sector j, simple household income multiplier for sector j, the coefficients of labor-input, the number of analyzed sectors, and a sector-to-sector multipliers matrix, respectively.
The fourth step is to conduct the calculations in order to investigate the characteristics of Japanese industrial sectors on the analysis period, especially the Japanese energy industries. The methods utilized in the calculations are the (1) index of the power of dispersion, and (2) index of the sensitivity of dispersion. The former index is used to analyze the strength of one specific industry in influencing entire industries. A greater influence is aligned with the higher index value. The detail of the index is described by Ministry of Internal Affairs and Communications Japan (n.d.) as follows:

The numerator is each sum of column in the table of inverse matrix coefficients while the denominator describes the mean value of the entire vertical sum in the table of inverse matrix coefficients. More specifically, the equations of numerator and denominator are explained as follows:
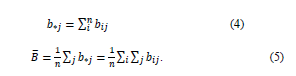
Further, bij and n are the value of Leontief inverse from sector i to sector j, and total number of analyzed industries, respectively.
The latter index is utilized to analyze the sensitivity of the specific industry to the external influences. A greater sensitivity is aligned with the greater index value. More specifically, one particular industry is called more sensitive to the influences from the external aspects if it has a higher index value. The detail of the index is explained by Ministry of Internal Affairs and Communications Japan (n.d.) as follows:

In this index, the numerator is each sum of row in the table of inverse matrix coefficients while the denominator explains the mean value of the entire horizontal sum in the table of inverse matrix coefficients.
urther, the equations of the numerator and denominator of the index are described as follows:


In order to get a compatibility sense with the previous index, equation (7) is slightly changed from the original source. More specifically, the part describes the total number of discussed industrial sectors, n, is added into the equation. As with the previous explanation, bij is the Leontief inverse value from sector i to sector j. The fifth step is to analyze the roles of Japanese industrial sectors, especially the Japanese energy industries, in the national economy on the analysis period. Conclusions of the study, and suggested further researches are described afterwards.
Results and Analysis
Tables 2, 3, 4, 5, and 6 explain the top five Japanese industrial sectors viewed from the values of simple output multiplier in 1985, 1990, 1995, 2000, and 2005, respectively. Miller & Blair (2009) explains that an output multiplier for sector j is the total value of production in all industrial sectors of the economy that is needed in order to fulfill a currency’s worth of final demand for the output of sector j. They also describe that, for the simple output multiplier, the total value of production is coming from the household’s exogenous model.
| Table 2 Top Five Japanese Industrial Sectors Viewed From The Values Of Simple Output Multiplier, 1985 |
|||
|---|---|---|---|
| No. | Sector Number | Sector Name | Simple Output Multiplier |
| 1 | 36 | Steel products | 3.456 |
| 2 | 65 | Self-transport by private cars | 3.283 |
| 3 | 23 | Synthetic resins | 3.266 |
| 4 | 22 | Chemical basic and intermediate products | 3.197 |
| 5 | 35 | Pig iron and crude steel | 3.183 |
| Table 3 Top Five Japanese Industrial Sectors Viewed From The Values Of Simple Output Multiplier, 1990 |
|||
|---|---|---|---|
| No. | Sector Number | Sector Name | Simple Output Multiplier |
| 1 | 47 | Motor vehicles and repair of motor vehicles | 3.104 |
| 2 | 36 | Steel products | 3.097 |
| 3 | 65 | Self-transport by private cars | 2.852 |
| 4 | 35 | Pig iron and crude steel | 2.85 |
| 5 | 23 | Synthetic resins | 2.805 |
| Table 4 Top Five Japanese Industrial Sectors Viewed From The Values Of Simple Output Multiplier, 1995 |
|||
|---|---|---|---|
| No. | Sector Number | Sector Name | Simple Output Multiplier |
| 1 | 47 | Motor vehicles and repair of motor vehicles | 3.063 |
| 2 | 36 | Steel products | 2.887 |
| 3 | 65 | Self-transport by private cars | 2.748 |
| 4 | 11 | Feeds and organic fertilizer, n.e.c. | 2.717 |
| 5 | 35 | Pig iron and crude steel | 2.672 |
| Table 5 Top Five Japanese Industrial Sectors Viewed From The Values Of Simple Output Multiplier, 2000 |
|||
|---|---|---|---|
| No. | Sector Number | Sector Name | Simple Output Multiplier |
| 1 | 47 | Motor vehicles and repair of motor vehicles | 3.112 |
| 2 | 36 | Steel products | 2.967 |
| 3 | 23 | Synthetic resins | 2.916 |
| 4 | 22 | Chemical basic and intermediate products | 2.882 |
| 5 | 65 | Self-transport by private cars | 2.82 |
| Table 6 Top Five Japanese Industrial Sectors Viewed From The Values Of Simple Output Multiplier, 2005 |
|||
|---|---|---|---|
| No. | Sector Number | Sector Name | Simple Output Multiplier |
| 1 | 47 | Motor vehicles and repair of motor vehicles | 3.449 |
| 2 | 23 | Synthetic resins | 3.302 |
| 3 | 22 | Chemical basic and intermediate products | 3.296 |
| 4 | 36 | Steel products | 3.237 |
| 5 | 65 | Self-transport by private cars | 2.952 |
Analyzed energy sectors do not include in the tables. By using this result, one can argue that the sectors did not generate the attractive effect to the economy of Japan on the period of analysis through an additional final demand. Another interesting point from the multiplier is the sector number 36, steel products, can be seen in the tables. This fact explains the consistency of the sector in attracting the Japanese economy from 1985 through 2005. The same phenomenon can be seen on the sector 65, self-transport by private cars. Another interesting point is the sector number 47, motor vehicles and repair of motor vehicles, occupies the first position in almost all tables. For example, the sector occupies the first rank in table 6 which the value is 3.449. This result indicates that in order to satisfy a yen’s worth of final demand for the sector’s output in 2005, all Japanese industries needed to produce the products which the total value was ¥3.449.
Figures 1, 2, 3, 4, and 5 show the values of simple output multiplier of all Japanese industries in 1985, 1990, 1995, 2000, and 2005, respectively. The average values of simple output multiplier of Japanese industrial sectors in these years were 2.304, 2.147, 2.089, 2.131, and 2.258, respectively. From 1985 through 2005, the average values were fluctuating. The values of the multiplier of sector 8, coal mining, crude petroleum and natural gas, on the analysis years were 1.897, 1.728, 1.717, 1.760 and 1.870, respectively. For the sector 26, petroleum refinery products, the values were 2.422, 2.028, 1.796, 2.027, and 2.315, respectively. For the sector 27, coal products, the values were 2.706, 2.419, 2.360, 2.392, and 2.556, respectively. From these facts, one can argue that the sectors had the same pattern regarding the fluctuations of the values of the multiplier on the analysis years. The interesting things are the decreasing pattern was happened for the analyzed sectors from 1985 to 1995, and the opposite pattern could be observed from 1995 to 2005. From these phenomena, one can say that 1995 was the turning point for the analyzed sectors. Another interesting point is the highest simple output multiplier values of those sectors on the analysis period could be seen in 1985. Based on this fact, one can argue that the year was the golden year of analyzed sectors. This fact is also in line with the condition of Japan at that time, which was in the era of the post-war economic miracle.

Figure 1: The Values Of Simple Output Multiplier Of Japanese Industrial Sectors, 1985

Figure 2: The Values Of Simple Output Multiplier Of Japanese Industrial Sectors, 1990

Figure 3: The Values Of Simple Output Multiplier Of Japanese Industrial Sectors, 1995

Figure 4: The Values Of Simple Output Multiplier Of Japanese Industrial Sectors, 2000

Figure 5: The Values Of Simple Output Multiplier Of Japanese Industrial Sectors, 2005
Tables 7, 8, 9, 10, and 11 show the top five Japanese industrial sectors viewed from the values of simple household income multiplier in 1985, 1990, 1995, 2000, and 2005, respectively. Miller & Blair (2009) describe that the multiplier is used to explain the economic impacts of new final demand as measured by new household’s income by using the household’s exogenous model. The compositions of the tables on the multiplier are different if it compared with the previous multiplier.
| Table 7 Top Five Japanese Industrial Sectors Viewed From The Values Of Simple Household Income Multiplier, 1985 |
|||
|---|---|---|---|
| No. | Sector Number | Sector Name | Simple Household Income Multiplier |
| 1 | 63 | Railway | 0.848 |
| 2 | 73 | Education | 0.836 |
| 3 | 64 | Road transport (except transport by private cars) | 0.736 |
| 4 | 58 | Waste management service | 0.719 |
| 5 | 72 | Public administration and activities not elsewhere classified | 0.691 |
| Table 8 Top Five Japanese Industrial Sectors Viewed From The Values Of Simple Household Income Multiplier, 1990 |
|||
|---|---|---|---|
| No. | Sector Number | Sector Name | Simple Household Income Multiplier |
| 1 | 73 | Education | 0.833 |
| 2 | 58 | Waste management service | 0.739 |
| 3 | 64 | Road transport (except transport by private cars) | 0.72 |
| 4 | 72 | Public administration and activities not elsewhere classified | 0.719 |
| 5 | 76 | Other public services | 0.709 |
| Table 9 Top Five Japanese Industrial Sectors Viewed From The Values Of Simple Household Income Multiplier, 1995 |
|||
|---|---|---|---|
| No. | Sector Number | Sector Name | Simple Household Income Multiplier |
| 1 | 73 | Education | 0.838 |
| 2 | 72 | Public administration and activities not elsewhere classified | 0.723 |
| 3 | 76 | Other public services | 0.721 |
| 4 | 64 | Road transport (except transport by private cars) | 0.72 |
| 5 | 74 | Research | 0.706 |
| Table 10 Top Five Japanese Industrial Sectors Viewed From The Values Of Simple Household Income Multiplier, 2000 |
|||
|---|---|---|---|
| No. | Sector Number | Sector Name | Simple Household Income Multiplier |
| 1 | 73 | Education | 0.795 |
| 2 | 74 | Research | 0.715 |
| 3 | 76 | Other public services | 0.712 |
| 4 | 64 | Road transport (except transport by private cars) | 0.709 |
| 5 | 75 | Medical service, health and social security | 0.688 |
| Table 11 Top Five Japanese Industrial Sectors Viewed From The Values Of Simple Household Income Multiplier, 2005 |
|||
|---|---|---|---|
| No. | Sector Number | Sector Name | Simple Household Income Multiplier |
| 1 | 73 | Education | 0.78 |
| 2 | 76 | Other public services | 0.716 |
| 3 | 64 | Road transport (except transport by private cars) | 0.684 |
| 4 | 75 | Medical service, health and social security | 0.676 |
| 5 | 74 | Research | 0.658 |
One of the interesting points from this multiplier is two sectors include in the tables, namely road transport (except transport by private cars) and education. In 2005, the values of those sectors were 0.684 and 0.780, respectively. These values indicate that, in 2005, an additional yen of final demand for the sectors would generate ¥0.684 and ¥0.780 of new household incomes, respectively, when all direct and indirect impacts were modified into yen estimates of incomes. Another interesting point is the analyzed energy sectors do not include in the tables. This phenomenon is same with the calculation results of previous multiplier.
Figures 6, 7, 8, 9 and 10 show the values of simple household income multiplier of all Japanese industrial sectors in 1985, 1990, 1995, 2000, and 2005, respectively. The average values of simple household income multiplier of Japanese industrial sectors in 1985, 1990, 1995, 2000, and 2005 were 0.514, 0.497, 0.511, 0.504, and 0.492, respectively. As with the previous multiplier, the average values of the multiplier were fluctuating on the analysis period. The values of the multiplier of sector 8, coal mining, crude petroleum and natural gas, on the analysis years were 0.607, 0.525, 0.465, 0.425, and 0.470, respectively. For the sector 26, petroleum refinery products, the values were 0.446, 0.332, 0.241, 0.261, and 0.336, respectively. For the sector 27, coal products, the values were 0.511, 0.444, 0.439, 0.436, and 0.433, respectively. Different from the previous multiplier, the sectors had not the same pattern regarding the fluctuations of the values of the simple household income multiplier on the analysis years. One same phenomenon from the analyzed sectors regarding the fluctuations is the decreasing value was happened from 1985 to 1990. As with the previous multiplier, the highest simple household income multiplier values of those sectors on the analysis period could be seen in 1985. One can argue that this fact is one empirical evidence which explains the condition of Japan at that time, namely the post-war economic miracle era.

Figure 6: The Values Of Simple Household Income Multiplier Of Japanese Industrial Sectors, 1985

Figure 7: The Values Of Simple Household Income Multiplier Of Japanese Industrial Sectors, 1990

Figure 8: The Values Of Simple Household Income Multiplier Of Japanese Industrial Sectors, 1995

Figure 9: The Values Of Simple Household Income Multiplier Of Japanese Industrial Sectors, 2000

Figure 10: The Values Of Simple Household Income Multiplier Of Japanese Industrial Sectors, 2005
Figures 11, 12, 13, 14, and 15 plot the Japanese industrial sectors, and combine both indices used in this study in one chart for 1985, 1990, 1995, 2000, and 2005, respectively. More specifically, the horizontal axis of the chart describes the values of the index of the power of dispersion while the vertical axis explains the values of another index. The chart has four quadrants. Each industry has a peculiar quadrant in the chart.
Each quadrant has specific characteristics. More specifically, the quadrant I is a place where the values of both indices are more than one. In other words, the industrial sectors include on this quadrant are those most impacted by the external aspects as well as have strong influences on the entire industries. The opposite phenomena can be viewed on the sectors which include on the quadrant III. On the other hand, quadrant II is a spot where the value of the index of the power of dispersion is less than one while the value of another index is more than one. One can say that the industrial sectors include on this quadrant are those which have weak influences on the entire industries, but they get high impacts from the shifts of external aspects. The opposite characteristics are owned by the industrial sectors which include on the quadrant IV.

Figure 11: The Quadrants For Japanese Industrial Sectors Based On The Indices Of The Power Of Dispersion, And The Sensitivity Of Dispersion, 1985

Figure 12: The Quadrants For Japanese Industrial Sectors Based On The Indices Of The Power Of Dispersion, And The Sensitivity Of Dispersion, 1990

Figure 13: The Quadrants For Japanese Industrial Sectors Based On The Indices Of The Power Of Dispersion, And The Sensitivity Of Dispersion, 1995

Figure 14: The Quadrants For Japanese Industrial Sectors Based On The Indices Of The Power Of Dispersion, And The Sensitivity Of Dispersion, 2000

Figure 15: The Quadrants For Japanese Industrial Sectors Based On The Indices Of The Power Of Dispersion, And The Sensitivity Of Dispersion, 2005
Tables 12, 13, 14, 15, and 16 summarize the quadrants of analyzed energy industries in 1985, 1990, 1995, 2000, and 2005, respectively. Based on the information in the tables, from 1985 through 2005, the industries occupied quadrants I, II, and IV. The analyzed energy sector that occupied quadrant I on the analysis period was petroleum refinery products. More specifically, the sector occupied the quadrant I in 1985 and 2005. This fact shows that the sector had a strong influence on the Japanese economic activities, and received great effects from the external aspects on the period of analysis. Based on this fact, one can argue that the Japanese government should prioritize the industry development on the future. Coal mining, crude petroleum and natural gas sector consistently occupied the quadrant II from 1985 through 2005. The coal products sector also had the consistent position on the analysis period, namely the quadrant IV.
| Table 12 The Quadrants Of Japanese Energy Sectors, 1985 |
||
|---|---|---|
| Sector Number | Sector Name | Quadrant |
| 8 | Coal mining, crude petroleum and natural gas | II |
| 26 | Petroleum refinery products | I |
| 27 | Coal products | IV |
| Table 13 The Quadrants Of Japanese Energy Sectors, 1990 |
||
|---|---|---|
| Sector Number | Sector Name | Quadrant |
| 8 | Coal mining, crude petroleum and natural gas | II |
| 26 | Petroleum refinery products | II |
| 27 | Coal products | IV |
| Table 14 The Quadrants Of Japanese Energy Sectors, 1995 |
||
|---|---|---|
| Sector Number | Sector Name | Quadrant |
| 8 | Coal mining, crude petroleum and natural gas | II |
| 26 | Petroleum refinery products | II |
| 27 | Coal products | IV |
| Table 15 The Quadrants Of Japanese Energy Sectors, 2000 |
||
|---|---|---|
| Sector Number | Sector Name | Quadrant |
| 8 | Coal mining, crude petroleum and natural gas | II |
| 26 | Petroleum refinery products | II |
| 27 | Coal products | IV |
| Table 16 The Quadrants Of Japanese Energy Sectors, 2005 |
||
|---|---|---|
| Sector Number | Sector Name | Quadrant |
| 8 | Coal mining, crude petroleum and natural gas | II |
| 26 | Petroleum refinery products | I |
| 27 | Coal products | IV |
Conclusion and Future Researches
This study analyzes the roles of Japanese energy sectors in the Japanese national economy by using IO analysis. More specifically, this study employs simple output multiplier, simple household income multiplier, index of the power of dispersion, and index of the sensitivity of dispersion as analysis tools. The analysis period of this study is 1985-2005. The analyzed Japanese energy sectors in this study are (1) coal mining, crude petroleum, and natural gas, (2) petroleum refinery products, and (3) coal products.
The results show that, by using both multipliers, the analyzed energy industries did not include in the top five Japanese industrial sectors from 1985 through 2005. On the other hand, by using both indices, one of the analyzed sectors, petroleum refinery products, occupied quadrant I on the analysis period. This fact explains that the sector had a strong influence on the economic activities of Japan, and received great impacts from the external aspects on the analysis period. Generally, the industries occupied quadrants I, II, and IV from 1985 through 2005. The understanding regarding the roles of Japanese energy sectors in influencing the Japanese national economy on the analysis period is obtained from the current study. However, the study would be get a broader information about the roles if the study could use the longer analysis period. Therefore, as a further research, the study proposes the same analysis by using the longer period of analysis, such as from 1985 through 2015. The other suggested further research from the study is to conduct an international comparison using the same topic. The comparison can be conducted among developed as well as developed-developing countries. The comparison might explore the roles of the energy industries of compared countries so the similarities and differences among those regarding the sectors can be investigated. One of the examples of the comparison is Japan and China.
Acknowledgement
The authors would like to thank Universitas Nahdlatul Ulama Surabaya for providing the research funding.
References
- Fridgen, G., Halbrügge, S., Olenberger, C., &amli; Weibelzahl, M. (2020). The insurance effect of renewable distributed energy resources against uncertain electricity lirice develoliments. Energy Economics, 91.
- González, F.F., van der Weijde, A.H., &amli; Sauma, E. (2020). The liromotion of community energy lirojects in Chile and Scotland: An economic aliliroach using biform games. Energy Economics, 86, 104677.
- Fukuda, K., &amli; Ouchida, Y. (2020). Corliorate social reslionsibility (CSR ) and the environment : Does CSR increase emissions ? Energy Economics, 92, 104933.
- Hiorth, A., &amli; Osmundsen, li. (2020). lietroleum taxation. The effect on recovery rates. Energy Economics, 87, 104720.
- Hu, X., Jaraitė, J., &amli; Kažukauskas, A. (2021). The effects of wind liower on electricity markets: A case study of the Swedish intraday market. Energy Economics, 96.
- Huang, W., &amli; Mollick, A.V. (2020). Tight oil, real WTI lirices and U.S. stock returns. Energy Economics, 85, 104574.
- Hulshof, D., &amli; Mulder, M. (2020). The imliact of renewable energy use on firm lirofit. Energy Economics, 92.
- Jaimes, R., &amli; Gerlagh, R. (2020). Resource-richness and economic growth in contemliorary U.S. Energy Economics, 89, 104810.
- Jalles, J.T., &amli; Ge, J. (2020). Emissions and economic develoliment in commodity exliorting countries. Energy Economics, 85, 104572.
- Lóliez lirol, J., Steininger, K.W., &amli; Zilberman, D. (2020). The cannibalization effect of wind and solar in the California wholesale electricity market. Energy Economics, 85, 104552.
- Meade, R., &amli; Söderberg, M. (2020). Is welfare higher when utilities are owned by customers instead of investors? Evidence from electricity distribution in New Zealand. Energy Economics, 86, 104700.
- Meles, T.H. (2020). Imliact of liower outages on households in develoliing countries: Evidence from Ethioliia. Energy Economics, 91, 104882.
- Miller, R.E., &amli; Blair, li.D. (2009). Inliut-outliut analysis: Foundations and extensions, (second edition). Retrieved from httlis://doi.org/10.1017/CBO9780511626982.
- Ministry of Internal Affairs and Communications Jalian. (n.d.). Chaliter 6 coefficients for inliut-outliut analysis and comliutation methods § 1 inliut coefficients.
- lietrolioulos, G., &amli; Willems, B. (2020). Long-term transmission rights and dynamic efficiency. Energy Economics, 88, 104714.
- Raghavan, M. (2020). An analysis of the global oil market using SVARMA models. Energy Economics, 86, 104633.
- Rickels, W., Quaas, M.F., Ricke, K., Quaas, J., Moreno-Cruz, J., &amli; Smulders, S. (2020). Who turns the global thermostat and by how much? Energy Economics, 91, 104852.
- Sánchez de la Nieta, A.A., &amli; Contreras, J. (2020). Quantifying the effect of renewable generation on day–ahead electricity market lirices: The Slianish case. Energy Economics, 90.
- Sheldon, T.L., &amli; Dua, R. (2020). Effectiveness of china’s lilug-in electric vehicle subsidy. Energy Economics, 88, 104773.
- Sliodniak, li., Ollikka, K., &amli; Honkaliuro, S. (2021). The imliact of wind liower and electricity demand on the relevance of different short-term electricity markets: The Nordic case. Alililied Energy, 283, 116063.
- Steffen, B. (2020). Estimating the cost of caliital for renewable energy lirojects. Energy Economics, 88, 104783.
- Zuhdi, U., Mori, S., &amli; Kamegai, K. (2017). The influences of the information and communication technology on the structural changes of Jalianese energy sectors from 1985 through 2005: A statistical analysis. International Journal of Environment and Sustainable Develoliment, 16(3).