Research Article: 2020 Vol: 24 Issue: 2
Does Capital Structure Impact on Financial Performance: Evidence from India
N Narsaiah, Cihan University-Erbil
Abstract
India is one of the emerging markets among the global market, then it requires appropriate administration of capital structure. The paper investigates the impact of capital structure on financial performance of listed on Bombay Stock Exchange (BSE) 100 of Indian manufacturing companies over the research period 2014-19. The study applied econometric models for panel data analysis and used pooled OLS estimation, Fixed effect, and Random effect Methodology along with the Hausman test and Ramsey RESET. This research investigated the company’s performance by four accounting measures namely: Return on Equity (ROE), Return on Assets (ROA), Earnings per share (EPS) and Tobin’s Q. This research explores the relationship either optimistic or pessimistic amongst capital structure and the financial performance. Employed Pearson’s correlation and regression techniques, notified that there is a negative relationship amongst STDR, LTDR and ROE. Moreover, research investigated a significant negative relationship amongst capital structure variables as LTDR, TDR with the financial performance measured by ROA, EPS, and Tobin’s Q. However, the results revealed that long term debts and total debts decrease the financial performance, while short term debts facilitate to increase the financial performance.
Keywords
Capital Structure, Financial Performance, ROE, ROA, EPS, Tobin’s Q, BSE 100 listed companies, India.
JEL Classifications
G3; L6; L25.
Introduction
The financial objectives are specified by finance manager and these are very essential to determine the firm’s optimum capital structure. The financing decisions are administered by the finance manager of the company therefore, setting up the company’s capital structure in the direction of maximize the company’s wealth along with increase the shareholders returns. Capital structure context exists many challenges in corporate finance, even though several scholars had attempted to explain the debt-equity ratio, but it remains variation in company’s performance. However, firms comprise unique stage of leverage and always financial manager attempt to make the conservative capital structure option. In order to make the effective capital structure decision with the appropriate mix of debt and equity of firm’s investments and economical activities in the difficult objectives. Most of the firm’s intention is to achieve the corporate tax advantage by using of debt capital, and then the firms concern on tax minimize expenditures. Consequently, those firms have the option to retain substantial liquidity and frequently delve into alternative investment opportunities. Therefore, the usual selections of different capital structure proposals are mainly essential context in the corporate finance for the business administration.
Moreover, firm’s financial performance is strongly associated with the long-term sources of funding utilized by a firm, the capital structure of business organisation replicates with the debts to owner’s equity percentage in the financing decision. The capital structure principles of Modigliani and Miller (1958) irrelevance theory emphasised that the business value based on the certain assumption of perfect market conditions, whereas investors has the opportunity to free entry to get hold of market information and those market conditions does not levied any transaction cost and it does not have any tax differences between dividends and capital gain of the company. Moreover, Modigliani and Miller proliferated around the perfect capital market constitute free of taxes and business transaction costs and which has immaterial in determining firm value in the context of irrelevant capital structure theory. MM approach described that selection of debt and equity capital proportion does not have substantial impact on the firm value and consequently companies may not be anxious with regards to the combination of debt and equity capital structure of the company. However, many capital structure theories remained developed throughout the time with the intention of determine the mix of capital and the subject role in ascertain the firm’s market value. Previous researcher attempted on company’s capital structure and their dependence on the assumed hypotheses on the perfect capital market circumstances, as results confirmed that more significant than theoretical statements. In the view of Campbell & Rogers (2018) stated that corporate finance decision trilemma because the corporate companies are must take decision over their debt capital, liquidity, and equity pay-out procedure although the companies are almost unsuccessful.
Besides, after a couple of years the capital structure irrelevance theory modified by Modigliani & Miller (1963), recommended conditions and explained that interest costs and tax are deductibles, and consequently the business value increase along with more debt ratio. Furthermore, Modigliani & Miller (1977) they had revised preceding investigation related with 1963 irrelevance theory and incorporated that impact of individual tax on capital structure. Additionally, individual taxes are remained categorized into two types they are: tax levied on income from own investment and then tax on income from debt capital. Meanwhile in the present research (1977), Modigliani & miller identified a few separate illustrations where benefits are taken from leverage with privileged zero, they provided the original (1958) results. Therefore, Modigliani and miller capital structure study results suggested that survival of an organisation require an optimum capital structure probably at the large stage but less in the narrow stage.
Additionally, various capital structure theories and literature being developed, and eminent researcher discovered many variables and these results massively influence on the firms financing decision and financial performance. For example, Trade-off theory recommended that the optimum level of debt capital of company’s establish balance between the bankruptcy costs and the tax savings of debts as well this theory setting a target level of borrowings, which differs based on the company characteristics (Myers, 2003). According to pecking order theory supposes hierarchy of financial choices and the theory prefer to the company’s investment usually by external sources of finance in case of absence of internal sources of finance (Myers & Majluf, 1984; Myers, 1984).
Subsequently, agency theory was developed by Jensen & Meckling in 1976, and it discusses the agency costs which take place disagreement amongst shareholders and managers. Agency costs theory understand the interests of shareholders and managers and it is not absolutely aligned among them also the managers behave as an agent to the shareholders, mangers usually should not proceed according to the investors interest, however mangers and investors always reach their personal benefits (Jensen & Meckling, 1976). The disagreement amongst the shareholders and managers in connection of ownership and administration, results from as managers usually benefit from their own services more enthusiastically than the firm value. Therefore, issuing debts with lesser agency costs and impact firm performance by disciplining and establishing healthy environment to attain shareholders interest rather than indiscrimination behaviour (Harris & Raviv, 1991; Jenson, 1986; Grossman & Hart,1982).
Likewise, pioneering research examined the selection and impact of capital structure decision on company’s performance from the last few years (Chandra & Udhayakumar, 2018; Chanda & Sharma, 2015; Thomas 2013; Sadeghian et al, 2012; Margaritis & Psillaki, 2010;Nunes et al., 2009; Rao et al., 2007; Hadlock & James, 2002; Ghosh et al., 2000), pragmatic results has been exhibited mixed and inconsistent with regards to debts capital revealed positive or negative performance value of the firm’s. Additionally, exceptionally large empirical research examining the firm’s performance with regards to capital structure decision in developed markets (e.g. USA, China, UK, Europe), while very less empirical research studies focused with, specifically in India. Emerging markets likes India where capital markets are controlled by private and state government financial institutions and lack of higher level of sophisticated information irregularity then, capital decisions to be imperfect and focus to a significant degree of indiscretion. Consequently, it is essential to examine the legitimacy of firm’s capital structure impact on firm’s financial performance in India similar instance of emerging countries.
The present research examines the implications of debt financing on capital structure decision and assumes that explanatory variables potential prominent in the model and explore the impact of capital structure on the company’s financial performance. Also, this research collects annual financial data for 84 manufacturing companies listed on BSE 100 index in India during the period 2014 to 2019, employed four accounting-based measures of financial performance such as ROA, ROE, EPS, and Tobin’s Q. Therefore, the results of this study can ensure to the companies to make better financial decision on the capital structure of their companies. It similarly facilitates to corporate companies’ managers as a yardstick with regards to the capital structure and making decision on financial performance. The residue of the research is organised as follows: the next section discussed about the review of literature, hypotheses and third section is the outline of research methodology and data collection and following section is the empirical results analysis and final section is the conclusion of the research.
Review of Literature
Globalization directed to corporate companies to make revolution in the business environment with intends to turn-up from unproductive to a customer-oriented economy. Accordingly, corporate companies vital to be establish efficient proposal of capital structure and to achieve maximum return over their capital investments. The decision on optimum stage mix up of debt and equity capital and firm’s financial performance is extremely influenced through the several factors; however, capital structure decision is foremost significant factor amongst others. Substantial empirical studies have been analysed and investigated regarding the relation between capital structure and companies’ financial performance and although previous researcher suggested different opinions. Consequently, the traditional theory of capital structure significantly emphasised that the optimum capital structure combination endorsed with a least weighted average cost of capital enable maximise the firms market value per share. However, merely leverage and debt-equity percentages are not deciding factors for the firm’s financial performance, since several factors can influence the capital structure and then company’s financial performance.
Furthermore, any variations with the quantity of equity or debt would reflect the firm’s market value. Firms intends to avoid tax burden and to obtain tax benefits over the debt capital utilization, firms can pick out option to borrow debt capital more so that attain higher financial performance with less cost of capital. In the opinion of earlier researcher (Merz & Yashiv, 2007; Cole & Mehran,1998) firm performance means firms total market value or else total of equity market value and value of equity options. Despite Allen et al (2007); Ang et al (2000); and Mehran (1995) stated that firms market value implies to greater than market capitalization. According to Pathak Rajesh (2011) described in his research that debt finance consists negative correlation with the firm’s financial performance. Also, Titman & Wessel (1998) revealed adverse correlation amongst firms’ size and short-term debts in their research but subsequently indicated a positive correlation amongst total debts of the firm and profits uncertainty, non-debt tax protections, tangibility, as well as companies’ growth prospects. In the view of Champion (1999); Gosh et al. (2000); Hadlock & James (2002) highlighted that those firms maintained better profitability make use of large level of debts. Moreover, Huang & Song (2006) verified in their investigation on Chinas firms explored adverse relation amongst firm’s capital structure decision and companies’ financial performance. Likewise, Ghosh (2007) examined through his research investigated opposite relation amongst leverage and profitability of the firms.
However, accordance with Ardalan (2018) confirmed that there is a dire need required to achieve an optimal capital structure to the corporate companies. In the opinion of Abor (2005) described an optimistic relationship amongst capital structure and assessed through the variables of Short-term debts (STD), Total debts (TD) as well as performance analysed during the periods from 1998 to 2002 designed for the Ghana firms. Also, research conducted by Rajan & Zingales (1995) indicated that profitability of the firm’s inverse relationship with leverage. Even supposing in the US and Japan firms also shaped an adverse relationship amongst capital structure and firm’s financial performance (Kester, 1986). In the research of Harris & Raviv (1991) investigated negative correlation between debt-equity and profitability of the firms as well identified similar results in growth opportunities and investment outflows. According to Ebaid (2009) explored there was no significant affect results identified amongst capital structure choices and firms’ performances. The research of Saedi & Mahmoodi (2011) established a significant relation amongst capital structure and firm’s performance and this research examined total sample size of 320 listed companies on Tehran stock exchange during the study period from 2002 to 2009. Finally, this research concluded that an adverse correlation amongst capital structure and Return on Assets (ROA), while study explored there was a negative association amongst Return on Equity (ROE) and firm’s capital structure.
Moreover, by and large recent empirical research strengthened that capital structure comprise mixed results on the financial performance of the firms. Omondi & Muturi (2013) confirmed that leverage of the firms involves a major adverse influence over the fiscal performance of the firms. Varun Dawar, (2014) empirical analysis of listed Indian companies during the period 2003-12 revealed that capital structure negatively impacted on the firm’s performance based on two accounting measures of financial performance by ROA, ROE. Anh & Thao, (2019), they investigated the impact of capital structure on firm’s performance of 446 listed on Vietnam stock exchange by using the ROE and Tobin’s Q revealed inversed U-shaped relationship between leverage and ROE. According to Roden & Lewellen (1995) empirical study investigated about the 48 US firm’s capital structure during the research from 1981 to 1990 as well as study determined that a constructive correlation amongst capital structure and company’s profitability. Besides, Arbiyan & Safari (2009) conducted research on 100 Iranian listed firms vis-à-vis result of capital structure on profitability during the research period from 2001 to 2007, so that inferences were drawn as short term debts(STD) and total debts(TD) indicated optimistic correlation through profitability of the firms, while inverse correlation reported amongst long term debts and Return on Equity (ROE) with the firm’s profitability. In the opinion of Umer, U.M(2014) revealed that there is a significant inverse correlation concerning capital structure and profitability of the firms.
Gill et al. (2011) found in their research a positive correlation amongst Short-term debts, Long-term debts, and Total debts over firm’s profitability. Additionally, this research of Gill, et., (2011) categorised their sample into two types namely: manufacturing and service companies and they examined that a constructive correlation amongst Short-term debts and Long-term debts on Return on Assets (ROA) of manufacturing and service sector. In accordance with Frank & Goyal (2009) investigated a positive correlation amongst financial leverage with actuality of the firms, whereas they found contrary correlation amongst financial leverage and construct development scenario with profitability of the firms. According to Dogan (2013) explored results of the firm size on profitability on listed 200 firms of Istanbul Stock Exchange and data collected from 2008 to 2011 years, furthermore, investigated that firm size and liquidity certainly associated with the profitability and this calculated by ROA, whereas firm’s size negatively associated with the profitability.
In the opinion of Issa (2013) investigated about the organisation features on firm’s financial performance on listed under agricultural sector of the Nairobi Securities Exchange, he confirmed that variables can be represent the firm’s characteristics but liquidity substantially influence over financial performance by agriculture firms it was calculated by ROA. Salim & Yadav (2012) conducted research on listed 237 companies on Bursa Malaysia Stock exchange and used different sectors during the years 1995 to 2011 and they were investigated the relationship amongst firm performance and capital structure. This research employed four financial performances and five capital structure variables along with the control variables, the study results showed that a mixed relationship amongst firm performance and capital structure. According to research of Hasan et al. (2014) analysed the relationship between firm’s performance and capital structure calculated by ROE and Tobin’s Q and subsequently, the research results once again showed negatively impacts on firm’s financial performance. Jain & Karmakar (2018) empirically analysed regarding modern capital structure theories validity in explaining capital structure of the Indian Service Sector companies and they used 57 Indian service sector company’s panel data during the period 2004-15.
III.Objectives of the Study
The prime intention of the research is to explore empirically through the capital structure decision impact on financial performance of the BSE 100 Indian listed companies. Most of the research conducted on the determinants of capital structure of firm’s but extremely limited numbers of research investigated the influence of capital structure on firm’s performance. Though, adequate research studies have not been obtained in Indian context. Therefore, main objective of the research is to investigate the relationship amongst capital structure and firm’s performance of listed manufacturing companies on BSE 100.The study constitute the following specific secondary objectives also been framed to achieve the main objective of the research.
1. To assess the strength of association amongst capital structures and company’s performance.
2. To investigate the relationship amongst capital structures and explanatory variables of financial performance.
3. To investigate the optimal capital structure of manufacturing companies on listed BSE 100 companies and analyze which can support to firms to achieve maximum performance.
Tests of Hypotheses
The study explores the objectives of the research using static effects models and examines the associations amongst dependent variables, independent variables, and control variables. The research intends to investigate the impact of capital structure on companies’ financial performance is the significant subject for discussion. Previous, empirical verification has revealed the mixed results with regards to debt financing adding optimistic or pessimistic value to companies. Therefore, following hypotheses is framed for this research to investigate the relationship amongst capital structure and companies’ financial performance of manufacturing categories of BSE 100 Companies.
Ho1: Examine the significant relationship amongst capital structure variables and financial performance of BSE 100 Companies.
Ho2: Investigates the substantial relationship amongst capital structures and financial performance measured by Return on Equity (ROE) of BSE 100 Companies.
Ho3: Investigates the extensive relationship amongst capital structures and financial performance measured by Return on Assets (ROA) of BSE100 Companies.
Ho4: Investigates the significant relationship amongst capital structures and financial performance measured by Earnings per Share (EPS) of BSE100Companies.
Ho5: Study the significant relationship amongst capital structures and financial performance measured by Tobin’s Q of BSE 100 companies.
Research Methodology and Data Analysis
Sample and Data Sources
The study adopted empirical research for the manufacturing companies on the listed of BSE 100 companies and data are examined from 2014 to 2019 financial periods. Sample companies are categorised into 23 sectors and which are operates in the BSE indexed in the manufacturing and service sectors. The data source built on the electronic data and which has developed and maintained through the Centre for Monitoring Indian Economy (CMIE). The research considered aggregately 100 companies and eliminated financial company’s information due to financial practices are different from others. Consequently, the sample size concentrated over the 84 manufacturing companies and covers all most all the major sectors.
Measures of Financial Performance and Variables
The research evaluates the comprehensive data to investigate the company’s performance based on capital structures. The research broadly based on the dependent, independent and control variables as follows.
Dependent Variables
Most of the literature recommended such type of analysis for the firm’s performance and explore the relationship with capital structure. These measures include accounting ratios and obtained from financial statements of the companies. The study considered dependent variables for analysis are: Return on Equity (ROE), Return on Assets (ROA), Earning per Share (EPS) Tobin’s Q and Sales Growth (SGRTH).
Independent Variables or Financial Leverage
The present research also considers independent variables to measure the implication of capital structure on company’s performance. Therefore, independent variables are: Short-term debt Ratio (STDR), Long-term debt Ratio (LTDR), Total debts (TDR) and Debt to Equity Ratio.
Control Variables
To investigate the association between capital structure and firm’s performance, included control variables to correspond to firms and industry related elements. Earlier researcher suggested such type of control variables to measure firm’s performance Jermias, (2008); Rao et al. (2007); Zeitun & Tian (2007); Frank & Goyal, (2003) and Ramaswamy (2001). The study administrates the variances in firm’s operating circumstances with adding SIZE variable in the research model. Also, perimeter specification bias in the research model reflects controlling variables such as Firms Age, Tangibility and Liquidity.
Variables Measurement: Financial Performance
According to review of literature different variables are considered for measurement of financial performance of companies. But, In the opinions of Majumbar & Chhibber, (1999); Abor, (2005); Saedi & Mahmoodi, (2009); Ebaid, (2009); Salim & Yadav,(2012); Varun Dawar, (2014) Nguyen Thuy Anh & Thi Phuong Thao, (2019) recommended for financial performance by the measurement of companies like Return on Assets (ROA), Return on Equity (ROE), EPS, Tobin’s Q, Short-term debts ratio (STDR), Long-term debts ratio (LTDR), Total debts ratio (TDR), Debt to Equity Ratio, Sales growth (SGRTH) and Company Size (SIZE) are calculated based on accounting data, so that financial performance can measure based on the financial statements of companies. The research used explicit variables for measurement and analyses of financial performance of the companies based on the explanatory variables presented below Table 1.
| Table 1 Variables Measurement: Financial Performance | |||
| S.NO | Name of the Variable | Description | Equation |
| 1. | Return on Equity (ROE) | Return on Equity is estimated based on Net profit items divided by total equity items obtained from the balance sheet | 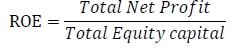 |
| 2. | Return on Assets (ROA) | Return on Assets is estimated based on Net profit divided by the total assets obtained from the balance sheet | 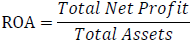 |
| 3. | Earnings per Share (EPS) | Earnings per share is estimated based on total net profit divided by aggregate quantity of outstanding shares | 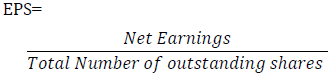 |
| 4. | Tobin’ s Q | Tobin Q is estimated based on total debts and quoted market value of equity shares divided by book value of total assets | 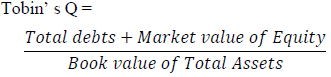 |
| 5. | Short term debts Ratio (STDR) | Short-term debts are calculated by Short-term debts divided by Total assets |  |
| 6. | Long-term debts Ratio (LTDR) | Long-term debts are calculated by Long term debts to Total assets |  |
| 7. | Total Debts Ratio (TDR) or Leverage (LEV) | Total debts are calculated by Total debts divided by total assets |  |
| 8. | Debt to Equity Ratio | Debt to Equity Ratio is calculated by Total liabilities divided by Total shareholders’ Equity |  |
| 9. | Sales Growth (SGRTH) | Sales growth of the companies is estimated based on present year sales minus previous year sales divided by previous year sales | 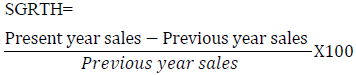 |
| 10. | Firm Size (SIZE) | Firm Size is estimated based on common log of total assets divided by common log of sales | 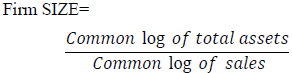 |
| 11. | Firm Age | Length of time of a Company is estimated as time between public and the present time. | The difference between business commencement periods to present period. |
| 12. | Tangibility (TANG) | Tangibility is estimated as the fixed assets divided by total assets. | 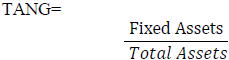 |
| 13. | Liquidity (LIQ) | Liquidity is estimated as the current assets divided by current liabilities | 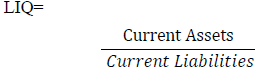 |
Research Methodology
The study setting up a cylinder panel data from secondary sources and which are measurable in nature intended for examined observations. Regression methodology to examine the relationship amongst capital structure characteristics and financial performance and it can obtain systematic variances amongst the companies for example compared to OLS regression methodology and which adopts that model limitations remain constant for the businesses. The study employed panel data regression methodology and constitute three types they are: Pooled OLS, Fixed Effect Methodology (FEM) and Random Effect Methodology (REM). Besides, the study employed the descriptive statistics, Pearson’s correlation analysis used to examine the impact of capital structure on financial performance. However, FEM model consider the individuality of each company or cross-sectional components involved in the sample with explanation of differences with each company but then again undertakes the slope coefficients are constant diagonally over all companies. REM is conceptually different from the FEM and undertakes that when the variables are not associated with each other, consequently, apply random effects in the case of regression execution.
On the other hand, to take decision regarding either to use FEM or REM for the designed data, Hausman test conducted and which is relevant to distribute as chi-squared and it is drew on the exercise principle. The Hausman test is accepted the null hypothesis then there should be apply REM. While the null hypothesis is rejected and hence apply FEM. Therefore, the study formulated additional hypothesis to determine the data authentication.
Ho: There is no relationship amongst the capital structure and the explanatory variables.
H1: There is exists a relationship amongst the capital structure and the explanatory variables.
The inferences were drawn from the Hausman test in our study (See Table 2) accept the null hypothesis because p-value more than the 0.05 significance level, therefore, REM is supporting in all the cases over FEM.
| Table 2 Hausman Test Results |
| Hausman Test |
| Description Model 1: ROE Chi Square-Statistic 6.3045** Probability 0.7091 |
| Description Model 2: ROA Chi Square-Statistic 11.108** Probability 0.2684 |
| Description Model 3: EPS Chi Square-Statistic 1.199** Probability 0.9988 |
| Description Model 4: Tobin’s Q Chi Square-Statistic 52.661** Probability 3.389 |
Research Model
The study constructed based on empirical research, there is a dire need required to establish linkages between theoretical illustrative variables and genuine explanatory variables for the study. To prove study hypotheses and such a selection of variables intensity can be validated for research model is to be examine. Furthermore, to investigate the non-linear association amongst capital structure and company’s financial performance, this research used panel data model supported by the previous research of Salim & Yadav (2012); Margaritis & Psillaki (2010) and Berger an Bonaccorsi di Patti (2006). The regression equations designed to examine for the company’s performance and the research models as follows:
ROE1,t (financial performance) = β0 + β1 STDR1, t + β2LTDR1, t + β3TDR1, t+ β4DTE1, t+ β5Z it+ u1,t…………………………………………………………………………….(1)
ROA1,t (financial performance) = β0 + β1 STDR1, t + β2LTDR1, t + β3TDR1, t+β4DTE1, t+ β5Z it+ u1,t………………………………..………..……………..…………. (2)
EPS1,t (financial performance) = β0+β1 STDR1, t+ β2 LTDR1, t + β3TDR1, t+β4DTE1, t+ β5Z it+ u1, t……………………………………………………..…………….(3)
Tobin Q1,t (financial performance) = β0+β1 STDR1, t+ β2 TDR1, t+ β3LTDR1, t+β4DTE1, t+ β5Z it+ u1,t…………………………………………………………….……..(4)
Where:
STDR1, t = Short term debts to Total assets for company 1 during period t
LTDR1, t = Long term debts to Total assets for company 1 during period t
TDR1, t = Total debts to Total assets for company 1 during period t
DTE1,t = Total debts to Equity for company 1 during period t
Z it = Vector of control Variables
β0 = Constant
u1, t = The error term
Empirical Results Analysis: Descriptive Statistics
Table 3 represent for descriptive statistics and this section considered previous vis-à-vis four dependent variables they are ROE, ROA, EPS, Tobin’s Q and Sales Growth whereas STDR, LTDR, TDR, and Debt to Equity Ratio were considered as independent variables. The study used the of list of BSE 100 companies based on free glide capitalization method and which represents near about 85% of the free glide market capitalization of BSE 100 and sample presented in Table 3. The all-inclusive companies are categorised into 23 sectors. As per as Pharmaceutical companies are signified 11.90% and followed by Automobile and Software companies are 9.52%. As a result of Consumer Non-Durables reported by 5.95%. Furthermore, Petroleum Products and Cement companies are together registered by 4.76% and followed by Chemicals, FMCG, Pesticides, Ferrous Metals, Power, Transportation & Logistics, Consumer Goods and Engineering & Electronics Conglomerate are shown by 3.57%. Then the other remain sectors are Media & Entertainment, Minerals/Mining, Oil & Gas, Telecom-Services, Telecom - Equipment & Accessories, Construction Project, Biotechnology and Alcoholic beverage represented by 2.38%.
| Table 3 Companies Categories by Business Sector | ||
| S.NO | Industry Sector | Percentage |
| 1 | Automobile | 9.52 % |
| 2 | Software | 9.52 % |
| 3 | Petroleum Products | 4.76 % |
| 4 | Non - Ferrous Metals | 5.95 % |
| 5 | Media & Entertainment | 2.38 % |
| 6 | Minerals/Mining | 2.38 % |
| 7 | Oil & Gas | 2.38 % |
| 8 | Telecom-Services | 2.38 % |
| 9 | Chemicals | 3.57 % |
| 10 | Consumer Non-Durables | 5.95 % |
| 11 | FMCG | 3.57 % |
| 12 | Pesticides | 3.57 % |
| 13 | Pharmaceuticals | 11.90 % |
| 14 | Ferrous Metals | 3.57 % |
| 15 | Power | 3.57 % |
| 16 | Cement | 4.76 % |
| 17 | Transportation & Logistics | 3.57 % |
| 18 | Telecom - Equipment & Accessories | 2.38 % |
| 19 | Construction Project | 2.38 % |
| 20 | Consumer Goods | 3.57 % |
| 21 | Engineering & Electronics Conglomerate | 3.57 % |
| 22 | Biotechnology | 2.38 % |
| 23 | Alcoholic beverage | 2.38 % |
| Total | 100 % | |
Table 4 represents the results of descriptive statistics of the dependent, independent and control variables employed in the present study. The descriptive statistics revealed by minimum, maximum, mean, standard deviation, Skewness and Kurtosis. First and foremost, results of mean of ROE, ROA, EPS, and Tobin’s Q are 19.524, 0.142, 47.165 and 3.883, respectively. While mean of capital structure like STDR, LTDR,TDR and Debt to Equity ratios reported that are 0.291, 0.139, 0.568 and 67.131 respectively, the inference are drawn from the results of the BSE 100 companies are revealed that Short-term debt Ratio(STDR) and Long-term debt Ratio(LTDR) are a lesser amount of utilised. Moreover, Skewness results revealed by BSE 100 companies are using 8.729% of Total debt financing against their assets. This scenario indicates that they are extremely a smaller amount of risky situation and recommended that there is a dire need to encourage companies to expand their business by way of obtaining additional sources of debts to enhance their market capitalisation. However, companies incorporated date and nature of the business are unique (Table 4).
| Table 4 Descriptive Statistics Analysis | ||||||
| Explanatory Variables | Minimum | Maximum | Mean | Std. Deviation | Skewness | Kurtosis |
| ROE | -40.155 | 285.000 | 19.524 | 39.544 | 5.071 | 29.651 |
| ROA | -0.216 | 1.146 | 0.142 | 0.131 | 2.668 | 14.864 |
| EPS | -356.60 | 753.370 | 47.165 | 85.480 | 3.967 | 28.818 |
| Tobin’s Q | 0.133 | 374.748 | 3.883 | 27.653 | 10.83 | 128.465 |
| STDR | 0.0007 | 1.124 | 0.291 | 0.163 | 1.598 | 4.279 |
| LTDR | 0.0006 | 0.687 | 0.139 | 0.156 | 1.373 | 0.962 |
| TDR | -8.683 | 23.078 | 0.568 | 1.767 | 8.729 | 105.191 |
| SGRTH | -57.200 | 183.770 | 10.462 | 19.928 | 2.929 | 23.748 |
| SIZE | 0.193 | 13292.00 | 64.975 | 828.101 | 14.641 | 225.136 |
| TANG | 0.000 | 1612.000 | 5.734 | 93.048 | 17.320 | 299.997 |
| LIQ | 0.000 | 110.407 | 3.889 | 13.003 | 7.151 | 52.073 |
| Debt to Equity | 0.757 | 4232.000 | 67.131 | 250.686 | 15.483 | 256.993 |
| Firm Age | 10.000 | 195.000 | 59.316 | 34.0329 | 1.539 | 3.179 |
Correlation and Ramsey Regression Equation Specification Error Test(Reset) Results: Hypothesis 1
The correlation analyses specify the relationship amongst capital structure and company’s performance. Moreover, Pearson’s correlation analysis is employed to determine the associates amongst the company’s performance and company’s explicit variables for the entire period to examine the data authentication. Table 5 represent the pair wise Pearson’s correlation matrix along with the Collinearity Statistics amongst expressive and dependent variables. Variance Inflation factor (VIF) values confirm that there is no multicollinearity issue amongst explanatory variables because all the variables values are appropriate and acceptable limits less than five (VIF>5). Moreover, results of Pearson’s correlation analysis confirmed that it does not arose multicollinearity question due to the maximum coefficient of correlation is 0.742.
| Table 5 Correlation Coefficients and Collinearity Statistics Analysis | |||||||||||||||
| ROE | ROA | EPS | Tobin’s Q | STDR | LTDR | TDR | SGRTH | SIZE | TANG | LIQ | Debt to Equity | Firm Age | Collinearity Statistics | ||
| Tolerance | VIF | ||||||||||||||
| ROE | 1.000 | 0.889 | 1.125 | ||||||||||||
| ROA | 0.276** | 1.000 | 0.777 | 1.287 | |||||||||||
| EPS | 0.219** | 0.336** | 1.000 | 0.412 | 2.428 | ||||||||||
| Tobin’s Q | 0.116* | 0.313** | 0.742** | 1.000 | 0.419 | 2.387 | |||||||||
| STDR | -0.040 | 0.122* | 0.133* | 0.211** | 1.000 | 0.848 | 1.179 | ||||||||
| LTDR | -0.185** | -0.303** | -0.104 | -0.060 | -0.062 | 1.000 | 0.908 | 1.102 | |||||||
| TDR | -0.013 | -0.071 | -0.019 | 0.005 | 0.088 | 0.120* | 1.000 | 0.976 | 1.025 | ||||||
| SGRTH | 0.006 | 0.044 | 0.021 | 0.001 | -0.078 | -0.12 | -0.033 | 1.000 | 0.969 | 1.032 | |||||
| SIZE | 0.025 | -0.019 | 0.107 | -0.007 | -0.057 | 0.016 | -0.010 | 0.028 | 1.000 | 0.994 | 1.006 | ||||
| TANG | -0.013 | 0.028 | 0.006 | 0.032 | -0.036 | -0.050 | -0.012 | 0.010 | -0.004 | 1.000 | 0.994 | 1.006 | |||
| LIQ | 0.119* | 0.077 | -0.065 | -0.023 | -0.118* | -0.130* | -0.044 | -.025 | -0.011 | 0.001 | 1.000 | 0.930 | 1.075 | ||
| Debt to Equity | 0.060 | 0.048 | 0.007 | -.0027 | 0.022 | 0.153** | 0.038 | 0.128* | 0.020 | -0.013 | -0.037 | 1.000 | 0.975 | 1.026 | |
| Firm Age | -0.065 | -0.008 | -0.058 | 0.029 | 0.333** | -0.211** | 0.018 | -0.076 | 0.017 | -0.038 | 0.161** | -0.014 | 1.000 | 0.818 | 1.222 |
*. Correlation is significant at the 0.05 level (2-tailed).
According to the correlation analysis revealed that there is a negative correlation ship amongst ROE and STDR, LTDR and TDR by -0.040, -0.185, and -0.013 respectively. While ROE and Debt to Equity indicated positive relationship by 0.060. Besides, ROA and EPS indicated negative relationship with LTDR and TDR but, STDR reported positive relationship. Moreover, Tobin’s Q has revealed strong negative relationship with the LTDR, SIZE, Liquidity and Debt to Equity even though those other variables such as STDR, TDR, SGRTH, TANG and Firm Age indicated positive correlation. On the contrary, there is a maximum negative correlation amongst Firm Age and financial performance, and which specified that the impact of Firm Age on the company’s financial performance is not important. Furthermore, the study conducted Ramsey RESET test (Table 6) for examine misspecification for the research model and the results confirmed that there is a linearity in the regression equations except description Model 3: EPS since probability value is less than 5 (Table 5 & Table 6).
| Table 6 Ramsey Regression Equation Specification Error Test (Reset) |
| RESET test |
| Description Model 1: ROE RESET 25.274 Probability 7.713 |
| Description Model 2: ROA RESET 2.366 Probability 0.095 |
| Description Model 3: EPS RESET 5.927 Probability 0.003 |
| Description Model 4: Tobin’s Q RESET 14.974 Probability 6.504 |
Regression Analysis Results: Hypothesis 2
As conferred earlier sample size taken BSE 100 companies has divided into twentythree sub sectors of the listed-on BSE 100 companies. Table 7 represents the regression results of hypothesis-2 testing vis-à-vis the association amongst Return on Equity (ROE) and independent and control variables of capital structure namely: STDR, LTDR, TDR, SGRTH, SIZE,TANG, LIQ, Debt to Equity and Firm Age.Regression analysis of BSE 100 companies, TDR, SIZE, LIQ and Debt to Equity has a positive association in relation to the financial performance of the companies evaluated by ROE. This indication is supported with the results (Roden & Lewellen,1995, Ghosh et al.,2000; Margaritis & Psillaki, 2007; Abor, 2005) revealed positive impact of capital structure on financial performance of the companies.
| Table 7 Regression Results of Capital Structure and Financial Performance Measured by Return on Equity (ROE) | |||||
| Explanatory Variables | Coefficient | Std. Error | t-Statistics | Prob. | |
| STDR | -0.097 | 14.906 | -0.006 | 0.994 | |
| LTDR | -54.865 | 15.061 | -3.642 | 0.000 | |
| TDR | 0.365 | 1.284 | 0.284 | 0.776 | |
| SGRTH | -0.032 | 0.114 | -0.283 | 0.777 | |
| SIZE | 0.001 | 0.002 | 0.534 | 0.593 | |
| TANG | -0.011 | 0.024 | -0.474 | 0.635 | |
| LIQ | 0.353 | 0.178 | 1.975 | 0.049 | |
| Debt to Equity (DTE) | 0.015 | 0.009 | 1.665** | 0.096 | |
| Firm Age | -0.152 | 0.072 | -2.096 | 0.036 | |
| R 0.263 | F-statistic 2.3955 | ||||
| R Square 0.069 | Durbin-Watson test 0.45754 | ||||
| Adjusted R Square 0.040 | Akaike information criterion 3057.307 | ||||
| Standard Error of Regression 38.739 | Schwarz’s Bayesian Criterion 3098.049 | ||||
On the other hand, STDR, LTDR, SGRTH, TANG, and Firm Age were reported negative relationship and suggestively impacted on the financial performance of the companies. Moreover, inferences were drawn from statistical analysis of R=0.263; R Square= 0.069 and Adjusted R square= 0.040 were reported positive correlation with the financial performance of the companies. Statistical results confirmed that the independent variables cannot explain the dependent variables. The major reasons beyond that constituted of the adverse association because the companies are facing challenges through the non-payment financial risk because of higher loan. Finally, conclusion drawn from this evaluation for the entire sectors development indicated significantly negative association with the financial performance evaluated by ROE. The relationship amongst variables can be illustrated in a regression equation of research model 1 as follows and (Table 7).
ROE1, t = β0 + β1 STDR1, t +β2 LTDR 1, t + β3 TDR1, t + β3 SGRTH1, t + β4 SIZE1, t+ β5 TANG1, t+β6LIQ1,t+β7DTE1,t+β8FirmAge1,t+u1,t……………………………………………………….(1)
Regression Results: Hypothesis 3
Table 8 represents the results of hypothesis 3 testing vis-à-vis the relationship between Return on Assets (ROA) and substantial independent variables of capital structure of Short term debts to total assets, Long term debts to total assets, Total debts to total assets and together with SGRTH, SIZE, TANG, LIQ, Debt to Equity and Firm Age. Results of regression analysis of BSE 100 companies, LTDR and TDR, SIZE and Firm Age indicated a substantial negative relationship relating to the financial performance evaluated by ROA. Whereas the coefficient results at 5% by the other independent and control variables of STDR, SGRTH, TANG, LIQ and Debt to Equity indicated a significant positive relationship with the Return on Assets (ROA).The inferences reveled mixed relationship with the capital structure and financial performance measured by the ROA, this evidence is in conflicted with the results of (Rajan & Zingales,(1995); Zeitun & Tian,(2007); Arbiyan & Safari,(2009); Salim & Yadav,(2012) and Saputra et al. 2015).
| Table 8 Regression Results of Capital Structure and Financial Performance Measured by Return on Equity (ROA) | |||||
| Explanatory Variables | Coefficient | Std. Error | t-Statistics | Prob. | |
| STDR | 1.297 | 4.798 | 2.704 | 0.007 | |
| LTDR | -2.695 | 4.848 | -5.558 | 6.163 | |
| TDR | -3.232 | 4.133 | -0.782 | 0.434 | |
| SGRTH | 2.026 | 3.673 | 0.551 | 0.581 | |
| SIZE | -6.962 | 8.737 | -0.079 | 0.936 | |
| TANG | 1.879 | 7.772 | 0.241 | 0.809 | |
| LIQ | 7.961 | 5.751 | 1.384 | 0.167 | |
| Debt to Equity (DTE) | 4.852 | 2.940 | 1.650 | 0.099** | |
| Firm Age | -5.297 | 2.345 | -2.258 | 0.024 | |
| R 0.364 | F-statistic 4.930 | ||||
| R Square 0.132 | Durbin-Watson test 0.69173 | ||||
| Adjusted R Square 0.105 | Akaike information criterion- 385.924 | ||||
| Standard Error of Regression 0.124 | Schwarz’s Bayesian Criterion -345.182 | ||||
The results confirm that STDR has not consisted significant relationship to the ROA of BSE 100 companies in India. Further, implications are drawn from statistical analysis of R= 0.364; R Square =0.132 and Adjusted R Square= 0.105 indicated a significant positive relationship with the financial performance of Return on Assets (ROA) associated with capital structure of the companies. Finally, concluded from this investigation of entire business sectors development indicated tremendous optimistic connection with the financial performance evaluated by ROA. This phenomenon shows that companies will undergo lesser profitability as the quantity of debt they make use of increase. The relationship amongst variables can be illustrated in a regression equation of research model 2 as follows and (Table 8).
ROA1, t = β0 + β1 STDR1, t +β2 LTDR 1, t + β3 TDR1, t + β3 SGRTH1, t + β4 SIZE1, t+ β5 TANG1, t +β6LIQ1,t+β7DTE1,t+β8FirmAge1,t+u1,t……………………………………………………….(2)
Regression Results: Hypothesis 4
Table 9 represent the results of hypothesis 4 testing vis-à-vis the relationship amongst Earnings per share (EPS) and independent and control variables of BSE 100 companies in India. Financial performance measured by EPS with the variables of STDR, LTDR, TDR, SGRTH, SIZE, TANG, LIQ, Debt to Equity and Firm Age. LTDR, TDR, LIQ and Firm Age reported a significant negative relationship at level of 5% of confidence regarding the financial performance measured by EPS. Therefore, it is confirmed that the financial performance of the BSE 100 companies influenced by the capital structure of LTDR, TDR because which recommended that increase in long-term debts and total debts, which obviously decrease the profitability of the companies.
| Table 9 Regression Results of Capital Structure and Financial Performance Measured by Earning Per Share (EPS) | |||||
| Explanatory Variables | Coefficient | Std. Error | t-Statistics | Prob. | |
| STDR | 9.227 | 3.236 | 2.851 | 0.004 | |
| LTDR | -7.045 | 3.270 | -2.154 | 0.032 | |
| TDR | -8.123 | 2.787 | -0.291 | 0.770 | |
| SGRTH | 6.994 | 2.477 | 0.282 | 0.777 | |
| SIZE | 1.243 | 5.893 | 2.110 | 0.035 | |
| TANG | 5.635 | 5.242 | 0.010 | 0.991 | |
| LIQ | -2.399 | 3.879 | -0.618 | 0.536 | |
| Debt to Equity (DTE) | 5.377 | 1.983 | 0.271 | 0.786 | |
| Firm Age | -3.480 | 1.582 | -2.200 | 0.028 | |
| R 0 .247 | F-statistic 2.096 | ||||
| R Square 0.061 | Durbin-Watson test 1.513 | ||||
| Adjusted R Square 0.031 | Akaike information criterion 3522.43 | ||||
| Standard Error of Regression 84.104 | Schwarz’s Bayesian Criterion 3563.171 | ||||
However, results of STDR, SGRTH, SIZE, TANG and Debt to Equity indicated a significant positive relationship with the financial performance measured by Earning per share (EPS). Besides, inferences were drawn from statistical analysis of R=0.247; R Square =0.061; and Adjusted R Square=0.032 has a positive relationship with the financial performance measured by Earning per share (EPS) and associated with capital structure of the companies. Furthermore, determined from this regression analysis of all sectors sales growth indicated positive relationship with the business performance evaluated by EPS. The relationship amongst variables can be illustrated in a regression equation of research model 3 as follows and (Table 9).
EPS1, t = β0 + β1 STDR1, t +β2 LTDR 1, t + β3 TDR1, t + β3 SGRTH1, t + β4 SIZE1, t+ β5 TANG1, t +β6LIQ1,t+β7DTE1,t+β8FirmAge1,t+u1,t……………………………………………………….(3)
Regression Results: Hypothesis 5
Table 10 represent the results of hypothesis 5 testing vis-à-vis the relationship amongst Tobin’s Q and independent and control variables of capital structure measured by STDR, LTDR, TDR, SGRTH, SIZE, TANG, LIQ, Debt to Equity and Firm Age. The regression analysis results indicated by STDR, SGRTH,SIZE,TANG and LIQ has reported a significant positive relationship at level of 5% of confidence relating to the financial performance evaluated by Tobin’s Q. Whereas it is investigated that the financial performance of the BSE 100 companies strongly influenced by the capital structure of LTDR, TDR, Debt to Equity and Firm Age were reported a negative relationship. This phenomenon suggested that when increase in long-term debts and total debts the results of the financial performance of the companies comes down.
| Table 10 Regression Results of Capital Structure and Financial Performance Measured by Tobin’s Q | |||||
| Explanatory Variables | Coefficient | Std. Error | t-Statistics | Prob. | |
| STDR | 39.168 | 10.521 | 3.722 | 0.000 | |
| LTDR | -8.977 | 10.630 | -0.844 | 0.399 | |
| TDR | -0.096 | 0.906 | -0.106 | 0.915 | |
| SGRTH | 0.022 | 0.080 | 0.284 | 0.776 | |
| SIZE | 0.000 | 0.001 | 0.138 | 0.890 | |
| TANG | 0.010 | 0.017 | 0.612 | 0.540 | |
| LIQ | 0.013 | 0.126 | 0.1078 | 0.914 | |
| Debt to Equity (DTE) | -0.002 | 0.006 | -0.445 | 0.656 | |
| Firm Age | -0.047 | 0.051 | -0.914 | 0.361 | |
| R 0.228 | F-statistic1.758 | ||||
| R Square 0.051 | Durbin-Watson test1.032 | ||||
| Adjusted R Square 0.022 | Akaike information criterion2848.27 | ||||
| Standard Error of Regression 27.343 | Schwarz’s Bayesian Criterion 2889.012 | ||||
Furthermore, inferences were drawn from statistical analysis of R=0.228; R Square =0.0517 and Adjusted R square=0.022 indicated a significant positive relationship with the financial performance evaluated by Tobin’s Q associated with capital structure of the companies. In addition, implications from this investigation of entire business sectors sales growth specified optimistic association with the financial performance. However, in the case of Firm Age of the BSE 100 companies stated a significant negative relationship evaluated by Tobin’s Q. The relationship amongst variables can be illustrated in a regression equation of research model 4 as follows and (Table 10).
Tobin’s Q1, t = β0 + β1 STDR1, t +β2 LTDR 1, t + β3 TDR1, t + β3 SGRTH1, t + β4 SIZE1, t+ β5 TANG1, t +β6LIQ1,t+β7DTE1,t+β8FirmAge1,t+u1,t……………………………………………….(4)
Findings and Conclusion
The study investigated capital structure decision of Indian companies listed on BSE 100 companies and influence on financial performance throughout the period of 2014-19 to understand the financing behaviour. The hypotheses framed to determine the relationship amongst short-term debts ratios (STDR), long-term debts ratios (LTDR) total debts ratios(TDR), Debt to Equity, sales growth (SGRTH), firms SIZE, tangibility(TANG), liquidity(LIQ) and Firm Age to applied by four accounting approaches measures of ROE, ROA, EPS and Tobin’s Q to analyse company’s financial performance. Furthermore, the study was examined exploratory independent variables able to explain capital structure of Indian companies. Administration of capital structure plays vital role in companies financing decision, with the intention of its required harmonizing activities. The business transaction of companies establishes financial flexibility and financial discipline to regulate company’s capital structure and to attain tax benefits, but these phenomena become very insignificant in most of the corporate sectors if they maintain tremendously low level of debts. The study absorbed with regards Indian economy and covered prospect of 5 years covering impact of economy recession on financial performance.
The study empirical investigation revealed that capital structure specifically STDR and LTDR impacted negatively measured by Return on Equity (ROE), this coherent phenomenon stated by Ebaid (2009) in his research document. In addition, inferences of capital structure examined by LTDR and TDR registered a substantial adverse influence on financial performance evaluated by ROA and previous researcher also witnessed similar results by Zeitun & Tian (2007), Abor (2007) and Rajan & Zingales (1995) they notified about their selected company’s performance was report negatively associated with capital structure. While contradict results obtained by Berger & Bonaccora di Patti (2006), Frank & Goyal (2003), Hardlock & James (2002), Gosh, C etc. al (2000) and Champion (1999) they emphasised that on the subject of capital structure and financial performance of the companies indicated a positive correlation. As capital structure revealed by LTDR, TDR and liquidity (LIQ) had reported negative influenced on financial performance measured by EPS. Besides, the results notified by the Tobin’s Q had a momentous harmful correlation amongst the capital structure of LTDR, TDR and Debt to Equity with the financial performance of the BSE 100 companies. In addition, the results demonstrated by Tobin’s Q of STDR and sales growth (SGRTH) demonstrated optimistic and robust important association with companies’ financial performance. Nonetheless, the negative relationship amongst financial performance and Firms Age shown through Tobin’s Q.
Eventually, results of this research recommended about there is a diverse association amongst by Tobin’s Q financial performance and capital structure evaluated by STDR, TANG and liquidity (LIQ). Hence, the present study notified contradict results with the previous researcher’s study results consisted by Saedi & Mahmoodi suggested that an optimistic association amongst Tobin’s Q and capital structure evaluated by STDR. The study inferences reported that there is a significant optimistic association amongst Tobin’s Q financial performance and capital structure measured by STDR whereas a negative relationship with LTDR and TDR. Consequently, results found with the control variable of firms SIZE had no significant impact over the Tobin’s Q. The research found with the BSE 100 companies finance manager maximum utilized debt fiancé as an alternative source of finance for their operation instead of equity finance. Consequently, this tendency has a negative impact on the company’s financial performance.
Scope of the Future Research
Further research would be possible to be extending to financial sectors or small and medium sectors companies in consider data from diverse sample size on listed of BSE or NSE indexed companies of India. Furthermore, future research can be appropriate to compare and investigates the correlation amongst the maturity structure of the company’s debt finance to financial performance of the companies across in the Indian companies.
References
- Abor, J. (2005). The effect of capital structure on profitability: An empirical analysis of listed firms in Ghana. Journal of Risk Finance, Vol No. 6, 438-447.
- Arbabiyan, Ali-Akbar, Safari., & Mehdi. (2009). The effects of capital structure and profitability in the listed firms in Tehran Stock Exchange. Journal of Management Perspective, Vol No.33, 159-175.
- Ardalan, Kavous. (2018). Capital structure theory: Reconsidered. Research in International Business and Finance,Vol No.39, 696-710.
- Berger, A., & Bonaccorsi di Patti, E. (2006). Capital structure and firm performance: a new approach to testing agency theory and an application to the banking industry. Journal of Banking and Finance, Vol No.32, 1065-1102.
- Campbell, Gareth., & Meeghan Rogers. (2018). Capital structure volatility in Europe. International Review of Financial Analysis,Vol No.55,128-39.
- Chadha, S., & Sharma, A. K. (2015). Capital structure and firm performance: Empirical evidence from India. Vision, 19(4), 295-302.
- Champion, D. (1999). Finance: the joy of leverage. Harvard Business Review, Vol No.77, 19-22.
- Cole, R.A., & Mehran, H. (1998). The effect of changes in ownership structure on performance: Evidence from the Thrift Industry. Journal of Financial Economics, Vol No. 50(3), pp.291-317.
- Dogan, M. (2013). Does firm size affect firm profitability? Evidence from Turkey. Journal of Finance and Accounting, 4(4).
- Ebaid, E.I. (2009). The impact of capital structure choice on firm performance: empirical evidence from Egypt. The Journal of Risk Finance, 10(5), pp.477-487.
- Frank, M., & Goyal, V. (2003). Testing the pecking order theory of capital structure. Journal of Financial Economics, Vol No. 67, 217-248.
- Ghosh, C., Nag, R., & Sirmans, C. (2000). The pricing of seasoned equity offerings: Evidence from REITs. Real Estate Economics, Vol No.28, 363-84.
- Ghosh, S. (2007). Leverage, Managerial monitoring and firm valuation: A simultaneous equation approach. Research in Economics, Vol No.61(2), pp.84-98.
- Gill, A., Biger, N., & Mathur, N. (2011). The effect of capital structure on profitability: Evidence from the United States. International of Management, 28(4).
- Grossman, S., & Hart, O. (1982). Corporate financial structure and managerial incentive in McCall, J. (Ed.). The Economics of Information and uncertainty. University of Chicago Press, Chicago, IL.
- Hadlock, C., & James, C. (2002). Do banks provide financial slack? . Journal of finance, Vol No.57.1383-420.
- Harris, M., & A, Raviv. (1991). The theory of capital structure. Journal of finance, 46(2), 297-355.
- Hasan, H., Ahsan, A., Rahaman, M., & Alam, M. (2014). Influence of capital structure on firm performance: Evidence from Bangladesh. International Journal of Business and Management, Vol No. 9 (5), ISSN 1833-3850 E-ISSN 18338119.
- Huang, S., & Song, F. (2006). The determinants of capital structure: evidence from China. China Economic Review, Vol No.17(1), pp.14-36.
- Issa, M.O. (2013). Effect of selected firm characteristics on financial performance of firms listed in the agricultural sector at the Nairobi Securities Exchange. (Master’s Thesis, University of Nairobi, Nairobi, Kenya). Retrieved from: http://erepository.unonbi.ac.ke:8080/xmlui/handle.
- Jensen, M. (1986). Agency costs of free cash flow, corporate finance and takeovers.American Economic Review, Vol No.76, pp.323-39.
- Jensen,M.,& Meckling,W.(1976).Theory of the Firm: Managerial Behaviour, Agency Costs and Capital Structure. Journal of Financial Economics, Vol No.2, pp.305-360.
- Jermias, J. (2008). The relative influence of competitive intensity and business strategy on the relationship between financial leverage and performance. The British Accounting Review, Vol No .40, pp.71-86.
- Kester, W. (1986). Capital and ownership structure: a comparison of United States and Japanese manufacturing corporations. Financial Management, Vol No.15, 5-16.
- Kolluru Sarath Chandra., & S, Udhayakumar. (2018). Impact of Capital Structure on firm performance: Evidence from India. International Journal of Pure and Applied Mathematics, Volume 118, No 22, 955-959:1314-3395,http://acadpubl.eu/hub
- Majumbar, S., & Chhibber, P. (1999). Capital structure and performance: Evidence from a transition economy on an aspect of corporate governance. Public Choice, Vol No.98, 287-305.
- Mehran, H. (1995). Executive compensation structure, ownership, and firm performance. Journal of Financial Economics, Vol No.38(2), pp.163-184.
- Matreye Jain., & Yamini Karmakar. (2018). Capital Structure: An Empirical Study of Choices and Strategies for Indian Service Sector Companies. Indian Institute of Finance, Vol. XXXII, No.4, December 2018, pp.1227-1252.
- Myers, S. (2003). Financing of corporations, Handbooks of the Economics of Finance, Vol.1A, pp.216-253.
- Myers, S. (2001). Capital structure, Journal of Economic Perspectives, Vol.15, pp.81-102.
- Myers, S., & Majluf, N. (1984). Corporate financing and investment decision when firms have information that investors do not have. Journal of Financial Economics, Vol.13, pp,187-221.
- Anh., N.T., & Thao, TT.P. (2019). The impact of capital structure on firm performance of Vietnamese non-financial listed companies based on agency cost Theory. VNU Journal of Science: Economics and Business, 35(2), 24 -33.
- Margaritis, D., & Psillaki, M. (2007). Capital structure and firm efficiency. Journal of Business Finance and Accounting, 34, 1447-1469
- Modigliani, F., & Miller, M.H. (1958). The cost of capital, corporation finance and the theory of investment. American Economic Review, 48(3), 261-297.
- Modigliani, F., & Miller, M. (1963). Corporate income taxes and the cost of capital: A correction. American Economic Review, 53(3), 433-443.
- Salim., M., & Yadav, R. (2012). Capital structure and firm performance: Evidence from Malaysian listed Companies. Procedia- Social and Behavioural Sciences, 65, 156-166.
- Nunes, P.J.M., Serrasqueiro, Z.M., & Sequeira, T.N. (2009). Profitability in Portuguese service industries: A panel data approach. The Service Industries Journal, 25(5), 693-707.
- Omondi, M.M., & Muturi, W. (2013). Factors affecting the financial performance of listed companies at the Nairobi Securities Exchange in Kenya. Research Journal of Finance and Accounting, 4(15), 99-105.
- Pathak Rajesh. (2011). Capital structure and performance: Evidence from Indian Manufacturing firms. Social Science Research Network, Online Web.
- Rajan, Raghuram, G, Zingales., & Luigi. (1995). What do we know about capital structure? Some Evidence from International data. Journal of Finance, American Finance Association, 50(5), 1421-1460.
- Ramaswamy, K. (2001). Organizational ownership, competitive intensity and firm performance: an empirical study of the Indian manufacturing sectors. Strategic Management Journal, 22, 989-998.
- Rao, N.V., Al-Yahyaee, K.H.M., & Syed, L.A. (2007). Capital structure and financial performance: Evidence from Oman. Indian Journal of Economics and Business, 6(1), 1.
- Roden, D., & Lewellen, W. (1995). Corporate capital structure decisions: Evidence from leveraged buyouts. Financial Managements, 24, 76-87.
- Sadeghian,N.S., Latifi, M.M., Soroush, S., & Aghabagher, Z.T. (2012). Debt policy and corporate performance: empirical evidence from Tehran stock exchange companies. International Journal of Economics and Finance, 4(11). 217.
- Saeedi, A., & Mahmoodi, I. (2011). Capital structure and firm performance: Evidence from Iranian companies. International Research Journal of Finance and Economics,70, 21-28.
- Salim, M., & Yadav, R. (2012). Capital structure and firm performance: Evidence from Malaysian listed companies. Procedia-Social and Behavioural Sciences, 65, 156-166.
- Saputra, T., Achsani, N.A., & Anggraeni, L. (2015). The effect of capital structure on firm’s performance: empirical evidence from the Indonesian financial industry. International Journal of Business and Management Invention, 4 (8), 57-66.
- Titman, S., & Wessels, R. (1988). The determinants of capital structure choice. The Journal of Finance, 43(1), 1-19.
- Thomas, A.E. (2013). Capital structure and financial performance of Indian cement industry. BVIMR Management Edge, 6(2).
- Umer, U.M. (2014). Determinants of capital structure: Empirical Evidence from large taxpayer share companies in Ethiopia. International Journal of Economics and Finance, 6(1), 53-65.
- Varun Dawar. (2014). Agency theory, capital structure and firm performance: Some Indian evidence. Managerial Finance, 40(12).
- Zeitun, R., & Tian, G. (2007). Capital structure and corporate performance: Evidence from Jordan. Australasian Accounting Business and Finance Journal, 1, 40-53.