Research Article: 2021 Vol: 25 Issue: 5S
Does Companys Source of Capital Signal Increasing Company Value: A Case Study of Basic Industrial and Chemical Companies
Dirvi Surya Abbas, University of Sultan Ageng Tirtayasa
Tubagus Ismail, University of Sultan Ageng Tirtayasa
Muhamad Taqi, University of Sultan Ageng Tirtayasa
Helmi Yazid, University of Sultan Ageng Tirtayasa
Citation: Abbas, D.S., Ismail, T., Taqi, M., & Yazid, H. (2021). Does company's source of capital signal increasing company value: a case study of basic industrial and chemical companies. Academy of Accounting and Financial Studies Journal, 25(S5), 1-10.
Abstract
The purpose of this study was to determine the effect of Dividend Policy, Debt Policy, Capital Structure, and Liquidity on Firm Value. The independent variables used in this study are Dividend Policy, Debt Policy, Capital Structure, and Liquidity. While the dependent variable in this study is the company's value as measured by Tobin's Q. The population of this study is a Manufacturing Company in the Basic and Chemical Industry, which is listed on the Indonesia Stock Exchange (IDX) and publishes financial statements for the 2015 – 2019 period. The population is 80 companies using the purposive sampling method obtained eight samples of companies that meet the criteria, with 40 data observations. This study uses panel data regression analysis with the help of the Eviews 9.0 program. The results of this study indicate that, partially, debt and liquidity policies hurt firm value. Meanwhile, Dividend Policy and Capital Structure do not affect Firm Value.
Keywords
Company Value, Dividend Policy, Debt Policy, Capital Structure, Liquidity.
Introduction
Management of a large, small, private or state-owned enterprise is constantly building a strategy that is supposed to ensure financial security and profits for the owners (Zimon, 2020). The development of the manufacturing industry in Indonesia is proliferating in the current industrial era. It can be seen from the increasing number of manufacturing companies listed on the IDX from year to year. These two elements of financial liquidity and profitability are one of the most important measures of the company’s position in the market (Zimon, 2020). Competition in today's business world requires every company to improve its performance further to achieve its goals. The better the company's performance, the more attractive it is to investors (Driver, 2020). Many investors are currently looking at manufacturing companies in Indonesia because the growth rate in this sector is proliferating from year to year (Mesrawati et al., 2021). Firm value is an investor's perception of the company's level of success which is often associated with stock prices (Sumani, 2020). High stock prices make the company's value also high and increase market confidence in the company's current performance and the company's prospects in the future (Nguyen, 2020; Zimon, 2018). Potential investors will consider poor financial performance because this will affect the value of the company (Kumar, 2020). If the company's condition is terrible, investors lose confidence in its business prospects and choose to withdraw their funds (Dewi et al., 2021). The existence of value creation and the creation of welfare for shareholders, and market valuation are the most critical problems the company faces (Zimon & Zimon, 2019). Financial statements that explain book value do not describe the actual financial condition of the company (Renneboog, 2020). Thus the estimated value has a vital role in the company's environment.
The level of dividends distributed by the company can affect stock prices because investors prefer returns from dividends compared to capital gains. The higher the dividend payment, the higher the stock price so that the company's value is also high. However, if a small company pays the dividend, then the company's stock price is also low (Purwaningtyas & Abbas, 2021; Setiawan et al., 2021). The results of research conducted by (Dewi et al., 2021; Masri Erma, 2014; Mesrawati et al., 2021; Miranti et al., 2021) stated that dividend policy positively affects firm value. If the dividend policy increases, the value of the company also increases. However, the results of this study are not in line with research conducted by (Abbas, 2019; Apriani et al., 2021; Syamsuhidjar Ar et al., 2020), which states that dividend policy does not affect firm value. The increase in the dividend payout ratio is only a detail and does not affect the level of shareholder welfare. Based on the explanation of the existing research gap, it raises a question in this study, namely about whether dividend policy affects the value of manufacturing companies in the primary and chemical industry sub-sectors in Indonesia.
Another factor that influences firm value is debt policy. Debt is an instrument that is very sensitive to changes in the value of the company (Tahir, 2020). The results of research conducted by (Apriliyanti et al., 2019) stated that debt policy positively affects firm value. Increasing debt at the optimal point will increase the value of the company. Research conducted by (Alvita & Khairunnisa, 2019; Apriani et al., 2021; Nainggolan & Listiadi, 2014) states that debt policy hurts firm value. These results indicate that the higher the debt, the lower the firm value, and the lower the debt, the higher the firm value. These results are not in line with research conducted by (Apriani et al., 2021; Azis, 2017; Dewi et al., 2021; Jones Xaverius Pontoh, 2019; Masri Erma, 2014; Syamsuhidjar Ar et al., 2020), which shows that debt policy does not affect firm value. The high and low debt ratio does not have implications for the high and low value of the company. Based on the explanation of the existing research gap, it raises a question in this study, namely, whether debt policy affects the value of manufacturing companies in the primary and chemical industry sub-sectors in Indonesia.
To achieve the company's goal is maximizing the company's value can not be separated from the problem of how much the company can meet funding needs (Demirgüç-Kunt, 2020). Capital structure can be an important problem for the company because the good or lousy capital structure will directly affect the company's financial position (Mubeen, 2020). Financial managers must be able to raise funds efficiently. The results of research conducted by (Febriana et al., 2016) stated that capital structure positively affects firm value. The use of debt in the capital structure can control the excessive use of free cash flow. So that management does not get involved in unprofitable investment projects. The results of research conducted by (Gustini, 2017; Purwaningtyas & Abbas, 2021; Sri et al., 2013) stated that capital structure hurts firm value. Determination of capital structure by using debt at a certain level as a source of funding can increase the company's value. However, the results of this study are not in line with (Chasanah, 2019; Febriani, 2017; Setiawan et al., 2021; Syamsuhidjar Ar et al., 2020), which state that capital structure does not affect firm value. Based on the explanation of the existing research gap, it raises a question in this study, namely about whether the capital structure affects the value of manufacturing companies in the primary and chemical industry sub-sectors in Indonesia.
Every company, both large and small, must pay attention to liquidity. By maintaining its liquidity, the company can gain the trust of internal and external parties (Pattiruhu, 2020). One of the causes of the company's inability to fulfill its obligations is the negligence of the company's management in running its business. The results of research conducted (Putra & Lestari, 2016) stated that liquidity positively affects firm value. The research results conducted by (Andrianti et al., 2021; G. Zimon, 2020) stated that liquidity hurts firm value. That can be realized because when an enterprise and by ordering goods and services is able to sell them faster and receive payment than is the time of payment for these goods, materials to suppliers (G. Zimon, 2020). These results are not in line with research conducted by (Abbas et al., 2020; Humairah et al., 2021; Purwaningtyas & Abbas, 2021; Septiana et al., 2021), which states that liquidity does not affect firm value.
Signal theory explains the reasons for companies to provide financial statement information to external parties related to the existence of information asymmetry between the company's management and outside parties (Jensen & Meckling, 1976). The company management has more information and knows the company's prospects in the future. The information can be in financial reports, company policy information, or other information that is carried out voluntarily by the company's management. Signal theory suggests how a company should provide signals to users of financial statements. This signal is in the form of information about what management has done to realize the wishes of the owner company (Jensen & Meckling, 1976). Companies can increase the company's value by reducing information asymmetry; one way is by giving signals to outsiders in the form of reliable financial information to reduce uncertainty about the company's prospects in the future.
The theoretical benefit of this research is as a means of information about how the interaction of dividend policy, debt policy, capital structure, and liquidity on firm value in primary and chemical industries in Indonesia. The practical benefits of this research are expected to be used as material for consideration and reference so that in investing, investors choose companies that are transparent in disclosing information and company performance that can be accounted it. And, it can provide a discourse about the importance of the company in making decisions on the policies issued by the company, which of course, can affect its value. In addition, it is also expected to motivate the company so that the company can continue to grow and develop so that it can continue to compete in local and international markets.
Methodology
The approach in this study is quantitative because this research is presented with numbers. Quantitative research is research whose data is quantitative so that it is in the form of numbers or quantitative data that is numbered (Abbas et al., 2018). Meanwhile, Eksandy & Heriyanto (2017) stated that the quantitative research method is a research method based on the philosophy of positivism, used to examine the population in a particular sample; the sampling technique in this study uses purposive sampling based on specific considerations. According to the level of explanation, this research is classified as associative research. According to (Dirvi et al., 2020), associative research aims to find whether there is a relationship between two or more variables. The associative research analysis technique uses quantitative (statistical) analysis techniques. In this study, researchers used four independent variables and one dependent variable. The operational definition of research variables explains each variable used in research on the indicators that make it up. The operational definition of this research can be seen in the following Table 1:
| Table 1 Operational Variables |
|||
| No | Variable | Proxy | Measure Scale |
|---|---|---|---|
| 1. | Firm Value | 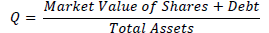 |
Ratio |
| 2. | Dividen Policy | 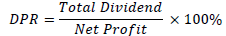 |
Ratio |
| 3. | Debt Policy |  |
Ratio |
| 4. | Structure Capital |  |
Ratio |
| 5. | Liquidity | 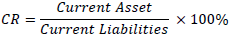 |
Ratio |
This study takes a sample of Basic and Chemical Industry companies listed on the Indonesia Stock Exchange during 2015 - 2019. The data used in this study is secondary data obtained from the official website of the Indonesian Stock Exchange (IDX). Sampling in this study using a purposive sampling technique, namely sampling based on specific criteria. Data found the number of primary and chemical industrial companies listed on the Indonesia Stock Exchange (IDX) in 2015–2019 to be 80 companies. However, 25 companies do not issue annual financial reports, 13 companies that provide complete information in foreign currencies, and 34 companies that do not distribute dividends in a row in 2015–2019. So that the sample data that sample can use are 40 (8 companies x 5 years).
Results
The next stage of data testing aims to find a suitable analytical model so that the model can later be used in the next stage of regression analysis. In testing to find the type of regression model that is suitable for use, the result must pass through the model testing stage, which is as follows:
Based on observations from Table 2, the result can conclude that the model is Random Effect more suitable to analyze the relationship between factors in exogenous and endogenous variables. After finding a suitable model for use, the next stage is classical assumption testing, but this test cannot be applied to all model results that will be used after going through the testing stage. Classical assumption testing is only used for regression models with the OLS approach to estimate (Abbas & Hidayat, 2021). The analytical model that has the nature of the approach Ordinary Least Square (OLS)in the regression model is the Common Effect Model (CEM) and Fixed Effect Model (FEM). Therefore, based on the results of the regression model test, the model obtained that the Random Effect Model (CEM) model was feasible to use. That way, the model will not test the regression in this study for classical assumptions.
| Table 2 Model Estimation Test Results |
||||
| Effect Test | Prob > F | Best Model | ||
|---|---|---|---|---|
| Determining Test | (Prob>F) / (Prob>Chibar2) / (Prob>Chi2) | Description | ||
| Ordinary Least Square (OLS) | 0.0000 | Chow test (OLS vs FE) | 0.0001 | Fixed Effect |
| Fixed Effect (FE) | 0.0000 | Hausman test (FE vs RE) | 0.3442 | Random Effect |
| Random Effect (RE) | 0.0000 | LM test(OLS vs RE) | 0.0000 | Random Effect |
Source: Data processed by Eviews 10.0
Table 3 above describes all variables in this study, including the minimum, maximum, mean (average), and standard deviation values. The explanation above provides an overview of the data descriptive statistics, which is expected to provide an initial picture of the problem under study. Where descriptive statistics are more focused on the highest value, lowest value, average and standard deviation of each variable studied, amounting to 8 Basic and Chemical Industry companies in 2015 to 2019, both independent variables consisting of Dividend Policy, Debt Policy, Capital Structure, and Liquidity, as well as the dependent variable Firm Value.
| Table 3 Analysis Statistic Descriptive Result |
|||||
| Q | DPR | DAR | DER | CR | |
|---|---|---|---|---|---|
| Mean | 1.812525 | 0.725650 | 0.418075 | 1.047350 | 2.316800 |
| Median | 1.732000 | 0.440000 | 0.367500 | 0.559000 | 2.118000 |
| Maximum | 4.584000 | 5.615000 | 0.820000 | 4.547000 | 4.887000 |
| Minimum | 0.673000 | -0.099000 | 0.133000 | 0.154000 | 0.993000 |
| Std. Dev. | 0.979164 | 0.978662 | 0.193006 | 1.127034 | 1.167535 |
| Skewness | 0.805732 | 3.453023 | 0.614542 | 1.871122 | 0.546896 |
| Kurtosis | 3.003491 | 16.85295 | 2.518507 | 5.472948 | 2.150964 |
| Observations | 40 | 40 | 40 | 40 | 40 |
Source: Data processed by Eviews 10.0
a. Firm Value
Table 3 above shows the number of data on the value of the company or Tobin's Q. The largest (maximum) is 4.584000, and the smallest value (minimum) is 0.673000. The mean (mean) of Tobin's Q is 1.812525, and the standard deviation is 0.979164. The standard deviation value, which is smaller than the average value, indicates that the firm value of the sample firms during the study period experienced changes that were not too volatile.
b. Dividen Policy
Table 3 above shows the largest (maximum) amount of dividend policy data or Dividend Payout Ratio (DPR) is 5.615000, and the smallest (minimum) value is 0.099000. The average (mean) of the DPR is 0.725650, and the standard deviation is 0.978662. The standard deviation value that exceeds the average value indicates that the condition of the dividend policy in the sample companies during the study period experienced fluctuating changes.
c. Debt Policy
Table 3 above shows the most significant (maximum) amount of debt policy data or Debt to Asset Ratio (DAR) is 0.820000, and the smallest (minimum) value is 0.133000. The mean (mean) of DAR is 0.418075, and the standard deviation value is 0.193006. The standard deviation value, which is smaller than the average value, indicates that the condition of debt policy in the sample companies during the study period experienced changes that were not too volatile.
d. Capital Structure
Table 3 above shows the most significant amount of capital structure data or Debt to Equity Ratio (DER) (maximum) is 4.547000, and the smallest (minimum) value is 0.154000. The mean (mean) DER is 1.047350, and the standard deviation value is 1.127034. The standard deviation value that exceeds the average value indicates that the condition of the capital structure of the sample companies during the study period experienced fluctuating changes.
e. Liquidity
Table 3 above shows the most significant amount of liquidity data or Current Ratio (CR) is 4.887000, and the smallest value (minimum) is 0.993000. The mean (mean) of CR is 2.316800, and the standard deviation is 1.167535. The standard deviation value is smaller than the average value, indicating that the liquidity conditions in the sample companies during the study period experienced changes that were not too volatile.
Based on the observations in Table 4, it can be seen that the F-table with the criteria df1 = 4 and df2 = 35 with a level of = 5%, then the value is Ftable 2.64. So when compared to Fstatistic (36.9547) > F-table (2.95), it appears that F-statistic is higher than F-table, so it means that the selected regression model is feasible. The exogenous variables in this study were able to explain the variation of high/low endogenous variables by 25.8%, while 74.1% was influenced by exogenous variables that were not present in this study.
| Table 4 Summary of Research Hypotheses |
||||
| Hyp | Hypothesis Statement | Coef. Value | P >|z| | Model |
|---|---|---|---|---|
| 1 | Are dividend policy have positive affected to Firm Value | t-statistic -0.438900 Prob. 0.6634 |
Hypothesis Denied | Q = 5,167007 − 0,044863DPR− 5,881408DAR + 0,209065DER − 0,467033CR + ε |
| 2 | Are debt policy have negative affected to Firm Value | t-statistic -2.332744 Prob. 0.0255 |
Hypothesis accepted | |
| 3 | Are capital structure have positive affected to Firm Value | t-statistic 0.583914 Prob. 0.5630 |
Hypothesis Denied | |
| 4 | Are liquidity have positive affected to Firm Value | t-statistic -2.266896 Prob. 0.0297 |
Hypothesis accepted | |
| F Statistic = 36.9547 | F tabel = 2.64 | |||
| R-Square = 0,258352 | ||||
Source: Data processed by Eviews, 10.0
Discussion
Dividend Policy Not Increasing Firm Value
The dividend policy variable partially does not affect firm value. These results indicate that the high and low dividend ratio distributed to shareholders is not related to the high or low firm value. It is due to the increase in the dividend payout ratio only details and does not affect the level of welfare of shareholders. The results of this study are by research conducted by (Apriani et al., 2021; Apriliyanti et al., 2019; Syamsuhidjar Ar et al., 2020), which states that dividend policy does not affect firm value. The value of the company is only influenced by the company's ability to generate the desired profit. However, the research results are not in line with (Dewi et al., 2021; Ferina & Tjandrakirana, 2015; Masri Erma, 2014; Mesrawati et al., 2021; Miranti et al., 2021; Putra & Lestari, 2016) results, which state that dividend policy has a positive effect on firm value.
Debt Policy Increasing Firm Value
The debt policy variable partially affects the firm value. The negative results support the regression coefficient value of the DAR variable of -6.193462, which illustrates that debt policy hurts firm value. It is because debt is one source of financing that has a high level of risk. This risk is related to the risk of interest payments, which the company cannot cover. The greater the debt, the higher the probability of bankruptcy because the company cannot pay interest and principal. The lower the debt ratio value, the better because it means the company can run its business without debt burden and minimize the risk of bankruptcy. The negative results in this study support the results of research conducted by (Alvita & Khairunnisa, 2019; Apriani et al., 2021; Masri Erma, 2014; Nainggolan & Listiadi, 2014), which states that debt policy hurts firm value. The Apriliyanti research (2019) results stated that debt policy has a positive effect on firm value. However, research conducted by (Ferina & Tjandrakirana, 2015; Setiawan et al., 2021; Syamsuhidjar Ar et al., 2020) states that debt policy does not affect firm value.
Capital Structure Not Increasing Firm Value
The capital structure variable partially does not affect firm value. The bigger the company uses debt, the greater the benefits of using debt from tax savings. It will impact the company's agency costs to external or creditors so that the capital structure of a company is only part of its financial structure. It is shown that profitable companies will use large debts for company funding but can pay their debts from the profits earned. Companies with a low-profit level will not use debt with a high ratio because it will cause the risk of default and bankruptcy. The results of this study are supported by (Chasanah, 2019; Febriani, 2017; Setiawan et al., 2021; Syamsuhidjar Ar et al., 2020) which state that capital structure does not affect firm value. However, the results of this study are not in line with (Febriana et al., 2016; Gustini, 2017; Purwaningtyas & Abbas, 2021), which states that capital structure has a positive effect on firm value.
Liquidity Increasing Firm Value
The liquidity variable partially affects the firm value. The negative results support the CR variable regression coefficient of -0.546159, which illustrates that liquidity hurts firm value. The higher the liquidity, the company's value will decrease because of the large number of idle funds resulting in the company not utilizing its current assets optimally. It is considered by investors and becomes a negative signal because the company must bear the risk in capital costs. The results of this study are supported by (Andrianti et al., 2021; Sri et al., 2013) which states that liquidity hurts firm value. However, the results of this study are not in line with (Abbas et al., 2020; Chasanah, 2019; Febriani, 2017; Humairah et al., 2021; Purwaningtyas & Abbas, 2021; Septiana et al., 2021), which state that liquidity does not affect firm value.
Conclusion
This study analyzes the effect of Dividend Policy, Debt Policy, Capital Structure, and Liquidity on Firm Value. The sample used is eight companies in the Basic and Chemical Industry sector listed on the Indonesia Stock Exchange from 2015 to 2019. Based on the results of the tests carried out, it can be concluded several things, namely. Dividend policy and capital structure in this study do not affect firm value. Debt policy in this study affects firm value. The debt policy regression coefficient (DAR) value is 5.881408, which illustrates that debt policy hurts firm value. Likewise, the liquidity variable in this study affects firm value. The liquidity regression coefficient (CR) value is -0.546159, which illustrates that liquidity hurts firm value. This study has limitations. Namely, the Adjusted R-Square value in this study is 0.258352 on the variables of Dividend Policy, Debt Policy, Capital Structure, and Liquidity in explaining its influence on the Firm Value variable which is still limited at only 25.83%. The remaining 74.17% is explained by other variables not examined in this study, and this study only took a sample of 40 financial statements from 8 Basic and Chemical Industry Sector Companies listed on the Indonesia Stock Exchange for the 2015–2019 period.
References
- Abbas, D.S. (2019). FACTORS AFFECTING THE RETURN OF SHARES (In the Company’s Infrastructure Sector, Utilities, and Transportation Listed on the Stock Exchange in 2011-2015).
- Abbas, D.S., Ubay, D., & Sutardji, S. (2020). Faktor-Faktor Yang Mempengaruhi Nilai Perusahaan. Jurnal Akuntansi dan Manajemen, 17(01), 42–49.
- Abbas, D.S., & Imam, H. (2021). Enterprise Risk Management, Inventory Intensity, Pre-Tax Foreign Income and Economic Performance: Competitive Advantage as Moderator. LINGUISTICA ANTVERPIENSIA: 3518–29.
- Abbas, D., Ali Wardana, & Ahmad, S. (2018). Faktor-Faktor Yang Mempengaruhi Manajemen Laba (Pada Perusahaan Sub Sektor Properti Dan Real Estate Yang Terdaftar Di BEI Pada Tahun 2016-2018). Balance Vocation Accounting Journal, 2(2), 47–58. http://jurnal.umt.ac.id/index.php/bvaj/article/view/2067.
- Alvita, F., & Piristina, K. (2019). Analisis Pengaruh Kebijakan Dividen, Keputusan Investasi Dan Keputusan Pendanaan Terhadap Nilai Perusahaan. Jurnal ASET (Akuntansi Riset) 11(1), 108–22.
- Andrianti, A., Dirvi, S.A., & Mohamad, Z.H. (2021). Pengaruh Profitabilitas, (Roa), Ukuran Perusahaan, Likuiditas, Pertumbuhan Penjualan Dan Struktur Aset Terhadap Kebijakan Hutang. In PROSIDING SEMINAR NASIONAL EKONOMI DAN BISNIS, 614–23.
- Apriani, R., Mohamad, Z.H., & Dirvi, S.A. (2021). Pengaruh Keputusan Investasi, Keputusan Pendanaan, Dan Kebijakan Dividen Terhadap Nilai Perusahaan (Pada Perusahaan Manufaktur Sector Industri Barang Konsumsi Yang Terdaftar Di Bursa Efek Indonesia Tahun 2016-2019). In PROSIDING SEMINAR NASIONAL EKONOMI DAN BISNIS, 320–29.
- Apriliyanti, V., Hermi, H., & Vinola, H. (2019). Pengaruh Kebijakan Hutang, Kebijakan Dividen, Profitabilitas, Pertumbuhan Penjualan Dan Kesempatan Investasi Terhadap Nilai Perusahaan Dengan Ukuran Perusahaan Sebagai Variabel Moderasi. Jurnal Magister Akuntansi Trisakti, 6(2), 201.
- Azis, R.Y. (2017). Pengaruh Keputusan Investasi, Kebijakan Dividen, Dan Kebijakan Hutang Terhadap Nilai Perusahaan Manufaktur Yang Terdaftar Di BEI. Skripsi, 1–83.
- Chasanah, A.N. (2019). Pengaruh Rasio Likuiditas, Profitabilitas, Struktur Modal Dan Ukuran Perusahaan Terhadap Nilai Perusahaan Pada Perusahaan Manufaktur Yang Terdaftar Di Bei Tahun 2015-2017. Jurnal Penelitan Ekonomi dan Bisnis, 3(1), 39–47.
- Demirgüç-Kunt, A. (2020). The Global Financial Crisis and the Capital Structure of Firms: Was the Impact More Severe among SMEs and Non-Listed Firms? Journal of Corporate Finance 60. https://www.scopus.com/inward/record.uri?partnerID=HzOxMe3b&scp=85074752526&origininward.
- Dewi, M.G., Mohamad, Z.H., & Dirvi, S.A. (2021). Pengaruh Profitabilitas, Kebijakan Hutang Dan Pertumbuhan Perusahaan Terhadap Kebijakan Dividen (Pada Perusahaan Sektor Industri Dasar Dan Kimia Tahun 2017-2019). In PROSIDING SEMINAR NASIONAL EKONOMI DAN BISNIS, 110–20.
- Dirvi, S.A., Arry, E., & Mulyadi. (2020). Economic Performance of Indonesian Manuffacturing Ccompanies With Factors. International Journal of Science, Technology & Management, 1(4), 252–63.
- Driver, C. (2020). Dividend Policy and Investor Pressure. Economic Modelling, 89, 559–76. https://www.scopus.com/inward/record.uri?partnerID=HzOxMe3b&scp=85076514640&origininward.
- Eksandy, A., & Freddy, H. (2017). Metode Penelitian Akuntansi Dan Keuangan. Tangerang, Universitas Muhammadiyah Tangerang.
- Febriana, E., Djumahir, & Achmad, H.D. (2016). Kepemilikan Saham Manajerial Dan Profitabilitas Terhadap Nilai Perusahaan (Studi Pada Perusahaan Manufaktur Yang Terdaftar Di BEI Pada 2011-2013). Jurnal Ekonomi Bisnis, 21(2), 163–78.
- Febriani, & Nia Puput. (2017). Pengaruh Struktur Modal, Profitabilitas Dan Ukuran Perusahaan Terhadap Nilai Perusahaan Pada Perusahaan Industri Sektor Dasar Dan Kimia Yang Terdaftar Di BEI Periode 2013-2015. Simki-Economic, 01(09).
- Ferina, I.S., & Rina, T.DP. (2015). Pengaruh Kebijakan Dividen, Kebijakan Hutang, Dan Profitabilitas Terhadap Nilai Perusahaan. Jurnal Akuntanika, 2(1), 52–66.
- Gustini, E. (2017). Pengaruh Kebijakan Dividen Dan Kebijakan Hutang Terhadap Nilai Perusahaan (Studi Empiris Perusahaan BUMN Yang Terdaftar Di Bursa Efek Indonesia). Jurnal Ilmiah Ekonomi Global Masa Kini, 8(2), 1–5.
- Humairah, T.P., Mohamad, Z.H., & Dirvi, S.A. (2021). “Pengaruh Profitabilitas, Likuiditas, Dan Leverage Terhadap Nilai Perusahaan.” In PROSIDING SEMINAR NASIONAL EKONOMI DAN BISNIS, 339–51.
- Jensen, C., & Meckling, H. (1976). THEORY OF THE FIRM: MANAGERIAL BEHAVIOR, AGENCY COSTS AND OWNERSHIP STRUCTURE, I. Introduction and Summary In This Paper WC Draw on Recent Progress in the Theory of (1) Property Rights, Firm. In Addition to Tying Together Elements of the Theory of E. 3, 305–60.
- Jones, X.P., & Agnes, P. (2019). The Influence of Investment Decisions, Funding Decisions, and Dividend Policies on Corporate Values in Manufacturing Companies in the Consumer Goods Industry Sector Listed on the Indonesia Stock Exchange for the 2012- 2016. Journal of Chemical Information and Modeling, 53(9), 1689–99.
- Kumar, S. (2020). Capital Structure of SMEs: A Systematic Literature Review and Bibliometric Analysis.” Management Review Quarterly, 70(4), 535–65.
- Masri, E., & Wijaya. (2014). “PENGARUH KEPUTUSAN INVESTASI DAN KEPUTUSAN PENDANAAN TERHADAP NILAI PERUSAHAAN PERTAMBANGANDI BURSA EFEK INDONESIA.” Jurnal Akuntansi Politeknik Sekayu, I(1), 52–58.
- Mesrawati, M., Clairine, C., Katrynie, M.B., & Apriadi, J. (2021). Pengaruh Keputusan Investasi, Keputusan Pendanaan, Dan Kebijakan Dividen Terhadap Nilai Perusahaan Konsumsi Yang Terdaftar Di Bursa Efek Indonesia Periode 2016-2018. In Warta Dharmawangsa, 157–65.
- Miranti, E., Mohamad, Z.H., & Dirvi, S.A. (2021). “Pengaruh Profitabilitas, Leverage, Dan Pertumbuhan Perusahaan Terhadap Kebijakan Dividen (Pada Sektor Industri Barang Konsumsi Periode 2016-2019).” In PROSIDING SEMINAR NASIONAL EKONOMI DAN BISNIS, 121–32.
- Mubeen, R. (2020). The Effects of Market Competition, Capital Structure, and CEO Duality on Firm Performance: A Mediation Analysis by Incorporating the GMM Model Technique. Sustainability (Switzerland), 12(8).
- Nainggolan, S.D.A., & Agung, L. (2014). “Pengaruh Kebijakan Dividen Terhadap Nilai Perusahaan Dengan Kebijakan Hutang Sebagai Variabel Moderasi.” Jurnal Ilmu Manajemen, 2(3), 868–79.
- Nguyen, V.C. (2020). Human Capital, Capital Structure Choice and Firm Profitability in Developing Countries: An Empirical Study in Vietnam. Accounting, 6(2), 127–36.
- Pattiruhu, JR. (2020). Effect of Liquidity, Profitability, Leverage, and Firm Size on Dividend Policy. Journal of Asian Finance, Economics and Business, 7(10), 35–42.
- Purwaningtyas, D., & Dirvi, S.A. (2021). Pengaruh Profitabilitas, Likiuditas, Leverage, Ukuran Perusahaan, Dan Kebijakan Dividen Terhadap Nilai Perusahaan (Studi Empiris Pada Perusahaan Consumer Goods Industry Yang Terdaftar Di Bursa Efek Indonesia 2017-2018). In PROSIDING SEMINAR NASIONAL EKONOMI DAN BISNIS, 272–80.
- Putra, A.A., Ngurah, D.A., & Putu, V.L. (2016). PENGARUH KEBIJAKAN DIVIDEN, LIKUIDITAS, PROFITABILITAS DAN UKURAN PERUSAHAAN TERHADAP NILAI PERUSAHAAN. E-Jurnal Manajemen Unud, 5(7), 4044–70.
- Renneboog, L. (2020). How Relevant Is Dividend Policy under Low Shareholder Protection? Journal of International Financial Markets, Institutions and Money, 64.
- Septiana, H.V., Mohamad, Z.H., & Dirvi, S.A. (2021). Pengaruh Profitabilitas, Likuiditas, Pertumbuhan Penjualan Terhadap Struktur Modal (Studi Empiris Perusahaan Sektor Industri Dasar Dan Kimia Di Bursa Efek Indonesia Tahun 2016-2019). In PROSIDING SEMINAR NASIONAL EKONOMI DAN BISNIS, 527–38.
- Setiawan, D., Irfan, R., & Dirvi, S.A. (2021). Pengaruh Profitabilitas, Leverage, Ukuran Perusahaan, Struktur Modal Dan Net Profit Margin Terhadap Nilai Perusahaan (Studi Empiris Pada Perusahaan Consumer Goods Yang Terdaftar Di Bursa Efek Indonesia 2016-2018). In PROSIDING SEMINAR NASIONAL EKONOMI DAN BISNIS, 417–24.
- Sri, A., Mahatma, D., & Ary, W. (2013). Pengaruh Struktur Modal, Profitabilitas Dan Ukuran Perusahaan Pada Nilai Perusahaan. E-Jurnal Akuntansi, 4(2), 358–72.
- Sumani, S. (2020). Reciprocal Capital Structure and Liquidity Policy: Implementation of Corporate Governance toward Corporate Performance. Journal of Asian Finance, Economics and Business, 7(9), 85–93.
- Tahir, H. (2020). Do Board Traits Influence Firms’ Dividend Payout Policy? Evidence from Malaysia. Journal of Asian Finance, Economics and Business, 7(3), 87–99.
- Zimon, D., & Grzegorz, Z. (2019). The Impact of Implementation of Standardized Quality Management Systems on Management of Liabilities in Group Purchasing Organizations. Quality Innovation Prosperity, 23(1), 60–73.
- Zimon, G. (2018). Influence of Group Purchasing Organizations on Financial Situation of Polish SMEs. Oeconomia Copernicana, 9(1), 87–104.