Research Article: 2022 Vol: 26 Issue: 2
Does Corporate Environmental Management Disclosures Improve Corporate Performance? Evidence from FTSE 100 Malaysian Firms
Foong Wei Chee, Universiti Malaysia Sarawak
Josephine Tan-Hwang Yau, Universiti Malaysia Sarawak
Prihatnolo Gandhi Amidjaya, Universiti Malaysia Sarawak
Audrey Liwan, Universiti Malaysia Sarawak
Jerome Swee-Hui Kueh, Universiti Malaysia Sarawak
Citation Information: Chee, F.W., Yau, J.T.H., Amidjaya, P.G., Liwan, A., & Kueh, J.S.H. (2022). Does corporate environmental management disclosures improve corporate performance? Evidence from ftse 100 malaysian firms. Academy of Accounting and Financial Studies Journal, 26(2), 1-18.
Abstract
This research paper aims to determine the linkage between corporate environmental management disclosure and firm financial performance by using the sample of top 100 public listed companies in Bursa Malaysia from the period 2012 to 2017. Therefore, the independent variables selected in this paper are corporate environmental management systems (CEM) which can further be classified as water management (WM), energy management (EM) and carbon management (CM). Meanwhile, the dependent variables are; return on equity (ROE), return on sales (ROS), return on investment (ROI), return on invested capital (ROIC) and capital intensity (CI). Besides that, firm characteristics have been added in this paper as control variables, namely; firm liquidity, size, leverage and age. All the data used in this paper were manually gathered from annual reports of respective companies and Thomson Reuters Eikon Database. The empirical analysis indicated that carbon management is significant to firm financial performance (ROE, ROIC). This might be due to the Malaysian government actively engaging in carbon emission reduction programmes; hence firms will be more aware and put more effort into carbon management. The findings recommended that the corporate environmental management disclosure should be one of the core concerns for shareholders, policymakers and investors.
Keywords
Corporate Environmental Management, Carbon Management, Energy Management, Water Management, Firm Performance.
JEL Classifications
G32, L25, Q52, Q56 .
Introduction
Malaysia is moving forward to be an industrialized economy in this 21st century. Consequently, industry or corporation is the major factor of environmental problems. This is because human depends on industrial products, and corporations use the resources and release environmental pollution. Environmental issues such as climate change can be considered a hot matter and the most significant threat to nature and humanity around the world. The impact of the environmental problems in Malaysia may affect our politics, economy and even the social Thus, companies are urged to adopt environmental management to manage environmental issues. Malaysian government engages with the international community in order to enhance environmental management. For example, UNFCCC (Paris Agreement), Montreal Protocol, Kyoto Protocol, Vienna Convention for the ozone layer protection, Langkawi Declaration among Commonwealth countries, ASEAN Transboundary Haze Agreement and so on. Apart from that, the government also established the Environmental Quality Act in 1974 to support the implementing projects linked to air, sewage and industrial effluent assessment (Rao, 2002) .
Corporate Environmental Management is a hot issue that has attracted the attention of national, international, political and business leaders around the world. Friedman (1970) implied that the maximization of the shareholders' wealth is the main objective of a business. The advocate of this business hypothesis stated that companies are the sole responsibility to get profit. At the same time, the government is accountable for taking care of the public as well as the environment. According to Singh et al. (2007), due to companies ignoring their business activities toward the environment and focusing on maximizing the profits of their stakeholders, several environmental impacts had arisen, for example, climate change, depletion of non-renewable resources, a decrease of land resources, diminishing of water resource, potential threats to the human being health and safety. The problem of environmental mistreatment and degradation had led to government, NGOs and companies to take part in environmental management. Apart from that, the academic world also devoted a variety of groups in response to the environmental management issues such as Innovation Sustainability and Ethics (BRESE), Brunei Research in Enterprise, International Centre for Corporate Social Responsibility at Nottingham University in the United Kingdom and others .
Makower (1993) stated that a wide range of corporate stakeholders which consists of customers, shareholders, investors, employees, creditors and the public have considered corporate environmental management are vital. In the investment viewpoint, shareholder value may be affected if millions of dollars of payment in fines, clean-up expenses and courts fees are needed to pay by companies in order to keep the company officers out of jail. (Coleman, 2011). While in the customer's standpoint, the numbers of customers that purchase the greener businesses and goods are increasing gradually, according to Oliff & Vandermerwe (1990), there is around a third of adults in the UK purchased approximately 15-50% of organic foods. Moreover, from employee perspectives, companies with high environmental risks are more difficult to attract the interest of top executives and employees (Clark, 1990). Lastly, from the viewpoint of the public, pollution is defined as a significant issue of health hazard by about 60% of Americans, and 75% think that the business should be accountable for environmental management.
Nowadays, investors will be more concerned about environmental items disclosure in the annual report of a company because of the increasing public awareness of environmental issues like climate change, greenhouse effect, and pollution. Environmental disclosure might be one of the vital tactics to attract foreign direct investments in Malaysia. As a developing country, foreign direct investment is the main key that enhances the economic growth of Malaysia. Malaysia is contending financial resources with other developed countries. Therefore, Malaysian companies should include environmental management items disclosures in their annual report to boost the confidence of foreign investors. Cowton & Sanberg (2012), Renneboog et al. (2011), stated that currently, the investors not only measure firm performance, they also look into the social performance such as environmental performance before they decide whether to invest or not. Amran & Devi (2013), explained that the annual report acts as an important communication technique between the companies and investors. Companies could illustrate corporate environmental management to the public, stakeholders and potential investors by using the annual report. Consequently, it might improve the responsibility of the firms to their shareholders and assist the potential investors in deciding reasonable decisions in investment (Choi et al., 2013) .
Hence, this study intends to answer the following research questions: .
1. Does corporate environmental management (CEM) influence corporate financial performance in Malaysia? .
2. Does water management (WM) influence corporate financial performance in Malaysia? .
3. Does energy management (EM) influence corporate financial performance of the corporation in Malaysia? .
4. Does carbon management (CM) impact corporate financial performance in Malaysia? .
Literature Review
Currently, corporate environmental management is becoming more popular around the world. It has become a global trend in order to preserve the environment. This is because most of the government, companies and the public are more informed on the environmental topic and require a high level of environmental performance by applying an environmental management system. The advantages of adopting corporate environmental management are reducing legislative non-compliance, enhancing employee environmental awareness, increasing financial resources by reducing explicit costs and ensuring continuous environmental improvement .
Environmental Management System (EMS)
Bansal & Hunter (2003) explained that the Environmental Management System (EMS) is a set of different companies practices which concentrated on the classification, measurement and management of firm environmental impacts. Meanwhile, Darnall & Edwards (2006) implied that EMS is a management procedures system that allows a firm to control and decrease their business activities impact the environment, setting up and executing environmental goals. The main steps in EMS are to plan, do, check and act. This system is to assist the company by recognizing, assessing, supervising, and retaining the connections among the environment to diminish or avoid adverse environmental impacts and reach its environmental goals Figure 1.

Figure 1 Stages of Implementing EMS
The corporate environmental management system does not straightforwardly deal with the environment. Instead, it focuses more circuitously, but even so effective. The relation between the company and the environment parts have become the main focus of the management. For instance, a business that encloses a pro-environmental status could increase its competitive advantage globally (Cole et al., 2006). Meanwhile, Atasu (2008), implied that environmental management could lead to improve quality products and decrease the costs. Smith & Pitt (2011) also highlighted that employee enthusiasm could be boosted by investing more in environmental business and hence caused a better performance.
The environmental management system (EMS) conforms with the ISO 14000 standard. ISO 1400 standard is an international standard developed by the International Organization for Standardization in 1996. It acts as a useful tool for companies that seek for managing their environmental responsibilities. According to ISO, there are over 300,000 companies in the world have certified ISO14000. This international standard was carried out a continual improvement survey in order to meet the wants of recent, past and potential users. When the corporations follow the rules under the ISO14000 environmental management system the company will be able to reduce the environmental risk and enhance environmental performance. There are a series of ISO14000 which give a structure for the improvement of environmental management system such as ISO14001 (2015) is the requirements with guidance for use, ISO14004 (2016) is general guidelines on implementation, ISO 14005 (2010) guidelines for implementation and evaluation of EMS, ISO14006 (2011) is guidelines for incorporating ecodesign Figure 2.

Figure 2 Continuous Improvement Cycle
Environmental Management Practices
Environmental management practices refer to those environmentally friendly activities. Its purposes are to preserve the natural surrounding and decrease harms that can be caused upon it due to human beings and companies activities. Environmental management practices include water management, land management, energy management, carbon management (carbon footprint reduction) and so on. The aim of companies implementing environmental practices is diminishing costs relating to manufacturing, supplying, utilize and disposal of goods. There are a few common environmental management practices applied by public listed firms, such as water management systems, energy management systems, carbon management, and pollution control.
Water management is an important element for firms, especially plantation companies. It is significant for the growing of trees. For example, inefficient water management could lead to the low productivity of oil palm. Hence, the firm should manage water wisely to maximize productivity. The firm should ensure the quality of groundwater, preserve wetlands, buffer zones and no construction of bunds across the main waterway (Waddock, & Graves, 1997).
Most of the firms had discovered a lot of experience from the year 1970. It happened energy crisis this year. Therefore, the firms installed, widened and persist to improve their energy efficiency development. For example, Tenaga Nasional Berhad (TNB) has implemented an energy-saving approach. It enables increase energy performance and sustainable reduction of energy consumption. Besides that, energy-saving also could diminish toxic waste, emissions to the atmosphere and thus decreasing treatment and expenses of the firms. The energy management system is complying with ISO50001 which consists of requirements with guidance for use.
Carbon footprint assessment refers to a measure of carbon dioxide (in tons) that human being produces. Furthermore, Walser (2014), implied that carbon footprint means the total emission of greenhouse gas to the atmosphere during fossil fuels are burned for transportation and human activities. A research paper carried out by Smale, Hartley, Hepburn, Ward, and Grubb (2006) determines the linkage between European carbon dioxide emission and firm profits. The result indicates that there was increasing in profits if the firms were involved in diminishing carbon emission. Equally, Collins (2013) also indicates that there was a positive correlation between carbon emission and firm performance. Meanwhile, the study carried out by Busch & Hoffman (2011) showed a negative relationship among these two variables.
Pollution control can be referred to as a vital section in corporate environmental management. Much concern has been given to pollution control globally. For example, the integrated pollution prevention and management regime that executed in the year 2000. It promotes European companies to invest in environmental practices like protection of pollution, waste treatment and so forth. Green initiatives launched by the firms could decrease pollution and thus increase profit. This is because it is appealing to customers who are concerned about the environment and who favour purchasing goods that have environmentally friendly.
Theory and Evidence on Corporate Environmental Management and Firm Financial Performance
There will be four theories executed prior studies to explain the relationship between corporate environmental management and firm financial performance, which are agency theory, stakeholder theory, legitimacy theory and supply and demand theory.
The relationship between corporate environmental management and financial performance can be explained by agency theory. Agency theory is proposed by (Jensen & Meckling, 1976). This theory is stated that conflict occurs between principal and agent. In agency theory, shareholders act as principal while the board of directors act as agent. According to Terjesen et al. (2009), a conflict that occurs between principal and agent could be in terms of costs and interests. Liu et al. (2014) stated that agency problems will have occurred if the board of directors’ interest is not consistent with the shareholders' interest. In terms of environmental issues, shareholders might prefer firms incorporate environmental management disclosure to increase firm reputation. Conflict of interest occurred when the director’s remuneration mostly depends on firm financial performance whereby environmental management is a non-financial activity and has less impact on firm financial performance. To understand the relationship between corporate environmental management disclosure and firm performances, agency theory is normally applied in the area of economics and finance (De Luis- Carnicer et al., 2008).
Stakeholder theory has been widely brought up by the researchers, which embrace Non - governmental organizations (NGOs), policymakers, and industries. It upholds the vision of the company and board of management that the purpose is to maximize shareholder wealth in order to be sustainable. There are three types of theories under stakeholder theory which are normative stakeholder theory, descriptive stakeholder theory and instrumental stakeholder theory. According to Friedman (1970), normative stakeholder theory is the theory that consists of how managers and stakeholders should perform and examine the objective of the companies. Meanwhile, the way managers and stakeholders act and view their actions and responsibilities are referring to descriptive stakeholder theory. Whereas, instrument stakeholder theory is if managers want to work for their own interest how the managers should perform.
Ahmad & Haraf (2013) clarified corporate environmental management disclosures based on legitimacy theory. Legitimacy theory gives an ideal instrument to review companies’ corporate environmental management practices in the annual reports. Faisal et al. (2012) stated that previous research applies this theory to explain the coverage of such issues. The Board of management reveals their environmental management in the annual report may increase the level of confidence of stakeholders. Thus, stakeholders may have trust in firm business activities and invest in the firm. In order to persist in society, corporate environmental reporting is the fundamental way to retain legitimacy. Legitimacy theory is derived from the principle that there occurs a community agreement among a firm and society it operates in. The operation of the firms must be in tolerable manners as deemed by the public. Legitimacy theory believes that approval approaches will be displayed by the firms to the society that it is trying to adhere to society’s prospects of business activities. According to Suchman, the continued existence and development of the firm is founded on community agreement whereby the firm operates in publicly allowed manners. Even though the firm may have institutional power, the firm is unable to survive if it is violating the community agreement. When the firm disobeys the community agreement, the firm might be vulnerable for instance, rising of taxes and fines by government agencies, an embargo by society, decreasing level of confidence of potential investors and diminishing the firm financial resources. Hence, the firm should constantly abide by the requirements, restrictions, and prospects from the public in order to develop business activities.
Supply and demand theory assumes to uphold shareholders value. This theory stated that corporate environmental management and firm financial performance does not relate to each other (McWilliams & Siegel, 2001; Salama, 2005). McWilliams & Siegel (2001) explained that a company that set up corporate environmental management will incur higher expenditure and gain higher revenue while the company that does not involve corporate environmental management will have lower expenses and also lower revenue.
Previous research has proved that implementing environmental management could assist companies to gain financial advantages. Gray & Bebbington found that pollution control is positively related to firm performance. Wong also found a positive correlation between recycling and firm performance. Konar & Cohen, found a positive relationship between environmental management and firm performance which is measured by releasing of toxic on firm’s value. On the other hand, Klassen (1996), disagree that implementing environmental management could enhance sales. While, Klassen & Mc Laughlin, implied that the profit of companies may increase by selling green products. This is due to the fact that nowadays customers are more willing to purchase green products. Darnall also stated that conducting environmental management could gain access to controllers and thus serve as a competitive advantage for the companies.
Hypotheses Development
Most of the previous studies have shown that there is a positive relationship between corporate environmental management and firm financial performance. The greater the company adopts environmental management, the larger the capability of the firm. According to Melnyk stated that conducting effective environmental management is important to a firm’s capability to reduce environmental issues and lead to improving entire corporate financial performance. Additionally, Judge & Douglas and Karagozoglu & Lindell also imply a positive relationship between corporate environmental management and firm financial performance. Wagner (2005) conducted a study to examine the relationship between environment and performance. The environmental variables chosen were water management and energy management. Then, the environmental variables are positively related to performance. Moreover, the research regarding water usage and corporate financial performance was carried out by. The result showed that water usage is significantly and positively related to firm financial performance.
Soyka & Powers, carried out the research relating to energy management on firm financial performance. The findings indicated that effective energy management generates an outstanding new company’s wealth. In addition, the also studied investments in energy-saving programs by the companies have a significant positive relationship on the firm operating margin. Besides, Pons also determines the implementation of energy technology on the financial performance of a manufactured firm. The results show there is a statistical relationship between energy management and firm financial performance. Previous research by Hart & Ahuja had investigated the relationship between carbon emission management and firm financial performance. They employed return on equity (ROE) to measure the firm financial performance and found that can only be partially confirmed the correlation between carbon emission management and firm financial performance. Besides that, Ganda & Milondzo (2018) studied the effect of carbon emission on firm financial performance. The results showed that companies that implemented green investment initiatives will have lower carbon emissions and boost corporate financial performance. Hence, we hypothesize the relationship between corporate environmental management, water management, energy management and carbon management with corporate financial performance as below:
H1: There is a significant positive relationship between corporate environmental management and corporate financial performance.
H2: There is a significant positive relationship between water management and corporate financial performance.
H3: There is a significant positive relationship between energy management and corporate financial performance.
H4: There is a significant positive relationship between carbon management and corporate financial performance.
Data and Methods
This paper examines the relationship between corporate environmental management disclosure and firm financial performance by using the sample of the FTSE Bursa Malaysia Top 100 index firms. Our sample period covers from 2012 to 2017. Therefore, the independent variables selected in this paper are corporate environmental management systems (CEM) which can further be classified as water management (WM), energy management (EM) and carbon management (CM). Meanwhile, the dependent variables are; return on equity (ROE), return on sales (ROS), return on investment (ROI), return on invested capital (ROIC) and capital intensity (CI). Besides that, firm characteristics have been added in this paper as control variables, namely; firm liquidity, size, leverage and age. All the data used in this paper were manually gathered from annual reports of companies and the Thomson Reuters Eikon database. We employed content analysis to extract the disclosure of our explanatory variables; corporate environmental management system (CEM), water management (WM), energy management (EM) and carbon management (CM). Figure 3 shows the research framework for this study Figure 3.

Figure 3 Research Framework
Research Framework
Measures
Dependent Variables
Firm Performance (Profitability Measurement and Asset Utilization Measurement)
According to Palepu et al. (1996), firm value can be defined as the function of growth and profitability. In this research paper, a few financial variables will be applied to evaluate corporate financial performance by the investment community. According to Hawkins (1998), in profitability measure return on equity (ROE) is most likely mainly reported. Besides that, Berstein & Wild (1998) stated that ROE is a measure of great concern to shareholders. Several earlier empirical research used ROE as one of the measures to assess firm performance as it represents company profits in terms of equity. ROE can be divided into a few sub-components of return on sales (ROS), return on investment (ROI) and asset utilization. In addition, Palepu et al. (1996) stressed that any movement in ROE designates changes in profit margin for example ROS. Hence, this research paper also chose ROS as a profitability measure. This is because it is sensitivity as an overall indicator of profitability, and it is not exposed to criticism. The formula of ROE is written as below:
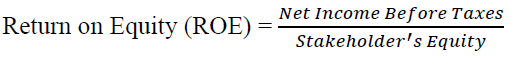
Meanwhile, the formula of ROS is written as below:
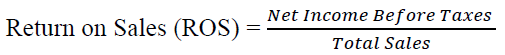
In addition, ROI is an alternative to measure the efficiency of an investment or to evaluate the efficiency of a number of different investments. The formula of ROI is mathematically calculated as below:
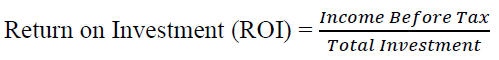
Moreover, return on invested capital (ROIC) is a measurement to assess the accurate pictures on how the effectiveness of the firms is in exploiting capital and determine whether or not firms competitive positioning enable it to make profits from the capital. The mathematical equation for ROIC is stated as below:

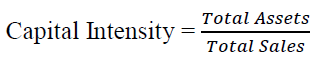
Under asset utilization measurement, this research also employed capital intensity measurement as a component of the analysis. Capital intensity can be classified as a measurement that showed how many assets the firm requires to produce a ringgit in sales. The equation of capital intensity is computed as below which is total assets divided by total sales:
Explanatory Variables
The independent variable for our model is corporate environmental management which consists of water management, energy management and carbon management. According to Weinhofer & Hoffmann and Lee revealed that several research papers used content analysis to check the presence of corporate environmental management especially carbon management. In this present study, content analysis has been applied in order to analyze whether a firm adopts CEM, WM, EM and CM or not. Therefore, content analysis was carried out by using the data analysis software package NVivo 11 and manually coding. CEM, WM, EM and CM is dichotomous variable coded 1 if the firm adopts one or more criteria and coded 0 if it does not. To improve validity and reliability, following the coding rules on small sample data before actual coding and operational definitions was suggested by Holsti.
It uses dummy variables in that assigning a score of 0 if the firms do not disclose that particular item. On the other hand, a score of 1 is recorded if the firms disclose the particular information. The unweighted method presumes that all of the disclosure items are equally important to the users of an annual report. Therefore, the unweighted method is applied in this research study as the scoring is unbiased and not subjective. The previous studies that used dummy variables to score the environmental management disclosure items are Ahmad & Haraf.
Control Variables
Firm liquidity means the company's capability to meet its short-term financial debts. Liquidity ratios try to evaluate the company's ability to pay off its short-term obligations without any postpone or difficulty. Hence, companies are able to settle their debts as soon as possible if the liquid ratio is higher. Meanwhile, a low liquid ratio indicates that the companies have difficulty in paying off their debt and does not sound liquidity position. Subrahmanyam et al. (2001) implied a positive relationship between firm liquidity and firm performance. The formula of liquid ratio is written as below:

According to Nassar et al. (2014), to measure the firm size, total sales, and total assets are commonly applied in previous empirical studies. Total sales and total assets can be considered as better indicators in determining the firm size. The large firm could formalize procedures and be efficient in conducting their business activities. This led to the firm meeting lower operating costs and recognizing economies of scale and scope. In short, larger companies are able to reach better economic performance as compared to smaller companies. In the previous studies (Nekhili & Gatfaoui, 2013, De Villiers & Staden, 2011; Chau & Gray, 2010), the firm size is measured by obtaining the natural logarithm on the company's total asset. The formula is written as below:
Firm size = Log (Total Assets)Firm leverage is referring the companies utilizing the borrowed capital as a funding basis to enlarge their asset base and produce returns on risk capital. In other words, leverage means the debt used by the firms to finance their operations. According to Fukuda et al. (2009), measured the firm leverage through long term debt divided by total assets. The formula is stated as below:
Firm age also acts as one of the independent variables in determining firm financial performance. This indicator is estimated based on the number of years the firm has been founded. The older firm could obtain advantages from experience, status, built business interactions and networks. Firm age is calculated by the differences between the current years of the firm operating and the year the firm was established. (Thah & Ha, 2013). The formula is listed as below:
Firm age = current year of the firm operate – the year of the firm established
Estimation Model
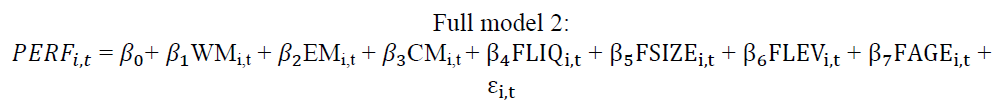
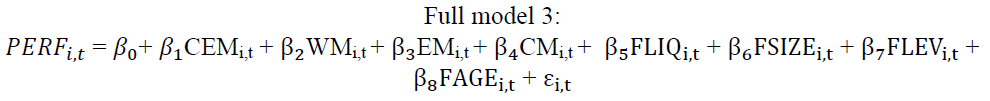
For this study, we employed four estimation models, which include one baseline model and three full models. This research paper examines firm financial performance in five dimensions which are return on equity (ROE), return on sales (ROS), return on investment (ROI), return on invested capital (ROIC), and capital intensity (CI). Baseline Model:
Firm financial performance = f (LIQUIDITY, SIZE, LEVERAGE, AGE)


Where,
PERF = Firm Financial Performance (measured by ROE, ROS, ROI, ROIC and CI)
CEM = Corporate Environmental Management
WM = Water Management
EM = Energy Management
CM = Carbon Management
FLIQ = Firm Liquidity
FSIZE = Firm Size
FLEV = Firm Leverage
FAGE = Firm Age
ε = Error Term i,t = Indicators for one and cross-sectional unit and t shows time in yearRESULTS
Descriptive Statistics and Pearson Correlation Matrix
According to the results in Table 1, the mean is in positive value. The mean of ROE, ROS, ROI, ROIC and CI is 19.259, 14.951, 63.268, 12.666, 4.907 respectively. As shown in Table 1, it showed that on average, there is 93.4% of our sample firms employed CEM, 67.6 % of the firms practice WM, 75.5% of them have EM. And lastly, 56.4% of the firm disclosed their effort in CM. It means that Malaysia Top 100 firms are highly engaged in Corporate Environmental Management (CEM).
| Table 1 Descriptive Statistics of Dependent and Independent Variables | |||||
| Variables | Mean | Standard Deviation | Min | Max | Number of Observation |
| Panel A: Dependent Variables | |||||
| ROE | 19.259 | 39.033 | -58.4 | 431.17 | 584 |
| ROS | 14.951 | 15.074 | -131.59 | 61.57 | 594 |
| ROI | 63.268 | 493.174 | -30.13 | 4218.98 | 73 |
| ROIC | 12.666 | 19.411 | -44.29 | 271.36 | 583 |
| CI | 4.907 | 7.259 | 0.23 | 64.87 | 594 |
| Panel B: Independent Variables | |||||
| CEM | 0.934 | 0.249 | 0 | 1 | 589 |
| WM | 0.676 | 0.469 | 0 | 1 | 589 |
| EM | 0.757 | 0.429 | 0 | 1 | 589 |
| CM | 0.564 | 0.496 | 0 | 1 | 589 |
| FLIQ | 2.165 | 1.809 | 0.38 | 16.41 | 502 |
| FSIZE | 6.757 | 0.84 | 4.89 | 9.58 | 594 |
| FLEV | 0.149 | 0.436 | 0 | 9.02 | 591 |
| FAGE | 18.808 | 10.306 | 0 | 44 | 594 |
The results of the Pearson Correlation Matrix indicate that ROE is positively related to ROS and ROIC and negatively related to firm size. Secondly, the correlation result of ROS shows it is positively related to ROIC, CI, firm liquidity and firm size. ROI and firm size are negatively related to each other. Yet, ROI shows a positive relationship with firm leverage. ROIC is negatively related to capital intensity and firm size, while positively correlated with firm liquidity. Lastly, CI is positively related to firm size and firm age and negatively related to firm leverage Table 2.
| Table 2 Pearson Correlation Matrix | |||||||||||||
| CEM | WM | EM | CM | ROE | ROS | ROI | ROIC | CI | FLIQ | FSIZE | FLEV | FAGE | |
| CEM | 1 | ||||||||||||
| WM | .297*** | 1 | |||||||||||
| EM | .375*** | .394*** | 1 | ||||||||||
| CM | .206*** | .297*** | .356*** | 1 | |||||||||
| ROE | .052 | -.013 | .080* | .132*** | 1 | ||||||||
| ROS | -.059 | -.066 | .017 | .074** | .223*** | 1 | |||||||
| ROI | .069 | -.130 | -.159 | .121 | -.009 | .005 | 1 | ||||||
| ROIC | .059 | .015 | .080* | .123*** | .897** | .203*** | -.016 | 1 | |||||
| CI | -.207*** | -.072* | -.119*** | -.061 | -.109*** | .216*** | -.145 | -.157*** | 1 | ||||
| FLIQ | .002 | .014 | -.029 | -.026 | .034 | .108** | 0 | .122*** | .071 | 1 | |||
| FSIZE | -.086** | .095** | .032 | .193*** | -.129*** | .216*** | -.196* | -.253*** | .545*** | -.240*** | 1 | ||
| FLEV | .031 | .051 | .056 | .092** | -.003 | -.050 | .568*** | -.029 | -.072* | -.083* | .089** | 1 | |
| FAGE | -.078* | .109*** | .019 | .106*** | .030 | -.008 | -.205* | .033 | .250*** | .005 | .330*** | -.010 | 1 |
**. Correlation is significant at the 0.05 level (2-tailed).
*. Correlation is significant at the 0.1 level (2-tailed).
Panel Regression Results
Table 3 presents all the baseline models estimation results. Firm size (FSIZE) has a significant negative relationship with the return on equity (ROE). This result is inconsistent with Dogan (2013) where they discover that firm size has a positive relationship with firm profitability. While, firm liquidity (FLIQ), firm leverage (FLEV), and firm age (FAGE) do not statistically significant on return on equity (ROE).
| Table 3 Estimation Results for Baseline Models | ||||
| Baseline model 1 | Baseline model 2 | Baseline model 3 | Baseline model 4 | |
| Variables | ROE | ROS | ROIC | CI |
| FLIQ | 0.076 | 0.610* | 0.712 | 0.207* |
| (3.748) | (0.362) | (2.000) | (0.111) | |
| FSIZE | -8.278** | -0.220 | -7.408*** | -0.386 |
| (3.593) | (8.272) | (2.455) | (2.206) | |
| FLEV | 1.288 | 0.355 | 0.336 | -0.011 |
| (1.632) | (0.319) | (1.146) | (0.047) | |
| FAGE | 0.334 | -1.018** | 0.254 | 0.118* |
| (0.268) | (0.488) | (0.159) | (0.060) | |
| CONSTANT | 63.389** | 30.828 | 56.160*** | 2.510 |
| (26.792) | (47.706) | (17.502) | (13.415) | |
| R-squared | 0.021 | 0.045 | 0.076 | 0.062 |
*Denotes statistically significant at 10% level of significance
**Denotes statistically significant at 5% level of significance
*** Denotes statistically significant at 1% level of significance
Firm liquidity (FLIQ) has a significant positive relationship with return on sales (ROS). This result is in line with a previous study by (Farooq, 2016). Besides that, firm age (FAGE) shows a significant negative relationship with return on sales. This result is consistent with the study by Pervan et al. (2017) where they found age negatively affect firm financial performance. Firm size (FSIZE) and firm leverage (FLEV) show no relationship with the return on sales.
Firm size (FSIZE) has a statistically negative relationship with return on invested capital (ROIC). The result is inconsistent with the study by Dogan (2013) where they discovered that firm size is positively related to firm profitability. Meanwhile, firm liquidity (FLIQ), firm leverage (FLEV) and firm age (FAGE) show no effect on ROIC.
Firm liquidity (FLIQ) showed a positive relationship at a 10% significance level on the capital intensity (CI). This implies that an increase of 1% in firm liquidity (FLIQ) would also increase 0.207% in capital intensity (CI). This result is supported by Farooq (2016) implied that liquidity and firm performance is significantly related to each other. On the other hand, firm age (FAGE) has a positive relationship at a 10% significance level on the capital intensity (CI). This implies that an increase of 1% in firm age (FAGE) would also increase 0.118% in capital intensity (CI). Consistent with the hypothesis by Ilaboya & Ohiokha (2016) implied that firm age and corporate financial performance is significantly related to each other. However, firm size (FSIZE) and firm leverage (FLEV) show no relationship with capital intensity (CI) at any level of significance in this research.
Table 4 exhibits that corporate environmental management has a significant positive effect on firm financial performance (ROE, ROIC). This result is supported by Karagozoglu and Lindell (2000), also implies a positive relationship between corporate environmental management and firm financial performance. Meanwhile, there is a negative effect of corporate environmental management on capital intensity. This consequence is in line with the study by Repetto (1990). After incorporating the corporate environmental management in full model 1, four controlled variables (FLIQ, FSIZE, FLEV, and FAGE) show identical results as the baseline models.
| Table 4 Estimation Results for Full Model 1 - CEM and Firm Financial Performance | ||||
| Full Model 1 | ||||
| Variables | ROE | ROS | ROIC | CI |
| CEM | 9.421* | -1.116 | 4.594* | -0.524** |
| (4.854) | (1.764) | (2.666) | (0.258) | |
| FLIQ | 0.105 | 0.617* | 0.718 | 0.210* |
| (3.739) | (0.362) | (1.998) | (0.113) | |
| FSIZE | -8.454** | -0.199 | -7.478*** | -0.360 |
| (3.589) | (8.427) | (2.460) | (2.205) | |
| FLEV | 1.086 | 0.341 | 0.283 | -0.016 |
| (1.444) | (0.326) | (1.169) | (0.047) | |
| FAGE | 0.357 | -0.998** | 0.260 | 0.125** |
| (0.260) | (0.495) | (0.159) | (0.062) | |
| CONSTANT | 59.914 | 31.437 | 52.045*** | 2.725 |
| (24.565) | (48.783) | (16.566) | (13.476) | |
| R-Squared | 0.024 | 0.044 | 0.078 | 0.067 |
* Denotes statistically significant at 10% level of significance
** Denotes statistically significant at 5% level of significance
*** Denotes statistically significant at 1% level of significance
Referring to the result in Table 5, carbon management and the financial performance of the firm show a statistically positive relationship. This indicates that carbon management disclosure will lead to higher firm financial performance (ROE, ROIC). This result is consistent with the study by (Ganda & Milondzo, 2018). This study revealed that there is proof demonstrate a positive effect of carbon management on the financial performance of the firm. while water management, energy management disclosure did not show any significant effect on firm performance.
| Table 5 Estimation Results for Full Model 2- WM, EM, CM and FIRM Financial Performance | ||||
| Full Model 2 | ||||
| Variables | ROE | ROS | ROIC | CI |
| WM | -7.933 | -0.550 | -2.348 | -0.016 |
| (9.349) | (1.658) | (3.530) | (0.205) | |
| EM | 6.012 | -1.353 | 2.428 | 0.054 |
| (5.673) | (1.701) | (2.322) | (0.283) | |
| CM | 15.566** | -0.261 | 8.092** | 0.039 |
| (7.449) | (1.446) | (3.385) | (0.199) | |
| FLIQ | 0.031 | 0.599 | 0.662 | 0.207* |
| (3.595) | (0.364) | (1.929) | (0.113) | |
| FSIZE | -10.708** | -0.598 | -8.715*** | -0.439 |
| (4.036) | (8.420) | (2.621) | (2.241) | |
| FLEV | 0.135 | 0.407 | -0.222 | -0.018 |
| (1.457) | (0.322) | (1.328) | (0.047) | |
| FAGE | 0.343 | -0.916* | 0.243* | 0.118* |
| (0.247) | (0.517) | (0.145) | (0.066) | |
| CONSTANT | 76.328*** | 33.182 | 60.243*** | 2.811 |
| (26.945) | (48.566) | (16.865) | (13.614) | |
| R-Squared | 0.058 | 0.047 | 0.114 | 0.063 |
* Denotes statistically significant at 10% level of significance
** Denotes statistically significant at 5% level of significance
*** Denotes statistically significant at 1% level of significance
Table 6 indicates that corporate environmental management has a statistically negative significant relationship with capital intensity. This result is in line with the study by (Repetto, 1990). Again, there is a positive effect of carbon management on the financial performance of the firm (ROE and ROIC). This result is consistent with the study by (Ganda & Milondzo, 2018). This study revealed that there is evidence of a positive effect of carbon management on the financial performance of the firm. While water management and energy management still did show any significant effect on firm performance.
| Table 6 Estimation Results for Full Model 3- CEM, WM, EM, CM and FIRM Performance | ||||
| Full Model 3 | ||||
| Variables | ROE | ROS | ROIC | CI |
| CEM | 6.467 | -0.204 | 2.342 | -0.602** |
| (6.137) | (2.370) | (3.157) | (0.296) | |
| WM | -8.404 | -0.537 | -2.519 | 0.022 |
| (9.642) | (1.742) | (3.632) | (0.202) | |
| EM | 5.229 | -1.329 | 2.145 | 0.126 |
| (5.298) | (1.848) | (2.223) | (0.298) | |
| CM | 15.627** | -0.262 | 8.115** | 0.036 |
| (7.481) | (1.443) | (3.393) | (0.199) | |
| FLIQ | 0.026 | 0.600* | 0.661 | 0.211* |
| (3.602) | (0.359) | (1.933) | (0.116) | |
| FSIZE | -10.716** | -0.559 | -8.718*** | -0.325 |
| (4.040) | (8.440) | (2.622) | (2.193) | |
| FLEV | 0.167 | 0.405 | -0.210 | -0.023 |
| (1.462) | (0.321) | (1.321) | (0.048) | |
| FAGE | 0.347 | -0.916* | 0.244* | 0.118* |
| (0.247) | (0.517) | (0.146) | (0.065) | |
| CONSTANT | 70.995*** | 33.096 | 58.311*** | 2.557 |
| (25.882) | (48.640) | (16.841) | (13.397) | |
| R-Squared | 0.059 | 0.047 | 0.115 | 0.068 |
* Denotes statistically significant at 10% level of significance
** Denotes statistically significant at 5% level of significance
*** Denotes statistically significant at 1% level of significance
Conclusion
The purpose of this research is to identify the linkage between corporate environmental management disclosures and the financial performance of the firm. This research investigated on top 100 public listed companies in Malaysia from the year 2012 to 2017. The findings of this research paper implied that a negative impact of corporate environmental management on capital intensity. The outcome of the finding is consistent with the study of Repetto (1990), this result may imply that corporate financial performance fall as the inputs of capital, labour and energy is being diverted to environmental management.
Moreover, we found a positive linkage between carbon management and corporate financial performance in Malaysia. This result is supported by (Ganda & Milondzo, 2018). They stated that companies that implement green investment initiatives will have lower carbon emissions and have a positive influence on firm financial performance. Furthermore, the highest 100 Malaysian listed companies are large market capitalization with stable and developed growth rates. Hence, including carbon management would benefit and boost firm performance. Therefore, the firm can take this initiative to implement a positive linkage between carbon management and corporate financial performance and indirectly support government initiatives in reducing carbon emissions. Malaysia government actively engage in several international agreements such as the Paris agreement (2016), Kyoto Protocol (2005), Montreal Protocol (1989) and climate summit in Copenhagen Denmark (2009) to reduce carbon emission.
Some suggestions have been suggested to advance future research. Firstly, future research could involve return on assets (ROA). This can help to improve better insights on Malaysian corporate's financial performance. Apart from that, future research studies could also examine the reverse linkage between corporate environmental management and the financial performance of the firm. It would be an amusing issue to determine the reverse relationship. It could be interesting to find out that whether disclosure of corporate environmental management items could increase the firm performance. Besides that, this study only analyzes the environmental management systems in the firm. In fact, there are more categories in environmental management such as treatment, policies, reduction and so on. Thus, these categories could be added in future research to reveal more knowledge in the field of corporate environmental management disclosures.
Acknowledgement
The authors would like to thank the Ministry of Higher Education Malaysia for providing the research grant. The project is under the Kementerian Pengajian Tinggi Malaysia, Fundamental Research Grant Scheme, RACER/1/2019/SS0l/UNIMAS//l.
References
Clark, S. E. (1990). How to survive in the environmental jungle. Institutional Investor. 24(16), 89-91.
Cowton, J., &Sandberg, S . (2012). Socially Responsible Investment. (2nd ed.). Encyclopedia of Applied Ethics.
Makower, J. (1993). The E factor: The Bottomline Approach to Environmentally Responsible Business', New York: Random House.
Nassar, I.A., Aimsafir, M.K., & Al-Mahrouq, M. (2014). The validity of Gibrat's law in developed and developing countries (2008-2013): Comparison based assessment. Procedia-Social and Behavioral Sciences,129, 266-273.
Palepu, K.G., Bernard V., & Healy, P.M. (1996). Business analysis and valuation using financial statement, Chapter 4 (Southwestern College Publishing, Cincinnati, Ohio).
Repetto, R. (1990). Deforestation in the tropic. Scientific American, 262(4), 36-42.