Research Article: 2019 Vol: 23 Issue: 3
Does Financial Inclusion Influence the Banks Risk and Performance? Evidence from Global Prospects
Fadi Shihadeh, Palestine Technical University
Bo Liu, Hunan University
Abstract
The aim of this study to examine whether financial inclusion influences banks' performance and risks. The study examined the relationship between enhancing the financial inclusion and banks performance and risk. The study used data from BankScope, World Bank economic development, and financial development databases for 189 countries and 701 banks. The study used the empirical approach to testify to the study hypothesis. The study presents global evidence that enhancing financial inclusion, with branches as the main tool for banking penetration, and other financial inclusion indicators could help the banks to achieve more return and decrease the risks. This evidence not only supports the global agenda to enhance financial inclusion but also encourages banks to invest in more branching and penetration. Therefore, policymakers can use these findings to develop their strategies in the expansion of the branches networks. Also, governments can play a vital role in developing the laws and procedures to enhance the banking penetration to reach more disadvantaged people. This study presents global evidence that enhancing the financial inclusion will positively affect the bank's activities as well as the disadvantaged life. Furthermore, this study covers the financial inclusion topic from the new novel, thus open a new field of research for further research.
Keywords
Bank Penetration, National Financial Inclusion, Branches, Risk, Performance.
JEL Classification
G21, E50.
Introduction
Studies of financial inclusion examine how the disadvantaged access and use formal financial services. Many published studies of financial inclusion have focused on individual socioeconomic characteristics and obstacles, analysing the effects of financial inclusion on poor populations and the determinants of financial inclusion among countries, economies, and regions. These studies have covered the demand side and, until now, there was no evidence on the supply side that enhancing financial inclusion would benefit banks as a main financial services provider. Hence, there is a need for evidence that will encourage banks to enhance financial inclusion by investing in additional branches.
Banks aims from penetration to attract deposits, reaching for more customer, offer direct and indirect credit services, and other services. Opening new branches allow banks to invest in technology and equipment, and to hire more staff. Thus, these benefits return to the local economy as it will enable individuals to access formal financial services, especially in disadvantaged areas. Through branches, banks can offer their services and receive feedback from their customers. Thus, enables them to innovate services that directed by banks to youth, women, craftsmen, and farmers, population groups that they are typically marginalized regarding access to credit. In offering these services through their branches, banks can earn more profits especially if this expansion comes with innovative services and suitable conditions for the loan, such as reasonable collateral requirements and cost of credit.
Therefore, banks invest their resources in service development and generate new services to address customer needs and achieve a suitable return to enhance their performance. Capital expenditure will increase as a result of this approach, and profit might decrease as a result of cost increment in the short run. Most banks cannot achieve earnings from this short-term development, but they aim to enhance them in the long term.
Reaching to the clients and attracting their deposits is one of the essential pillars of banks' philosophy as commercial firms. Banks depending on customers deposits on their investment, therefore they use these deposits on lending and another kind of investment. The bank profits come from the difference between interest and fees which received on services from one side and paid interest and fees on deposits and other financial sources. Therefore, banks looking to increase their deposits to enhance their ability to lend and thus earning more profits and improve the performance indicators.
Also, when banks plan to open a new branch or offer a new service, a primary objective should be achieving adequate return while minimising risks, i.e., covering the cost and increasing the total revenue, which leads to achieving the bank’s main goals. This study uses the bank’s branches as a penetration tool for financial inclusion to measure their influence on the bank’s performance and risks.Furthermore, we uses the bank branches per 100,000 individuals; formal account % at age 15 +; formal saving % at age 15 +, formal loans % age 15 +;credit cards % age 15+; and debit cards % age 15+, as national financial inclusion index. From this, we can derive the paper’s central question: does the financial inclusion enhance the bank’s performance and reduce its risks? This study’s central hypothesis is that financial inclusion, represented by banking penetration through the number of branches and national financial inclusion index, enhances the bank’s performance and reduces its risks. Answering the study question’s and testify the hypothesis will provide evidence for the influence of financial inclusion through banking penetration on the bank's risk and performance.
The current study will contribute to the financial inclusion literature, through open a new field of research regarding cover a new novel of the financial inclusion. Further, this study presents global evidence that enhancing financial inclusion will positively reflecting on the bank’s performance and risk. Also, the study linked the financial inclusion as the vital key to development and poverty alleviation with the bank’s activities. Therefore policymakers can develop the national agenda in cooperation with banks managers to enhance financial inclusion in line with bank’s target.
Literature Review
Berger et al. (1997) found that banks can be paid more upon branching and gain more revenue. Hensel (2003) found that the large banks can improve their cost utilisation through an expansion of the branching network. Hirtle (2007) reported that deposits increased as a result of expanding the branch network, and the cost of deposits declined for the same reason. Furthermore, there was no significant relationship between network size and overall institution profitability. Harimaya and Kondo (2012) pointed out that if regional banks do not expand their branches, they will yield low profits.
Nguyen (2014) concluded that bank branches are still fundamental, especially for disadvantaged communities, thus, closing the branch leads to lack of lending, especially for small firms. Bernini and Brighi (2017), presented evidence from Italy that more branches could enhance bank’s revenues, where expansion in branch networks will increase the banks cost especially in the cost of investment and human capital. Recently, Shihadeh et al. (2018) presented evidence from Jordanian banks that banks could enhance their performance through enhancing financial inclusion tool’s which used in the study (loans to SMEs, SMEs deposit’s, number of credit cards, and new services number of ATM services, number of ATMs). Furthermore, they are recommending more studies in this field with different variables regarding financial inclusion. Kim et al., (2018) used banking penetration, Availability, and usage as main dimensions of the financial inclusion. Meanwhile, the study used several indicators belong to these dimensions , such as: account (% age 15+); mobile account (% age 15+); ATMs (per 100,000 adults); branches (per 100,000 adults ); Credit card (% age 15+);Debit card (% age 15+). Therefore, they used these indicators to develop national financial inclusion index. The study focused on the effect of social inequality and religious on financial inclusion. They found that religion has a significant influence on financial inclusion. In the same line, Park and Mercado (2018), used the access, availability, usage, as main dimensions of financial inclusion, to present a new index among countries. The main finding that the financial development and economic growth have a nonlinear relationship with financial inclusion. Further, the results indicated that countries with a high index of financial inclusion had reduced the poverty percentage.
The previous studies covered several topics related to the variables in this study, such as bank branches, the bank branches per 100,000 individuals; formal account % at age 15 +; formal saving % at age 15 +, formal loans % age 15 +;credit cards % age 15+; and debit cards % age 15+. The current study found a gap among the financial inclusion literature which the previous studies focused on the analysis of the demand side but overlooked the supply side of financial inclusion. Therefore, this is essential motivations for this study to examine the relationship between financial inclusion and bank’s performance and risk to fill the gap in the financial inclusion literature.
Methodology
Data
Using BankScope, World Bank economic development, and financial development databases for 189 countries and 701 banks, including 240 banks from 2011 and 461 banks from 2014. Thus, link them to global financial inclusion indicators that were posted by the World Bank in 2011 and 2014. The limitation in our data is related to data availability for banks indicators which presents the financial inclusion (i.e., ATMs and POSs), while the number of branches for each bank is available through BankScope. Therefore, we use just the number of branches for every bank among countries as access indicator of supply side for financial inclusion. Furthermore, the study uses some indicators of financial inclusion on the country level and use these indicators as national financial inclusion index.
Independent Variables
The country financial inclusion index, which is bank branches per 100,000 individuals; formal account % at age 15 +; formal saving % at age 15 +, formal loans % age 15 +;credit cards % age 15+; and debit cards % age 15+, were used as national financial inclusion index (NFI), which indicates financial inclusion at the country level. Those six national-level financial inclusion indicators were reduced to one factor by principal component analysis. Because the study focuses on banking penetration as a financial inclusion indicator, we used the number of branches as a key variable for financial inclusion at the bank level. On the other hand, we used control variables that may affect the bank’s performance and risk at the bank level; these variables are the bank’s total assets; equity ratio (%); the capital ratio (%); and loans to deposits (%). In contrast, at the country level (as this study based on cross-sectional data), we used five banks’ asset concentration; GDP growth %; broad money growth %.
Dependent Variables
As an indicator of bank’s performance, we used the return on average assets (ROAA), return on average equity (ROAE), and net income, whereas the impaired loans, non-performance loans, as a percentage of gross loans, were a risk indicator. Given that performance and risk work in opposite directions, the banks should balance them to maximise the shareholders’ wealth as final targets for the companies.
The Estimation Models
Basing on the study’s question and testing our the hypothesis, we developed the study models. Therefore, to proceed with the empirical analysis, the study uses OLS and quantile technique, based on the following conditions:
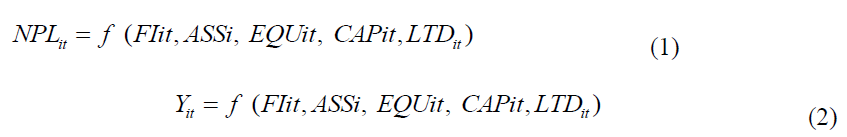
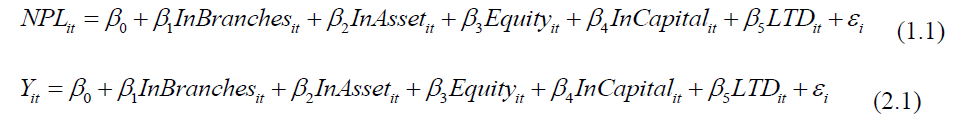
Therefore, re-estimating eqn. (1), by considering the number of branches as an indicator to present the financial inclusion. Thus, in our models (1.1) and (2.1), the data related to the banks were used to examine whether there is an effect on the banks’ performance and risk when branches are used as a financial inclusion indicator.
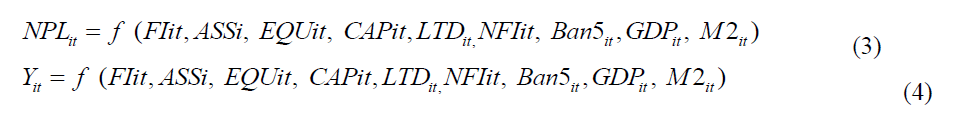
In the second stage, we re-write our main eqns. (1 and 2) by adding more national indicators as independent variables. Therefore, to capture all the variables which an impact on the banks’ performance and risk may have, we included more national variables in eqns. (3), and (4); in these equations, also we used the OLS technique, as it is more suitable for our data.
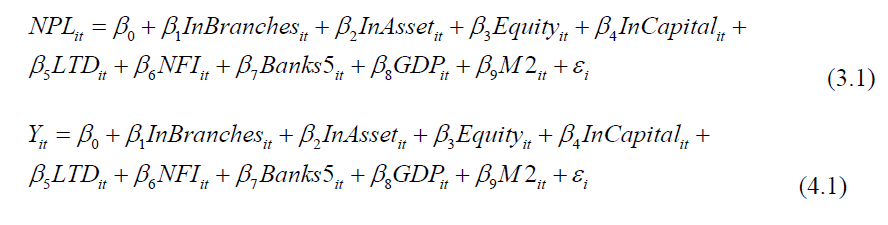
Therefore, re-estimating eqns. (3 and 4) by considering a number of branches as an indicator to present the financial inclusion. Thus, we have models (3.1) and (4.1) to examine the relationship between dependent and independent variables, as follows:
To obtain robust results, in what level of branches expansion, allows the banks to earn more and reduce the risks via financial inclusion, we used the quantile estimation technique to determine the banks’ performance and risk in models, basing on eqns. (3 and 4), thus the models becomes as follows:
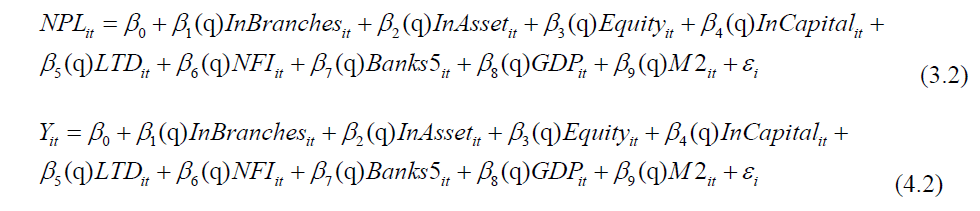
Where: NPL: non-performance loan (risk indicator),Y: performance indicators: average return on assets (ROAA), average return on equity (ROAE), and net income, branches: number of branches per bank, assets: banks total assets, equity: equity ratio, capital: capital ratio, LTD: percentage of loans to deposits, NFI: national financial inclusion index, banks 5: five banks assets concentration, GDP: % of GDP growth, M2: broad money growth%.
Empirical Study
The first part of this section, present the data description for all variables (dependent and independent). Further, the empirical analysis was presented in the second part for the models (1.1 to 4.2).
The Statistical Descriptive
Table 1 shows the descriptive statistics, including the mean, standard deviation, minimum and maximum observation for the outcomes and predictor variables. Appendix A presents the correlation coefficient matrix for the study variables. We can note that large coefficient comes between a number of branches and net income as a bank’s performance indicator. Whereas, the national financial inclusion index moving in the opposite direction for the bank's performance indicator with a small coefficient. Further, branches and national financial inclusion index moving in the opposite direction (decrease) with the non-performance loans as a risk indicator. In terms to test whether the multicollinearity problem existence in the study models, we use the variance inflation factor (VIF) test. The VIF result indicated that the mean VIF was 1.76. The result indicated that the multicollinearity problem did not exist in the independent variables in this study. Some existing studies addressed that the value of VIF should not be more than 10 (Hassan, 2009; Field, 2000, Shihadeh et al.,2018).
| Table 1: Descriptive Statistics | |||||
| Variables | Obs. | Mean | Std. Dev. | Min | Max |
|---|---|---|---|---|---|
| NPL | 701 | 7.003 | 10.979 | 0.058 | 95.801 |
| ROAA | 701 | 1.272 | 0.935 | 0.002 | 7.363 |
| ROAE | 701 | 12.210 | 7.291 | 0.009 | 49.979 |
| Net Income | 701 | 2.34e+11 | 1.60e+12 | 431000 | 2.42e+13 |
| lnbranches | 701 | 4.417 | 1.924 | 0.000 | 10.069 |
| lnassets | 701 | 26.180 | 2.969 | 19.481 | 34.382 |
| Equity ratio | 701 | 11.184 | 6.065 | 1.205 | 68.471 |
| lnCAP | 701 | 16.365 | 7.659 | 2.020 | 119.550 |
| LTD | 701 | 70.791 | 20.669 | 6.715 | 207.474 |
| NFI | 701 | 0.000 | 1.000 | 34.702 | 100.000 |
| Banks5 | 701 | 72.705 | 21.033 | 34.702 | 100.000 |
| GDP | 701 | 3.943 | 2.965 | -6.553 | 14.046 |
| M2 | 701 | 11.861 | 6.161 | -5.936 | 49.983 |
Sources: BankScope, World Bank economic development, and financial development databases.
Calculated by authors
Empirical Tests and Results
OLS estimation
Our analysis is as follows: in models (1.1) and (2.1), we include the branches as a financial inclusion factor with other control variables to examine whether the branches significantly influence banks’ risk. We add more variables in models (3.1) and (4.1), which present the national financial inclusion index and some macroeconomic indicators. In the Table 2, we present the OLS estimation results for models (1.1) to (3.1) these models present the regression results for risk as an outcome.
| Table 2: Ols Estimation Results For Models 1.1 To 3.1 | ||
|---|---|---|
| Variables | Risk Indicator- NPL | |
| Model | Model | |
| (1.1) | (3.1) | |
| Lnbranches | -0.401** | -0.382* |
| (0.215) | (0.235) | |
| Lnassets | -0.364*** | -0.288** |
| (0.135) | (0.136) | |
| Equity ratio | 0.141 | 0.0514 |
| (0.202) | (0.201) | |
| lnCAP | 0.321 | 0.342 |
| (0.216) | (0.228) | |
| LTD | -0.057** | -0.0341 |
| (0.023) | (0.0283) | |
| NFI 2011_2014 | -2.554*** | |
| (0.837) | ||
| banks5 | 0.0525** | |
| (0.0207) | ||
| GDP | -0.500*** | |
| (0.170) | ||
| M2 | 0.111 | |
| (0.0675) | ||
| Constant | 15.574*** | 9.388** |
| (4.372) | (4.730) | |
| Observations | 701 | 701 |
| R-squared | 0.125 | 0.153 |
standard errors in parentheses. *** p<0.01, ** p<0.05, * p<0.1. Sources: Sources: BankScope, World Bank economic development, and financial development databases. Calculated by authors.
In the above table, we note that, from the model (1.1), branches as a financial inclusion factor and our focal variable could reduce the bank’s risks by 40%. Specifically, more branches could reduce the risks resulting from impaired loans, whereas the assets could reduce the risks by 36%. Furthermore, the percentage of loans to deposits (LTD) could reduce the risks by 5.7%. In model (3.1) which includes national financial inclusion index and macroeconomic indicators, the regression results indicate that can decrease the bank risk by 38.2% and significant at 10%. We also can note that the national financial inclusion index can reduce the bank risk with a high coefficient (2.554). Further, the assets and GDP can reduce the bank risk by 29% and 50% respectively.
As we testified the influence of financial inclusion on risk among both level of financial inclusion (branches bank level) and (national financial inclusion country level). Therefore, Table 3 presents the OLS estimation results for the influence of financial inclusion on bank performance. Thus, Table 3 presents the micro-variables as independent variables linked with net income, ROAA, and ROAE as banks performance indicators.
| Table 3: Ols Estimation Results For Model 2.1 | |||
| Variables | Performance Indicators | ||
|---|---|---|---|
| ln Net Income | ROAA | ROAE | |
| Lnbranches | 0.131*** | 0.075*** | 0.864*** |
| (0.025) | (0.017) | (0.157) | |
| Lnassets | 0.995*** | - 0.002 | -0.040 |
| (0.014) | (0.013) | (0.108) | |
| Equity ratio | 0.058*** | 0.086*** | (0.004 |
| (0.014) | (0.013) | (0.071) | |
| lnCAP | -0.012 | -0.027*** | -0.069 |
| (0.007) | (0.008) | (0.048) | |
| LTD | -0.007*** | -0.007*** | -0.063*** |
| (0.001) | (0.002) | (0.013) | |
| Constant | -5.101*** | 0.993** | 15.034*** |
| (.370) | (0.418) | (3.12) | |
| Observations | 701 | 701 | 701 |
| Prob > F | 0.0000 | 0.0000 | 0.0000 |
| R-squared | 0.9187 | 0.1312 | 0.1104 |
Robust standard errors in parentheses. *** p<0.01, ** p<0.05, * p<0.1. Sources: Sources: BankScope, World Bank economic development, and financial development databases. Calculated by authors.
From the model (2.1), we note that increasing the number of branches could enhance the bank’s performance indicators by 13.1%, 7.5% and 86.4% for net income, ROAA, and ROAE respectively. Where, assets as a proxy has a positive influence on net income, while no relationship linked with ROAA and ROEA. Equity ratio as a proxy has a positive relationship with net income and ROAA, while no relationship linked with ROAE.
To achieve robust findings, in Table 4, we rerun the regression in the model (4.1) and get the same results as a model (2.1). The estimation results for the model (4.1) show that the branches could enhance the bank's performance indicators. Furthermore, more bank branches could increase net income, ROAA, and ROAE and enhance the bank’s performance by 8.6%,5%, and 62.2% respectively, whereas the national financial inclusion index could decrease the ROAE as a bank’s performance with a high coefficient. Meanwhile, there is no relationship linked the national financial inclusion index with net income and ROAA. From the above results, we can conclude that our estimations are robust.
| Table 4: Ols Estimation Results For Model 4.1 | |||
| Variables | Performance Indicators | ||
|---|---|---|---|
| ln Net Income | ROAA | ROAE | |
| lnbranches | 0.086*** | 0.050*** | 0.622*** |
| (0.024) | (0.020) | (0.174) | |
| lnassets | 0.995*** | -0.004 | -0.053 |
| (0.015) | (0.013) | (0.110) | |
| Equity ratio | 0.053*** | 0.079*** | -0.070 |
| (0.014) | (0.013) | (0.066) | |
| lnCAP | -0.008 | -0.020** | -0.016 |
| (0.008) | (0.008) | (0.047) | |
| LTD | -0.005*** | -0.004** | -0.038*** |
| (0.001) | (0.002) | (0.013) | |
| NFI 2011_2014 | -0.088 | -0.065 | -1.072** |
| (0.061) | (0.059) | (0.492) | |
| Banks-5 | 0.002 | 0.002 | 0.017 |
| (0.002) | (0.001) | (0.014) | |
| GDP | 0.069*** | 0.042*** | 0.325*** |
| (0.015) | (0.012) | (0.100) | |
| M2 | 0.013** | 0.033*** | 0.252*** |
| (0.006) | (0.011) | (0.079) | |
| Constant | -5.687*** | 0.272 | 9.155*** |
| (0.486) | (0.458) | (3.675) | |
| Observations | 701 | 691 | 691 |
| Prob > F | 0.0000 | 0.0000 | 0.0000 |
| R-squared | 0.9221 | 0.2102 | 0.2028 |
Robust standard errors in parentheses. *** p<0.01, ** p<0.05, * p<0.1. Sources: Sources: BankScope, World Bank economic development, and financial development databases. Calculated by authors.
Quantile estimation
In term to examine in which level of risk and performance banks can reduce risk and enhance their performance by enhancing penetration through branches and national financial inclusion index. Therefore, we use the quantile regression for NPL as a risk indicator and ROAA, ROAE, and net income. Table 5 presents the quantile estimation results for the model (3.2).
From Table 5, we find that there is no link between the branches and a bank’s risks in all quintiles, except in the first quintile, which means banks with fewer non-performance loans could reduce more risk with more branches. Whereas there is a relationship between national financial inclusion level and bank risk; consequently, financial inclusion may reduce the bank’s risks in all risk quintiles with advantages for the second and third quintiles. Further, for the risk level, national financial inclusion could decrease the bank’s risks in all risks quintiles.
| Table 5: Quintile Estimation Results For Model 3.2 | |||
| Variables | Risk indicator -NPL | ||
|---|---|---|---|
| Q-25 | Q-50 | Q-75 | |
| lnbranches | 0.165** | 0.191 | 0.242 |
| (0.0775) | (0.140) | (0.302) | |
| lnassets | -0.0813* | -0.242*** | -0.453** |
| (0.0481) | (0.0869) | (0.187) | |
| EQUITY_RATIO | 0.118*** | 0.169*** | 0.490*** |
| (0.0340) | (0.0614) | (0.132) | |
| CAP | -0.00506 | 0.0552 | 0.0395 |
| (0.0247) | (0.0446) | (0.0962) | |
| LTD | -0.00288 | -0.0116 | -0.0281 |
| (0.00640) | (0.0116) | (0.0249) | |
| NFI2011-2014 | -1.418*** | -2.365*** | -2.513*** |
| (0.239) | (0.431) | (0.929) | |
| Banks-5 | 0.0157*** | 0.0168 | 0.0207 |
| (0.00595) | (0.0107) | (0.0232) | |
| GDP | -0.284*** | -0.558*** | -1.035*** |
| (0.0465) | (0.0840) | (0.181) | |
| MC4 | -0.00598 | 0.0273 | 0.0121 |
| (0.0218) | (0.0394) | (0.0850) | |
| Constant | 2.604* | 8.348*** | 17.35*** |
| (1.511) | (2.729) | (5.885) | |
| Observations | 701 | 701 | 701 |
Standard errors presented in parentheses. *** p<0.01, ** p<0.05, * p<0.1. Sources: Sources: BankScope, World Bank economic development, and financial development databases. Calculated by authors.
Table 6 presents the quintile estimation results for the model (4.2). We note that banks in the first and second quintiles of (ROAA, ROAE, and net income) could enhance their performance with additional branches, i.e., enhance banking penetration through branching and thereby enhance financial inclusion; therefore, branching could enhance the performance of banks with a low and middle ROAA, ROAE, and net income. In the third ROAA quintile, which presents the highest ROAA, the effect of additional branches was insignificant but still positive. In short, banks that have achieved a high ROAA may not benefit from more branches; these banks may have reached the expansion limit that can improve the ROAA, Chang et al. (2011). Further, we find that there is no relationship between national financial inclusion and all banks performance indicators, except in the third quintile; the result is significant and negative.
| Table 6: Quintile Estimation Results For Model 4.2 | |||||||||
|---|---|---|---|---|---|---|---|---|---|
| Variables | ln Net Income | ROAA | ROAE | ||||||
| Q -25 | Q-50 | Q-75 | Q -25 | Q-50 | Q-75 | Q -25 | Q-50 | Q-75 | |
| lnbranches | 0.104*** | 0.073*** | 0.017 | 0.071*** | 0.064*** | 0.009 | 1.072*** | 0.852*** | 0.303 |
| (0.033) | (0.021) | (0.015) | (0.022) | (0.024) | (0.024) | (0.213) | (0.206) | (0.254) | |
| lnassets | 1.008*** | 0.998*** | 1.01*** | 0.001 | 0.001 | 0.014 | 0.043 | -0.034 | 0.107 |
| (0.020) | (0.013) | (0.009) | (0.014) | (0.015) | (0.015) | (0.132) | (0.128) | (0.158) | |
| EQUITY_RATIO | 0.067*** | 0.073*** | 0.073*** | 0.055*** | 0.075*** | 0.112*** | 0.020 | -0.111 | -0.177 |
| (0.014) | (0.010) | (0.007) | (0.009) | (0.012) | (0.011) | (0.093) | (0.091) | (0.112) | |
| CAP | -0.018* | -0.017** | -0.005 | -0.014** | -0.011 | -0.003 | -0.034 | 0.0196 | 0.016 |
| (0.010) | (0.007) | (0.005) | (0.008) | (0.008) | (0.008) | (0.068) | (0.066) | (0.081) | |
| LTD | -0.01*** | -0.006*** | -0.001 | -0.007*** | -0.004** | -0.001 | -0.063*** | -0.0283* | -0.030 |
| (0.003) | (0.002) | (0.001) | (0.002) | (0.002) | (0.002) | (0.017) | (0.017) | (0.021) | |
| NFI2011-2014 | -0.082 | -0.089 | -0.144*** | 0.062 | -0.029 | -0.206*** | 0.423 | -0.752 | -1.910** |
| (0.100) | (0.064) | (0.05) | (0.068) | (0.075) | (0.075) | (0.655) | (0.635) | (0.783) | |
| Banks-5 | 0.006** | -0.001 | -4.48e- | 0.005*** | 3.23e- | 0.001 | 0.039** | 0.010 | 0.018 |
| (0.003) | (0.002) | (0.002) | (0.002) | (0.002) | (0.002) | (0.016) | (0.016) | (0.019) | |
| GDP | 0.075*** | 0.036*** | 0.019** | 0.051*** | 0.045*** | 0.016 | 0.366*** | 0.438*** | 0.298* |
| (0.02) | (0.013) | (0.009) | (0.013) | (0.015) | (0.015) | (0.128) | (0.124) | (0.153) | |
| MC4 | 0.010 | 0.02*** | 0.022*** | 0.013** | 0.024*** | 0.038*** | 0.195*** | 0.220*** | 0.315*** |
| (0.01) | (0.006) | (0.004) | (0.006) | (0.007) | (0.007) | (0.060) | (0.058) | (0.072) | |
| Constant | -6.400*** | -5.328*** | -5.458*** | -0.171 | 0.0827 | -0.353 | 0.019 | 7.01* | 9.368* |
| (0.635) | (0.407) | (0.295) | (0.433) | (0.475) | (0.475) | (4.152) | (4.021) | (4.959) | |
| Observations | 701 | 701 | 701 | 701 | 701 | 701 | 701 | 701 | 701 |
Standard errors in parentheses. *** p<0.01, ** p<0.05, * p<0.1. Sources: Sources: BankScope, World Bank economic development, and financial development databases. Calculated by authors.
Conclusion And Policy Implications
In this paper, we examine the influence of banking penetration, measured by branches as one of the main financial inclusion indicators, and national financial inclusion index on banks’ performance and risk. We have run two regression techniques to achieve robust results and have examined two levels of financial inclusion: the bank level and national level. From the results, we can conclude that enhancing financial inclusion through bank branching could enhance the bank’s performance and reduce risks. The results indicated that the effect of financial inclusion is clear on the bank’s risk than bank’s performance, especially since we take the national financial inclusion index. Therefore, banks can bank invest more in their channels and tools to deliver the financial services. Moreover, enhancing the financial inclusion indicators such as; branches; formal account; formal saving; formal loans; credit cards; and debit cards regarding decreasing their risk and enhance their performance.
Our results support the global pattern of enhancing financial inclusion and encourage the financial services providers to cooperate with the government and formal institutions in this issue; thus, policymakers could draw their financial inclusion strategies on these results. Therefore, we recommend more empirical studies in different economies and regions, where the main obstacles for research are data availability and that banks’ data collection is primarily manual, especially in developing countries. Also, we recommend more studies related to regions and link the bank's performance with region’s level regarding financial inclusion. Thus the results could reflect the relationship between demand and supply side of financial inclusion.
Moreover, banks managers can develop their strategies to expand bank networks to enhance banks performance and reduce risks. Meanwhile, policymakers in the country could encourage banks to open more branches to achieve a better level of financial inclusion as a way to reach sustainable development, and also to enhance bank’s profits and performance and decrease risks.
| Appendix AThe Correlation Matrix | |||||||||||||
|---|---|---|---|---|---|---|---|---|---|---|---|---|---|
| Variables | Performance indicators | Risk Indicator | Independent Variables | ||||||||||
| ROAA | ROEA | Net Income | NPL | Branches | Assets | Equity ratio | CAP | LTD | NFI2011-2014 | Banks-5 | GDP | MC4 | |
| branches | 0.039 | 0.269 | 0.537 | -0.195 | 1 | ||||||||
| assets | -0.021 | 0.15 | 0.952 | -0.210 | 0.517 | 1 | |||||||
| Equity Ratio | 0.26 | -0.203 | -0.269 | 0.271 | -0.356 | -0.334 | 1 | ||||||
| CAP | 0.13 | -0.176 | -0.234 | 0.305 | -0.278 | -0.278 | 0.789 | 1 | |||||
| LTD | -0.017 | -0.219 | -0.159 | 0.002 | -0.146 | -0.145 | 0.384 | 0.248 | 1 | ||||
| NFI2011-2014 | -0.206 | -0.275 | -0.229 | -0.067 | -0.285 | -0.171 | 0.027 | 0.029 | 0.259 | 1 | |||
| Banks-5 | -0.024 | -0.056 | -0.180 | 0.117 | -0.062 | -0.196 | 0.073 | 0.078 | -0.014 | 0.152 | 1 | ||
| GDP | 0.181 | 0.314 | 0.360 | -0.167 | 0.405 | 0.296 | -0.219 | -0.178 | -0.131 | -0.372 | -0.130 | 1 | |
| M2 | 0.265 | 0.284 | 0.094 | 0.011 | 0.001 | 0.049 | -0.049 | -0.111 | -0.105 | -0.354 | -0.315 | 0.314 | 1 |
Acknowledgement
We thank the anonymous reefers for their comments and suggestions . Further , we thank the journal editor and editorial office for their guidance.
Fadi Shihadeh*, Department of Computerized Financial and Banking Science, Business and Economics Faculty, Palestine Technical University, Tulkarm, Palestine
Corresponding author can be contacted at: fadih20@gmail.com.
Bo Liu, School of Finance and Statistics, Hunan University, Hunan, Changsha 410082, China.
References
- Allen, F., Demirgüç-Kunt, A., Klapper, L., & Peria, M.S.M. (2016). The foundations of fnancial inclusion: understanding ownership and use of formal accounts. Journal of Financial Intermediation, 27, 1-30.
- Berger, A.N., Leusner, J.H., & Mingo, J.J. (1997). The efficiency of bank branches.Journal of Monetary Economics, 40(1), 141-162.
- Bernini, C., & Brighi, P. (2017). Bank branches expansion, efficiency and local economic
- Growth.Regional Studies, 1-14.
- Chang, K.C., Lin, C.L., Cao, Y., & Lu, C.F. (2011). Evaluating branch efficiency of a Taiwanese bank using data envelopment analysis with an undesirable factor.African Journal of Business Management, 5(8), 3220-3228.
- Field, A. (2000). Discovering statistics: Using SPSS for Windows (First Edition). LONDON, U.K.:SAGE.
- Shihadeh., F.H.,& Hannon, A., Guan, J., Ul Haq I., & Wang X. (2018).Does Financial Inclusion Improve the Banks’ Performance? Evidence from Jordan, in John W. Kensinger(ed.) Global Tensions in Financial Markets (Research in Finance, Volume 34) Emerald Publishing Limited, 117-138.
- Hassan, M.K. (2009). UAE corporations-specific characteristics and level of risk disclosure. Managerial Auditing Journal, 24(7), 668-687.
- Hirtle, B. (2007). The impact of network size on bank branch performance. Journal of Banking
- & Finance, 31(12), 3782-3805.
- Hensel, N.D. (2003). Strategic management of cost efficiencies in networks: Cross?country evidence on europeanbranch banking.European Financial Management, 9(3), 333-360.
- Harimaya, K., & Kondo, K. (2012). The effects of branch expansion on bank efficiency: Evidence from Japanese regional banks. Managerial Finance, 42(2). 23-33.
- Kim, D.W., Yu, J.S., & Hassan, M.K. (2018). The influence of religion and social inequality on financial inclusion. The Singapore Economic Review. Forthcoming. Retrievedfrom https://doi.org/10.1142/S0217590817460031.
- Nguyen, H.L.Q. (2014). Do bank branches still matter? The effect of closings on local economic outcomes. Department of Economics, Massachusetts Institute of Technology, Cambridge, MA.
- Park, C.Y., & Mercado, V.R. (2018). Financial Inclusion: New Measurement and Cross Country Impact Assessment. Working paper (539) Asian Development Bank.