Research Article: 2023 Vol: 22 Issue: 2
Does Green Entrepreneurship Ecosystem have Causal Association with Economic Development? Evidence from Country-wise Panel Data Investigation
Ajay Kumar Singh, DIT University
Sanjeev Kumar, DIT University
Aditya Kumar Sharma, DIT University
Citation Information: Singh, A.K., Kumar, S., & Sharma, A.K. (2023). Does Green Entrepreneurship Ecosystem have Causal Association with Economic Development? Evidence from Country-wise Panel Data Investigation. Journal of International Business Research, 22(2), 1-18.
Abstract
Scientific research community reported that sustainable development cannot be achieve without adopting extensive practices of green entrepreneurship in production activities. Green entrepreneurship is crucial to increase green growth and environmental sustainability which generate a conducive path for sustainable development. Green entrepreneurship is also valuable to increase social, economic and environmental development. Though, the measurements of green entrepreneurship ecosystem and to determine its indicators are difficult and controversial. Existing studies introduced hypothetical outline to examine the association of green entrepreneurship ecosystem with economic development. Inadequate studies could provide the comparative performance of green entrepreneurship ecosystem and assess its determinants across countries. Few studies could examine the casualty between green entrepreneurship ecosystem and economic development using robust empirical model. Thus, this study was considered to address some relevant research questions and achieve specific objectives to fill aforementioned research gap. It creates green entrepreneurship ecosystem index (GEEI) as an integrated-index of 43 indicators linked with environmental sustainability development, entrepreneurship ecosystem and green entrepreneurship ecosystem for certain 34 countries during 2000–2019. Composite Z-score and principal component analysis were applied to create GEEI. Subsequently, log-linear regression model was used to examine cause-and-effect relationship between GEEI and economic development including certain independent variables through a country-wise panel data.
Keywords
Economic Development; Ecosystem Services; Environmental Development; GREEN Economy; Sustainability; Green Entrepreneurship Ecosystem; Sustainable Development.
Introduction
Entrepreneurship ecosystem is a set of actors which are useful to nurture the appropriate business ecosystem (Singh & Ashraf, 2020). It is also useful to create new ventures, business opportunities, business ecosystem and new market in a nation. Thus, it has a substantial contribution to boost the economic and development growth in several ways (Omoruyi et al., 2017). Subsequently, it works as a backbone to increase the growth of manufacturing sector. It also provides a suitable platform to create extensive employment for skilled and unskilled labours. Thus, entrepreneurship ecosystem is necessary to maintain the structural change in society (Zahedi & Otterpohl, 2015). Moreover, socio-economic structure, strong IPRs regime, science & technological activities, innovation, political stability and government policies towards business activities are the crucial drivers to boost the entrepreneurship ecosystem (Singh & Ashraf, 2020). It is also evident that most innovationdriven economies like Netherlands, Switzerland, United Arab Emirates, Finland, Canada, Austria, United States, Belgium, Ireland, Germany, and France have beater entrepreneurship ecosystem as compared to factor-driven and efficiency driven economies. Innovation-driven economies are pursuing strong IPRs regime to nurture a better infrastructure of science & technological advancement and technology transfer (Singh & Ashraf, 2020). Subsequently, these economies are using science & technologies and innovation to produce high-tech, and innovative goods and services. Thus, most developed countries are capable to maintain their better performance in entrepreneurship ecosystem as compared to developing countries.
Furthermore, economic development and creation of more employment for workforce are directly linked with entrepreneurship ecosystem (Singh & Ashraf, 2020). Existing evidence emphasized that appropriate entrepreneurship ecosystem creates a high possibility to increase economic development (Audretsch et al., 2015; Dhahri & Omri, 2018). Therefore, most countries desire to achieve high economic growth to increase economic development (Singh et al., 2020a). Economic growth reflects the overall economic development of a country. However, it is also factual that economic development is a multidimensional concept which have positive impact on education, health and food security, per capita income, infrastructural development, basic livelihood requirement and social welfare (Singh et al., 2020b; Singh et al., 2021). Moreover, most countries are executing their policies to achieve faster economic growth due to globalization, international trade, growing population and increasing extensive competition worldwide.
The descriptive and empirical findings of previous studies found several positive implications of entrepreneurship ecosystem on social-economic development. As entrepreneurship ecosystem is useful to increase new business, start-ups ecosystem, new market, new products and innovation. Subsequently, it is effective to create jobs for skilled and unskilled workforce. Hence, entrepreneurship ecosystem is an essential driver to increase the social and economic development (Audretsch et al., 2015; Omoruyi et al., 2017; Dhahri & Omri, 2018). Furthermore, it is conducive to increase technology transfer and commercialization from research institutions to industries. Accordingly, entrepreneurship ecosystem nurtures a path for science & technological development which have positive impact on manufacturing sector and industrial development. Consequently, appropriate entrepreneurship ecosystem has positive impact on economic, social and technological dimensions, and negative impact on environmental dimension of sustainable development (Dhahri & Omri, 2018).
High industrialization is greater contributor of greenhouse gas (GHGs) in the atmosphere; thus, it may be caused to reduce environmental development and ecosystem services (Singh et al., 2019; Singh et al., 2020a). Moreover, environmental development and ecosystem services are being adversely affected due to population growth, urbanization, infrastructural development, labour migration from rural area to urban area, modernization of agricultural sector and extensive pressure of population on agricultural and its sector. As to maintain sustainability in environmental factors and ecosystems services are essential to increase sustainable development (Karimi & Chashmi, 2019; Singh et al., 2021). Hence, it is witnessed that there would be a challenge for global economies to achieve a path of sustainable development in future. Most countries, therefore, initiated to apply green, environmental and appropriate technology, and green innovation in factor of production to reduce environmental degradation (Ebrahimi & Mirbargkar, 2017; Galindo-Martín et al., 2020; Alwakid et al., 2021). Subsequently, aforesaid initiatives would be essential to increase the practices of green entrepreneurship ecosystem in production activities to increase sustainability in ecological and environmental factors. If global countries do not increase practices of green technology and green practices in production activities, then it would be grave for ecosystem services and environmental factors (Zahedi & Otterpohl, 2015). As sustainability is associated with social, economic and environmental aspects in production, business and other activities of firms (Zahedi & Otterpohl, 2015; Zeng & Ren, 2022). Thus, sustainability of manufacturing firms highly depends upon green entrepreneurship or green practices (Yin et al., 2022). Consequently, green entrepreneurship and green innovation would be helpful to increase the development of SMEs (Ebrahimi & Mirbargkar, 2017). Furthermore, practices of green entrepreneurship would be supportive to increase green growth and transformation of a country towards green economy (Onsay, 2021). Therefore, green entrepreneurship ecosystem will sustain the quality of natural resources and reduce environmental degradation (Saari & Joensuu-Salo, 2019).
Previous evidence indicate that initiation of green entrepreneurship ecosystem would be useful in several dimensions. It would be useful to increase sustainability in production activities of all sectors of a country. It would increase the transformation of country towards green growth and green economy. As sustainable development is an integrated part of economic, social, environmental, science & technological and institutional development (Singh et al., 2019; Singh & Kumar, 2022). Thus, green entrepreneurship ecosystem would have positive impact on social-economic development. Further, it would be helpful to augment the growth of industrial sector as sustaining the common property of ecosystem services. Furthermore, green entrepreneurship would be useful to develop green product innovation and process innovation (Skordoulis et al., 2022). Therefore, it is reasonable to accept that the prime aim of green entrepreneurship ecosystem is to provide protection of environmental and ecosystem services (Zeng & Ren, 2022). Consequently, the practices of green entrepreneurship would be highly supportive for global countries to achieve the 17 different goals of SDGs which are proposed by UNDP (Söderholm, 2020; Singh & Kumar, 2022).
Previous studies and international organization have used different words such as sustainable entrepreneurship, environmental entrepreneurship, eco-entrepreneurship, ecological entrepreneurship, green growth, enviro-entrepreneurship or sustainentrepreneurship, green GDP and green economy to define or explain green entrepreneurship ecosystem (OECD, 2011; Zahedi & Otterpohl, 2015; Saari & Joensuu-Salo, 2019). The core motivation of aforesaid activities is to solve social and environmental problems and add more economic value as increasing sustainability in ecological resources (Zahedi & Otterpohl, 2015). Sustainable entrepreneurship looking for successful business which do not have negative impact on environment and solve social problems. Eco-entrepreneurship contributes to solve environmental problems and create value for society (Zahedi & Otterpohl, 2015). Green entrepreneurship emphasis to increase more practices of new technology or green technology or carbon-free technology to minimize the overwhelming use of natural resources in production activities (Söderholm, 2020). Saari & Joensuu-Salo (2019) green entrepreneurship is a system which is useful to provide the solution for environmental problems and increase social changes. Green economy is an agenda to increase economic growth and development which do not have adverse impact on social wellbeing and environment (Söderholm, 2020). Thus, green entrepreneurship cannot be disconnected from the three pillars of sustainable development i.e., social, economic and environment (Zahedi & Otterpohl, 2015; Doma?ska et al., 2018).
As green economy or green growth is a significant component of green entrepreneurship ecosystem. Sustainable entrepreneurship is an application of scientific process, techniques and methods which solve social, economic and environmental related issues in production activities in all sectors (?yigün, 2015). Electricity, renewable sources of energy, renewable source of water, environmental technology, green technology and appropriate technology are crucial to create green entrepreneurship ecosystem (Demirel et al., 2019; Singh et al., 2022c). Although, existing researchers could not develop a scientific methods or techniques to measure the green entrepreneurship ecosystem. Thus, scientific research community should develop conceptual framework and method to evaluate the performance of green entrepreneurship ecosystem. Thereupon, researchers can examine the impact of green entrepreneurship ecosystem on economic development. However, previous studies have applied different indicators such as per capita CO2 emissions, energy intensity, green technology, green products and green innovation to assess the impact of green entrepreneurship ecosystem on social-economic development and sustainability of manufacturing firms in different countries. The empirical findings of previous studies argued that green entrepreneurship ecosystem is useful to increase social-economic development and environmental development.
Existing studies could not provide the universally accepted indicators and develop method for measuring the green entrepreneurship ecosystem. Despite that, studies could examine the influence of green entrepreneurship ecosystem on economic and sustainable development using some proxy variables for green entrepreneurship (e.g., Ebrahimi & Mirbargkar, 2017; Doma?ska et al., 2018; Demirel & Danisman, 2019; Karimi & Chashmi, 2019; Moya-Clemente et al., 2020; Nuringsih et al., 2020; Alwakid et al., 2020, Alwakid et al., 2021; Onsay, 2021, Tawiah et al., 2021; Yin et al., 2022; Zeng & Ren, 2022; Skordoulis et al., 2022). Green entrepreneurship ecosystem depends upon several activities which are helpful to increase transformation a country towards green growth (Tawiah et al., 2021; Onsay, 2021). Hence, impact of green entrepreneurship ecosystem on social-economic development cannot be capture by a specific indicator of green entrepreneurship. Therefore, this study addressed the answer on following research questions:
• What are the key determinants of green entrepreneurship ecosystem?
• What is comparative performance of selected countries in green entrepreneurship ecosystem?
• Does green entrepreneurship ecosystem have cause-and-effect relationship with economic development?
• How global economies can nurture a path of green entrepreneurship ecosystem?
• Why global economies are required to pursue green entrepreneurship ecosystem?
• With relevance to aforesaid research questions, this study achieved following objectives:
• To develop green entrepreneurship ecosystem index (GEEI) for selected countries during 2000 – 2019 using composite Z-score and principal component analysis.
• To explain the relative performance of green entrepreneurship ecosystem of selected economies in term of GEEI.
• To examine the impact of green entrepreneurship ecosystem on economic development and vice-versa using log-linear regression models.
Research Methods and Materials
Rationality of Selected Variables for GEEI Estimation
Previous studies have used different variables such as green technology, environmental technology, sustainable energy, energy intensity, etc. to define green entrepreneurship ecosystem (OECD, 2011; Ahmad et al., 2015; Nuringsih et al., 2020; Alwakid et al., 2021). Scientific research community proved that green entrepreneurship may not be observed by a single variable. Therefore, this study develops green entrepreneurship ecosystem index (GEEI) to avoid the discrepancy of existing studies. For this, green entrepreneurship ecosystem associated indicators were selected based on existing literature. This study gave significant priority on 12 indicators which have significant influence on entrepreneurial behaviour and attitudes of entrepreneurs, and entrepreneurship ecosystem as per Global Entrepreneurship Monitor (GEM). These indicators were also used by Singh and Ashraf (2020) to develop entrepreneurship ecosystem index across countries. Thereupon, several indicators such as per capita CO2 emissions, energy intensity, environmental technology, green technology, and other are also supportive to increase environmental development and sustainability in ecosystem services (Singh et al., 2019; Singh et al., 2020a; Söderholm, 2020; Singh et al., 2021; Singh & Kumar, 2022). For instance, Singh et al. (2019) considered 25 indicators to develop the environmental sustainability index for 22 Asian countries. Singh et al. (2020a) developed environmental sustainability development index (ESDI) using 33 indicators which were associated with environmental development. Singh et al. (2021) considered 41 indicators to create environmental sustainability index in 39 across countries. Singh & Kumar (2022) also constructed ESDI as composition of 42 different variables which were supposed to increase environmental development.
Furthermore, factors associated with environmental development can be used as proxy variables for green entrepreneurship ecosystem. To maintain air quality as abating CO2 emissions from various sources may be a better practice of green entrepreneurship ecosystem. It is also reported that environmental development is expected to be increased as CO2 emission decreases (Dhahri & Omri, 2018). Therefore, CO2 emissions from various sources were used to develop GEEI as assuming that lesser CO2 emitter countries are adopting better practices of green entrepreneurship. Availability of clean fuels and technologies for cooking, access to electricity, renewable energy consumption, renewable internal freshwater resources, energy intensity, and environment-related technologies are also conducive to increase green entrepreneurship ecosystem. Subsequently, 43 indicators associated with environmental sustainability development, entrepreneurship ecosystem and green entrepreneurship were considered to develop GEEI in this study Table 1.
| Table 1 Explanation Of Indicators Associated With Green Entrepreneurship Ecosystem |
||||
|---|---|---|---|---|
| Source of Data | Category of indicators | Indicator Name | Units | Symbol |
| WDI | Environmental sustainability development |
Energy use (kg of oil equivalent per capita) | % | EUKOEPC |
| CO2 emissions (kg per 2015 US$ of GDP) | Kg. | CDGEKPGDP | ||
| CO2 emissions (metric tons per capita) | Metric tons | CDGEMTPC | ||
| CO2 emissions from gaseous fuel consumption (% of total) | % | CDGEGFC | ||
| CO2 emissions from manufacturing industries and construction (% of total fuel combustion) | % | CDGEMIC | ||
| CO2 emissions from residential buildings and commercial and public services (% of total fuel combustion) | % | CDGERBCPS | ||
| CO2 emissions from solid fuel consumption (% of total) | % | CDGESFC | ||
| CO2 emissions from transport (% of total fuel combustion) | % | CDGET | ||
| CO2 intensity (kg per kg of oil equivalent energy use) | Kg. | CDGEKPKOEU | ||
| CO2 emissions per unit of manufacturing value added (kilogrammes of CO2 per constant 2015 United States dollars) | Kg. | CDGEPUMVA | ||
| Combustible renewables and waste (% of total energy) | % | CRWPTE | ||
| Fertilizer consumption (kilograms per hectare of arable land) | Kg/Ha. | FCPHAL | ||
| Fossil fuel energy consumption (% of total) | % | FFECPT | ||
| PM2.5 air pollution, mean annual exposure (micrograms per cubic meter) | Micrograms per cubic meter | PM2.5APMAE | ||
| GEM | Entrepreneurship Ecosystem |
PM2.5 air pollution, population exposed to levels exceeding WHO guideline value (% of total) | Micrograms per cubic meter | PM2.5APPELEWHO |
| Basic school entrepreneurial education and training | Number | BSEET | ||
| Commercial and professional infrastructure | Number | CPI | ||
| Cultural and social norms | Number | CSN | ||
| Financing for entrepreneurs | Number | FE | ||
| Governmental programs | Number | GP | ||
| Governmental support and policies | Number | GSP | ||
| Internal market dynamics | Number | IMD | ||
| Internal market openness | Number | IMO | ||
| Physical and services infrastructure | Number | PSI | ||
| Post school entrepreneurial education and training | Number | PSEET | ||
| R&D transfer | Number | RDE | ||
| Taxes and bureaucracy | Number | TB | ||
| WDI | Green Entrepreneurship |
Access to clean fuels and technologies for cooking (% of population) | % | ACFTC |
| Access to electricity (% of population) | % | AEPP | ||
| Electric power consumption (kWh per capita) | kWh | EPCPC | ||
| Electricity production from coal sources (% of total) | % | EPFCSPT | ||
| Electricity production from hydroelectric sources (% of total) | % | EPFHSPT | ||
| Electricity production from natural gas sources (% of total) | % | EPFNGSPT | ||
| Electricity production from oil sources (% of total) | % | EPFOSPT | ||
| Electricity production from oil, gas and coal sources (% of total) | % | EPFOGCSPT | ||
| Electricity production from renewable sources, excluding hydroelectric (% of total) | % | EPFRSEHPT | ||
| Renewable electricity output (% of total electricity output) | % | REOPTEO | ||
| Renewable energy consumption (% of total final energy consumption) | % | RECPTFEC | ||
| Renewable internal freshwater resources per capita | Cubic meters | RIFWRPC | ||
| SDGs | Energy intensity level of primary energy (megajoules per constant 2017 purchasing power parity GDP) | megajoules | EILPE | |
| OECD | Production-based CO2 productivity, GDP per unit of energy-related CO2 emissions (US dollars per kilogram, 2015) | US $/Kg. | PBCO2P | |
| Development of environment-related technologies, % all technologies (%) | % | DERTPAT | ||
| WIPO | Share of patent grants in environmental technology with total patent grants in all sector (%) | % | SPGETTPGAT | |
Source: Author's compilation based on existing studies such as OECD (2011), Ahmad et al. (2015), Doma?ska et al. (2018), Dhahri & Omri (2018), Demirel & Danisman (2019), Singh et al. (2019), Söderholm (2020), Singh et al. (2020a), Nuringsih et al. (2020), Alwakid et al. (2020), Alwakid et al. (2021), Singh et al. (2021), Singh & Kumar (2022), and Skordoulis et al. (2022).
Brief Overview of Selected Countries
This study considered data for various indicators associated with green entrepreneurship ecosystem, economic development and allied activities during 2000-2019. Therefore, this study could consider only those countries which have the related data on selected indicators during the said period. Accordingly, 34 countries were found suitable to be included in this study. The list of selected countries with their income group and regions is given in Table 2.
| Table 2 List Of Selected Countries |
||
|---|---|---|
| List of Countries | Income group of the Country | Region of the Country |
| Japan | High income: OECD | Asia and the Pacific |
| Croatia | High income: non-OECD | Central and Southeast Europe |
| Greece | High income: OECD | |
| Portugal | ||
| Austria | Central Europe | |
| Hungary | ||
| Luxembourg | ||
| Poland | ||
| Spain | ||
| China | Upper middle income | East Asia & Pacific |
| Latvia | Europe & Central Asia | |
| Lithuania | ||
| Norway | High income: OECD | |
| Romania | Upper middle income | |
| Russian Federation | ||
| Switzerland | High income: OECD | |
| Argentina | Upper middle income | Latin America and Sub-Saharan Africa |
| Brazil | ||
| Mexico | ||
| South Africa | ||
| United States of America | High income: OECD | |
| Tunisia | Upper middle income | Middle East & North Africa |
| Canada | High income: OECD | North America |
| Estonia | Northern Europe | |
| Australia | Northern European and Pacific oceans | |
| Finland | ||
| Sweden | ||
| Netherlands | Northwestern Europe | |
| United Kingdom | ||
| India | Lower middle income | South Asia |
| Belgium | High income: OECD | Western European |
| Denmark | ||
| France | ||
| Germany | ||
Source: Author's compilation based on availability of required data for listed countries.
Description of Data Sources
Information on green entrepreneurship ecosystem associated indicators and other relevant variables for 34 countries were derived from the official website of World Development Indicators (World Bank) Global Entrepreneurship Monitor (GEM); Global Entrepreneurship and Development Institute (GEDI); intellectual property rights (IPRs) and science & technological related data were taken from the website of World Intellectual Property Organization and The Organisation for Economic Co-operation and Development (OECD). Interpolation and extrapolation techniques were applied to examine the middle values for those variables which have the missing terms (Kumar et al., 2017; Singh & Ashraf, 2020; Singh et al., 2021; Singh et al., 2022a,b).
Theoretical Framework of Index-Based Estimation
Index–based estimation is most influential technique to integrate most related variables to define or measure the overall performance of a social-economic phenomenon. Social development, economic development, human development, environmental development, technological development, institutional development, food security, health security, and others may not be evaluated by a specific variable. Therefore, index-based estimation may be a crucial tool in the hand of policy makers to formulate an integrated policy to achieve a desired goal in specific activity (Kumar et al., 2017; Singh et al., 2019; Singh et al., 2020a). Formation of Human Development Index (HDI) in 1990 by United Nations Development Programmes (UNDP) was a significant creativity in this field (Roser, 2014). The HDI was an integration of literacy rate, per capita GDP and life expectancy tare. The UNDP used simple descriptive statistical technique to develop HDI. Thereafter, scientific research community develop several indexes such as food security index (Kumar et al., 2017), happy planet index consumption (Zahedi & Otterpohl, 2015), sustainable livelihood security index (Singh & Issac, 2018; Singh et al., 2022b), agricultural sustainability index (Singh et al., 2022a), environmental sustainability index (Singh et al., 2019), environmental performance index Galindo-Martín et al. (2020), environmental sustainability development index (Singh et al., 2020a; Singh & Kumar, 2022), social development index (Singh & Kumar, 2022), economic development index (Singh and Kumar, 2022), entrepreneurship ecosystem index (Singh & Ashraf, 2020), science & technological development index (Singh et al., 2020a; Singh & Kumar, 2022), agricultural trend index (Alwakid et al., 2021), intellectual property awareness index (Singh et al., 2020b), green growth index, inclusive green growth index and global green economy index.
Previous studies used composite Z-score method (CZSM), simple descriptive statistical analysis, principal component analysis (PCA) and factor component analysis to develop various indexes. CZSM and PCA include composite-score of specific set of variables in index-estimation (Singh & Ashraf, 2020; Singh et al., 2022b). Therefore, researchers can make the relative performance of an individual indicator across entities. Also, the PCA technique is useful to examine the performance of factors based on their eigenvalues, percentage variation and cumulative variation (Kumar et al., 2017; Singh et al., 2022b). Furthermore, it is also effective to assign the weights to all arbitrary variables to increase consistency of estimated index (Singh et al., 2022b). In CZSM, researchers can assign weight to particular variable based on its variance among the set of indicators (Kumar et al., 2017). Hence, CZSM and PCA have better consistency to create an index (Kumar et al., 2017; Singh et al., 2022b).
Development of Green Entrepreneurship Ecosystem Index (GEEI)
In this study, GEEI is defined as an integrated index of 43 related variables and it provides the relative performance of selected countries in green entrepreneurship ecosystem. The GEEI was developed using CZSM and PCA using following process:
Estimation of composite Z-score (CZS): It was used to convert the original values of an individual factor between 0 – 1 to make the relative comparison across countries (Singh et al., 2022b). If a variable has a positive impact on green entrepreneurship ecosystem as per the theoretical literature, then, CZS was assessed as:

Here, CZS is composite Z-score for ith factor; c is cross-sectional countries; t is time period; Min (Xict), and Max(Xict) are the original, minimum, and maximum values, respectively, for a specific variable across countries. If a variable has a negative impact on green entrepreneurship ecosystem, then, CZS was assessed as:

The meaning of variables is highlighted in equation (1).
Estimation of variance: It was used to examine the percentage variance and cumulative variance in estimated Composite Z-score for undertaken set of factors which were used for construction of GEEI (Singh et al., 2022b).
Eigenvector and eigenvalues: Both the values were estimated to identified that how different variables have higher loaded on different category of latent (or principal components) factors? Accordingly, it was used to assess the performance of undertaken indicators based on first five principal components in green entrepreneurship ecosystem (Singh et al., 2022b).
Validity of PCA results: PCA technique is considered the CZS of certain set of variables. Hence, it is necessary to check the scale-reliability of individual variable. Hence, Kaiser-Meyer-Olkin (KMO) measures were used to check the scale-reliability of variables (Singh et al., 2022b; Singh & Kumar, 2022).
Assignment of weights: Weights for a particular variable is assigned based its variance among the undertaken set of variables (Kumar et al., 2017; Singh and Kumar, 2022). Following formula were used to examine the weights:
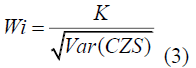
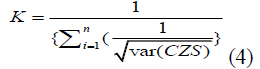
Here, Wi is weightage which value lie between 0<W>1 for a specific variable;  and Var(CZS) is a variation across composite Z-scores for all variables in equation (3) (Singh et al., 2020a). The value of K was estimated as:
Estimation of feature vector: It was estimated to examine most useful combination of variables which have higher variance among the undertaken variables (Singh & Kumar, 2022). Eigenvalue for individual variable was used to estimate feature vector.
Final index estimation: Final index was estimated as linear sum of all composite Zscore which were also multiplied by assigned weights for corresponding variables. For final index estimation, following formula was used:
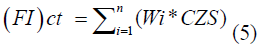
Here, FI is a final index; Wi is the assigned weights for respective variable; is CZS is composite Z-score for ith factor in equation (5).
Empirical Analysis
Several studies have applied estimated index as dependent and independent variables (Dhahri & Omri, 2018). For instance, Kumar et al. (2017) examined the influence of climatic factors on food security index in India. Singh and Issac (2018) observed the impact of climate change on sustainable livelihood security in Gujarat (India). Singh et al. (2019) investigated the impact of HDI and per capita GDP on environmental sustainability index. Singh and Ashraf (2020) assessed the influence of entrepreneurship ecosystem index on per capita GDP. Galindo-Martín et al. (2020) used environmental performance index, human development index and economic freedom index in empirical investigation. Singh et al. (2020a); Singh et al. (2020b); Singh et al. (2021); Singh and Kumar (2022) explored the association among the economic, social, environmental, science & technological and sustainable development. Singh et al. (2022a) observed the impact of climate change on agricultural sustainability in Indian states. Singh, et al. (2022b) analysed the impact of climatic and geographical factors on sustainable livelihood security index across Indian states.
As this study was desired to examine the impact of green entrepreneurship ecosystem on economic development. For said investigation, per capita GDP was used a representative variable for economic development and green entrepreneurship ecosystem index was considered as a proxy variable for green entrepreneurship. As economic development depends upon wage and salaried workers, vulnerable employment total, unemployment total, self-employed total, labor force participation rate, inflation GDP deflator, fixed telephone subscriptions and foreign direct investment net inflows. Thus, these variables were also considered as independent variables. Previous studies argued that loglinear regression model has better consistency to produce consistent coefficient of explanatory variables as compared to linear and non-linear regression models. Therefore, following form of log-linear regression model was used to examine the impact of GEEI and certain explanatory variables on per capita GDP:

Here, GDPPC is GDP per capita (constant 2015 US$), GEEI is green entrepreneurship ecosystem index, WSWTPTE is wage and salaried workers total (% of total employment), VETPTE is vulnerable employment total (% of total employment), UTPTLF is Unemployment total (% of total labor force), SETPTE is self-employed total (% of total employment), LFPRTPTP is labor force participation rate (% of total population ages 15-64), IGDPDAP is inflation GDP deflator (annual %), FTSPHP is fixed telephone subscriptions (per 100 people), FDINIPGDP is foreign direct investment net inflows (% of GDP), log is natural logarithm of associated variables, c is cross-sectional country, t is time period, α0 is constant coefficient, α1, α2, ... α9 are the regression coefficients of associated independent variables, is the error-term in equation (6). Following empirical model was used to examine the influence of per capita and selected explanatory variables on green entrepreneurship ecosystem index:

Here, GEEI is green entrepreneurship ecosystem index, GDPPC is GDP per capita (constant 2015 US$), WSWTPTE is wage and salaried workers total (% of total employment), UTPTLF is unemployment total (% of total labor force), MVAPC is manufacturing value added per capita (constant 2015 US$), LFPRTPTP is labor force participation rate total (% of total population ages 15-64), ICTGEPTGE is ICT goods exports (% of total goods exports), FDINIPGDP is foreign direct investment net inflows (% of GDP), ETPTE is employers total (% of total employment), EEPGNI is education expenditure (% of GNI), SETPTE is selfemployed total (% of total employment), β0 is constant coefficient, β1, β2, ... β10 are the regression coefficients of associated independent variables, μct is error-term in equation (7).
Selection of Appropriate Empirical Model
Several processes were used to decide an appropriate model. Ramsey RESET test was applied to check to viability of functional form of log-linear regression model for dependent and independent variables (Singh et al., 2020a). The F-values under Ramsey RESET test was seemed statistically significant and it means the functional form of log-linear regression model was suitable to estimate the regression coefficient of independent variables with output (Singh et al., 2020a). Variance inflation factor (VIF) was calculated to recognize the presence of multi-correlation Singh et al., 2021. Random and fixed effect models were also considered for estimation of regression coefficient of independent variables Singh et al., 2021. However, the Chi2 and Chibar2 values under Hausman specification and Breusch and Pagan Lagrangian multiplier test were reported statistically significant. Thus, the estimates show that Random and fixed effect models were appeared inappropriate. Furthermore, Chi2 and F-values under Modified Wald test and Wooldridge test, respectively were also observed statistically significant. Hence, the estimates provide a confirmation that panel data has heteroskedasticity and autocorrelation. Therefore, the regression coefficients of independent variables with dependent variable were estimated using Driscoll-Kraay standard errors estimation (Singh et al., 2021). The STATA 13.1 statistical software was used to create GEEI and to run the proposed regression models.
Descriptive Results Assessed By Principal Component Analysis(PCA)
Performance of Indicators Associated with Green Entrepreneurship Ecosystem
The performance of green entrepreneurship ecosystem associated indicators as per the observed eigenvalues, percentage variance and cumulative variance of first nine PCs. The cumulative variance of PC1, PC2, PC3, PC4, PC5, PC6, PC7, PC8 and PC9 was observed around 75% among the 43 indicators. The results showed that CO2 emissions from gaseous fuel consumption (CDGEGFC), CO2 intensity (CDGEKPKOEU), per capita CO2 emissions (CDGEMTPC), CO2 emissions per unit of manufacturing value added (CDGEPUMVA), CO2 emissions from transport (CDGET), development of environment-related technologies (DERTPAT), per capita electric power consumption (EPCPC), electricity production from coal sources (EPFCSPT), electricity production from hydroelectric sources (EPFHSPT), electricity production from natural gas sources (EPFNGSPT), electricity production from oil, gas and coal sources (EPFOGCSPT), electricity production from oil sources (EPFOSPT), per capita energy use (EUKOEPC), production-based CO2 productivity (PBCO2P), PM2.5 air pollution (PM2.5APPELEWHO), renewable energy consumption (RECPTFEC), renewable electricity output (REOPTEO), per capita renewable internal freshwater resources (RIFWRPC) and environmental technology (SPGETTPGAT) were reported significant indicators to increase green entrepreneurship ecosystem.
The estimates clearly infer that abatement of CO2 emissions from various sources would be a better suggestion to increase the transformation of a country towards green entrepreneurship. Electricity consumption and production from various sources, and renewable energy consumption were seemed also found useful variables to increase green entrepreneurship ecosystem. Environmental technology is also appeared useful determinants of green entrepreneurship ecosystem. The adequacy of aforesaid results was validated through overall KMO value for all indicators. The KMO value was reported 0.74 that infer that all variables have adequacy to apply PCA.
Cross Comparison of Countries as per Estimated GEEI
The cross comparison of countries based on estimated mean values of GEEI during 2000-2009 and 2010 – 2019. The GEEI values lies between 0.37 to 0.61 across countries during 2010 – 2019. It means that there is presence a high diversity in green entrepreneurship ecosystem among 34 countries. Norway, Finland and Canada have 1st, 2nd and 3rd position, respectively in green entrepreneurship ecosystem among the 34 counties. South Africa, India and Croatia have the poorest performance in green entrepreneurship ecosystem as these have 34th, 33rd, and 32nd position, respectively in estimated GEEI. As per the estimated values of GEEI, these countries can be divided in four groups:
Upper sustainable green entrepreneurship-oriented countries: (GEEI value greater than 0.50): Luxembourg, Portugal, United States of America, Switzerland, Netherlands, Sweden, Denmark, Estonia, Canada, Finland and Norway.
Middle sustainable green entrepreneurship-oriented countries: (GEEI value lie between 0.48 to 0.50): Tunisia, Latvia, Lithuania, Germany, Austria and Australia.
Lower sustainable green entrepreneurship-oriented countries: (GEEI value lie between 0.45 to 0.47): Argentina, United Kingdom, Japan, Spain, Mexico, Belgium and France.
Lowest sustainable green entrepreneurship-oriented countries (GEEI value is less than 0.45): Poland, Brazil, Greece, Romania, China, Russia, Hungary, Croatia, India and South Africa. Therefore, lower and lowest sustainable green entrepreneurship-oriented countries should use green innovation, green and environmental technology in production activities to abate GHGs emissions to increase their position in green entrepreneurship ecosystem.
Discussion on Empirical Results
Statistical Property of Dependent and Independent Variables
The statistically summary of variables which were used for empirical investigation is given in Table 3 The values of standard deviation (SD) were detected less than 1 for most variables (except foreign direct investment net inflows, ICT goods exports and Inflation GDP deflator). The values of skewness for most variables (except fixed telephone subscriptions, labour force participation rate total, and wage and salaried workers total) were found between – 1 to + 1. Undertaken variables were found in normal form as per their statistical properties i.e., SD and skewness.
| Table 3 Statistical Summary Of Dependent And Independent Variables |
|||||
|---|---|---|---|---|---|
| Variables | Min | Max | Mean | SD | Skewness |
| log(EEPGNI) | 0.5822 | 2.0882 | 1.5128 | 0.2761 | -1.1012 |
| log(ETPTE) | -0.0202 | 2.1270 | 1.2864 | 0.4867 | -0.8319 |
| log(FDINIPGDP) | -4.6052 | 4.4612 | 1.0395 | 1.1930 | -0.6404 |
| log(FTSPHP) | 0.4318 | 4.3174 | 3.4161 | 0.6857 | -1.6195 |
| log(GDPPC) | 6.6302 | 11.5660 | 9.9104 | 1.0084 | -0.6890 |
| log(GEEI) | -1.1088 | -0.4305 | -0.7244 | 0.1193 | 0.0407 |
| log(ICTGEPTGE) | -2.8134 | 3.4249 | 1.3235 | 1.1603 | -0.6165 |
| log(IGDPDAP) | -3.9120 | 3.9303 | 0.8642 | 1.1258 | -0.5909 |
| log(LFPRTPTP) | 3.8875 | 4.4333 | 4.2569 | 0.1081 | -1.1545 |
| log(MVAPC) | 4.6454 | 9.7337 | 7.8964 | 0.9247 | -0.7197 |
| log(SETPTE) | 1.8066 | 4.4397 | 2.8049 | 0.5753 | 0.7378 |
| log(UTPTLF) | 0.5933 | 3.5053 | 1.9781 | 0.5260 | 0.5533 |
| log(MVAPC) | 1.3584 | 4.4275 | 2.4868 | 0.6928 | 0.8199 |
| log(WSWTPTE) | 2.7246 | 4.5423 | 4.3518 | 0.2939 | -3.8905 |
Source: Author's calculation.
Association of Explanatory Variables with Economic Development
The regression results which examine the influence of GEEI and other variables on per capital GDP is described in Table 4. the regression coefficients of green entrepreneurship ecosystem index, wage and salaried workers, self-employed, labour force participation rate, fixed telephone subscriptions and foreign direct investment net inflows with per capita GDP were seemed positive and statistically significant. The above-mentioned results are consistent with previous studies such as Alwakid et al. (2021) which also reported positive impact of green entrepreneurship ecosystem on sustainable development and its components. Income of people is likely to be increased as wage and salaried workers, self-employed workers and labour force participation rate increases. Hence, it is understandable that per capita GDP is expected to be improved as increase in wage and salaried, self-employed workers and labour force participation rate. Fixed telephone subscriptions are an essential instrument to increase the effective communication among the people and it is useful to increase the digitalization. Hence, the estimate indicates that per capita GDP is expected to be increased as digitalization increases. The positive association of foreign direct investment net inflows with per capita GDP is similar with previous studies such as Rusu & Roman (2017), and Singh and Ashraf (2020).
| Table 4 Regression Coefficients Of Geei And Explanatory Variables With Per Capita Gdp |
|||||||
|---|---|---|---|---|---|---|---|
| Number of observations | 676 | ||||||
| Number of countries | 34 | ||||||
| F - Value | 5204.70* | ||||||
| R-squared | 0.833 | ||||||
| Root MSE | 0.4152 | ||||||
| Mean VIF | 11.05 | ||||||
| Ramsey RESET test using powers of the fitted values of log(GDPPC) [F – value] | 44.63* | ||||||
| Ramsey RESET test using powers of the independent variables [F – value] | 18.56* | ||||||
| Hausman fixed random [Chi2] | 22.32* | ||||||
| Breusch and Pagan Lagrangian multiplier test for random effects [Chibar2] | 3474.96* | ||||||
| Modified Wald test for groupwise heteroskedasticity in fixed effect regression model [Chi2] | 8440.16* | ||||||
| Wooldridge test for autocorrelation in panel data [F - Value] | 202.445* | ||||||
| log(GDPPC) | Reg. Coef. | Std. Err. | t | P>|t| | [95% Conf. Interval] | ||
| log(GEEI) | 1.4068 | 0.2906 | 4.84 | 0.000 | 0.7985 | 2.0150 | |
| log(WSWTPTE) | 0.6603 | 0.1449 | 4.56 | 0.000 | 0.3570 | 0.9636 | |
| log(VETPTE) | -0.8203 | 0.1222 | -6.71 | 0.000 | -1.0761 | -0.5644 | |
| log(UTPTLF) | -0.4372 | 0.0630 | -6.94 | 0.000 | -0.5690 | -0.3054 | |
| log(SETPTE) | 0.6486 | 0.1436 | 4.52 | 0.000 | 0.3480 | 0.9493 | |
| log(LFPRTPTP) | 1.1447 | 0.3083 | 3.71 | 0.001 | 0.4993 | 1.7900 | |
| log(IGDPDAP) | -0.1366 | 0.0174 | -7.85 | 0.000 | -0.1730 | -0.1002 | |
| log(FTSPHP) | 0.4187 | 0.0856 | 4.89 | 0.000 | 0.2395 | 0.5978 | |
| log(FDINIPGD) | 0.0064 | 0.0133 | 0.48 | 0.635 | -0.0214 | 0.0342 | |
| Constant Coefficient | 2.9491 | 1.0984 | 2.69 | 0.015 | 0.6502 | 5.2480 | |
Source: Author's calculation.
The regression coefficients of vulnerable employment, unemployment rate and inflation GDP deflator with per capita GDP were appeared negative and statistically significant. Vulnerable employment and unemployment rate are caused to reduce jobs for people. Consequently, per capita GDP is likely to be decreased due to increase in vulnerable employment and unemployment rate. Audretsch et al. (2015) and Dvouletý (2017) also reported significant influence of unemployment rate on economic development. High inflation may have adverse impact on business activities and cost of living. Hence, it is obvious that inflation GDP deflator produce a negative impact on per capita GDP. Adusei (2016); Rusu & Roman (2017); Singh & Ashraf (2020) also observed negative influence of inflation on economic development.
Association of Explanatory Variables with Green Entrepreneurship Ecosystem
The regression coefficients of per capita GDP, labour force participation rate, ICT goods exports, foreign direct investment net inflows and education expenditure with green entrepreneurship ecosystem index were seemed positive and statistically significant. Thus, the estimates infer that these variables are found vital determinants of green entrepreneurship ecosystem Table 5. It is expected that understanding of people towards environmental protection will increase as per capita GDP and labour force participation increase. Thus, it is noticeable that green entrepreneurship ecosystem may increase due to increase in per capita GDP and labour force participation rate. Moya-Clemente et al. (2020) also perceived positive impact of economic factors on sustainable entrepreneurship. Ahmad et al. (2015) claimed that sustainable education showed a positive impact on green entrepreneurship ecosystem.
| Table 5 Regression Coefficients Of Per Capita Gdp And Explanatory Variables With Geei |
||||||
|---|---|---|---|---|---|---|
| Number of observations | 676 | |||||
| Number of countries | 34 | |||||
| F - Value | 1058.38* | |||||
| R-squared | 0.4924 | |||||
| Root MSE | 0.0856 | |||||
| Mean VIF | 5.03 | |||||
| Ramsey RESET test using powers of the fitted values of log(GEEI) [F – value] | 21.99* | |||||
| Ramsey RESET test using powers of the independent variables [F – value] | 12.10* | |||||
| Hausman fixed random [Chi2] | 52.25* | |||||
| Breusch and Pagan Lagrangian multiplier test for random effects [Chibar2] | 1738.11* | |||||
| Modified Wald test for groupwise heteroskedasticity in fixed effect regression model [Chi2] | 283.85* | |||||
| Wooldridge test for autocorrelation in panel data [F - Value] | 105.588* | |||||
| log(GEEI) | Reg. Coef. | Std. Err. | t | P>|t| | [95% Conf. Interval] | |
| log(GDPPC) | 0.0439 | 0.0073 | 6.03 | 0.000 | 0.0287 | 0.0592 |
| log(WSWTPTE) | -0.0181 | 0.0355 | -0.51 | 0.617 | -0.0924 | 0.0563 |
| log(UTPTLF) | -0.0003 | 0.0165 | -0.02 | 0.985 | -0.0349 | 0.0343 |
| log(MVAPC) | -0.0045 | 0.0137 | -0.33 | 0.749 | -0.0332 | 0.0242 |
| log(LFPRTPTP) | 0.2601 | 0.0461 | 5.64 | 0.000 | 0.1636 | 0.3567 |
| log(ICTGEPTGE) | 0.0145 | 0.0034 | 4.27 | 0.000 | 0.0074 | 0.0215 |
| log(FDINIPGDP) | 0.0046 | 0.0014 | 3.26 | 0.004 | 0.0017 | 0.0076 |
| log(ETPTE) | -0.0218 | 0.0122 | -1.79 | 0.089 | -0.0473 | 0.0037 |
| log(EEPGNI) | 0.1539 | 0.0174 | 8.86 | 0.000 | 0.1175 | 0.1902 |
| log(SETPTE) | -0.0030 | 0.0071 | -0.42 | 0.681 | -0.0179 | 0.0119 |
| Constant Coefficient | -2.37294 | 0.181161 | -13.1 | 0.000 | -2.75212 | -1.99377 |
Source: Author's calculation.
Foreign direct investment net inflow is essential to increase transfer of green technology, environmental technology and appropriate technology, and others technology across countries. Hence, it may work as determinant to increase green entrepreneurship ecosystem. The regression coefficients of wage and salaried workers, unemployment rate, per capita manufacturing value added, total employers, and total self-employed with green entrepreneurship ecosystem index were appeared negative and statistically insignificant. The estimates, therefore, indicate that green entrepreneurship was adversely affected due to increase in wage and salaried workers, unemployment rate, per capita manufacturing value added, total employers, and total self-employed.
Conclusion
The descriptive results based on principal component analysis, showed that abatement of CO2 emissions and air pollution from various sources, electricity consumption, electricity generation from renewable sources, renewable electricity output, initiation of productionbased CO2 productivity, renewable energy consumption and renewable internal freshwater resources were found conducive practices of green entrepreneurship ecosystem. The results also infer that development of environment-related technologies and share of patent grants in environmental technology with total patent grants in all sectors have a crucial contribution to increase green entrepreneurship ecosystem. Use of green, environmental and appropriate technology in production activities would be imperative to increase green growth and green entrepreneurship ecosystem in global economies.
The estimated values of GEEI infer that there exists a high diversity in green entrepreneurship ecosystem among the 34 countries. This diversity in green entrepreneurship ecosystem across countries is existing due to adopted different practices of green entrepreneurship by undertaken countries. Subsequently, Norway, Finland and Canada have 1st, 2nd and 3rd position, respectively in green entrepreneurship ecosystem among the 34 counties. South Africa, India and Croatia have 34th, 33rd, and 32nd position, respectively in estimated GEEI, thus, these countries were in most deprived position in green entrepreneurship ecosystem among the 34 countries. Furthermore, undertaken countries were divided in four categories i.e., upper, middle, lower and lowest sustainable green entrepreneurship-oriented countries as per the estimated values of GEEI. This study underlined that lower and lowest sustainable green entrepreneurship-oriented countries should use green innovation, green and environmental technology in production activities to green entrepreneurship ecosystem.
Policy Guideline
The empirical results demonstrate that green entrepreneurship ecosystem index, wage and salaried workers, self-employed, labour force participation rate, fixed telephone subscriptions, and foreign direct investment net inflows have positive impact on per capita GDP. Hence, aforementioned variables were found crucial indicators to increase economic development. While, economic development is expected to be declined as vulnerable employment, unemployment rate and inflation GDP deflator increase. Thus, global economies should control vulnerable employment, unemployment rate and high inflation to increase per capita GDP and economic development. Furthermore, per capita GDP, labour force participation rate, ICT goods exports, foreign direct investment net inflows and education expenditure were observed crucial determinants of green entrepreneurship ecosystem. Green entrepreneurship ecosystem was negatively impacted due to increase in wage and salaried workers, unemployment rate, per capita manufacturing value added, total employers, and total self-employed. For this, policy makers should make mandatory for wage and salaried workers, manufacturing sector and employers to adopt green practices to increase green entrepreneurship ecosystem. Most specifically, the empirical results provided a confirmation that per capita GDP and green entrepreneurship ecosystem have a positive causality with each other’s.
This study examines the performance of 43 indicators associated with environmental sustainability development, entrepreneurship ecosystem and green entrepreneurship ecosystem using principal component analysis. It also provides the relative performance of selected countries in green entrepreneurship ecosystem through developing a green entrepreneurship ecosystem index (GEEI). Thus, it could develop a tool for further measurement of green entrepreneurship ecosystem in global economies. It presented the comparative status of across countries based on estimated values of GEEI. The index-based estimation was found as a useful statistical tool for policy makers to implement effective policy to increase green entrepreneurship ecosystem and transform of a country towards green economy. It also suggested concrete understanding on vital indicators which may be used to examine the performance of green entrepreneurship ecosystem at global level. Furthermore, this study used regression models to examine the impact of green entrepreneurship ecosystem on economic development and vice-versa using country-wise panel data during 2000 - 2019. Therefore, descriptive and empirical results of this study will have a significant contribution in the existing literature. Furthermore, several practical and viable policy actions were provided to achieve various goals of SDGs of United Nations by 2030. Finally, this study is policy-oriented research which attracts the attention of global policy makers, development thinkers, stakeholders, businessmen and entrepreneurs to adopt an effective and conductive policy to increase the use of green entrepreneurship ecosystem in production activities to increase economic and sustainable development. The empirical and descriptive findings of this study could provide several policy suggestions for research academia and industries to develop green, environmental and appropriate technology, and scientific methods to reduce the negative consequence of social and economic activities on ecosystem services.
References
Adusei, M. (2016). Does entrepreneurship promote economic growth in Africa?. African Development Review, 28(2), 201-214.
Indexed at, Google Scholar, Cross Ref
Ahmad, N.H., Halim, H.A., Ramayah, T., & Rahman, S.A. (2015). Green entrepreneurship inclination among Generation Y: the road towards a green economy. Problems and perspectives in management, 13(2), 211-218.
Alwakid, W., Aparicio, S., & Urbano, D. (2020). Cultural antecedents of green entrepreneurship in Saudi Arabia: An institutional approach. Sustainability, 12(9), 3673.
Indexed at, Google Scholar, Cross Ref
Alwakid, W., Aparicio, S., & Urbano, D. (2021). The influence of green entrepreneurship on sustainable development in Saudi Arabia: The role of formal institutions. International journal of environmental research and public health, 18(10), 5433.
Indexed at, Google Scholar, Cross Ref
Audretsch, D.B., Belitski, M., & Desai, S. (2015). Entrepreneurship and economic development in cities. The Annals of Regional Science, 55, 33-60.
Consumption, H.S.H.I.R. (2020). Production. Encyclopedia of the UN Sustainable Development Goals.
Demirel, P., & Danisman, G. O. (2019). Eco-innovation and firm growth in the circular economy: Evidence from European small-and medium-sized enterprises. Business Strategy and the Environment, 28(8), 1608-1618.
Indexed at, Google Scholar, Cross Ref
Demirel, P., Li, Q.C., Rentocchini, F., & Tamvada, J.P. (2019). Born to be green: new insights into the economics and management of green entrepreneurship. Small Business Economics, 52, 759-771.
Dhahri, S., & Omri, A. (2018). Entrepreneurship contribution to the three pillars of sustainable development: What does the evidence really say?. World Development, 106, 64-77.
Domanska, A., Zukowska, B., & Zajkowski, R. (2018). Green entrepreneurship as a connector among social, environmental and economic pillars of sustainable development. Why some countries are more agile?. Problemy Ekorozwoju, 13(2), 67-76.
Dvouletý, O. (2017). Relationship between unemployment and entrepreneurship dynamics in the Czech regions: A panel VAR approach. Acta Universitatis Agriculturae et Silviculturae Mendelianae Brunensis, 65(3), 987-995.
Ebrahimi, P., & Mirbargkar, S M. (2017). Green entrepreneurship and green innovation for SME development in market turbulence. Eurasian Business Review, 7(2), 203-228.
Galindo-Martín, M.A., Castaño-Martínez, M.S., & Méndez-Picazo, M.T. (2020). The relationship between green innovation, social entrepreneurship, and sustainable development. Sustainability, 12(11), 4467.
Indexed at, Google Scholar, Cross Ref
Iyigün, N.Ö. (2015). What could entrepreneurship do for sustainable development? A corporate social responsibility-based approach. Procedia-Social and Behavioral Sciences, 195, 1226-1231.
Indexed at, Google Scholar, Cross Ref
Karimi, R.F., & Nabavi Chashmi, S.A. (2019). Designing green entrepreneurship model in sustainable development consistent with the performance of Tehran industrial towns. Journal of business-to-business marketing, 26(1), 95-102.
Indexed at, Google Scholar, Cross Ref
Kumar, A., Ahmad, M.M., & Sharma, P. (2017). Influence of climatic and non-climatic factors on sustainable food security in India: A statistical investigation. International Journal of Sustainable Agricultural Management and Informatics, 3(1), 1-30.
Moya-Clemente, I., Ribes-Giner, G., & Pantoja-Díaz, O. (2020). Identifying environmental and economic development factors in sustainable entrepreneurship over time by partial least squares (PLS). PloS one, 15(9), e0238462.
Indexed at, Google Scholar, Cross Ref
Nuringsih, K. (2020). Role of green entrepreneurship in raising the effect of green value toward sustainable development. International Journal of Economics, Business, and Entrepreneurship, 3(2), 117-131.
OECD (2011). Measuring green entrepreneurship, in entrepreneurship at glance 2011. OECD Publishing, Paris.
Omoruyi, E.M.M., Olamide, K.S., Gomolemo, G., & Donath, O.A. (2017). Entrepreneurship and economic growth: Does entrepreneurship bolster economic expansion in Africa. Journal of Socialomics, 6(4), 1-11.
Onsay, E.A. (2021). The analysis of green growth indicators in predicting the economic development of southeast Asian Countries. Review of Socio-Economic Perspectives, 6(202190), 1-15.
Roser, M. (2014). Human development index (HDI). Our World in Data.
Rusu, V.D., & Roman, A. (2017). Entrepreneurial activity in the EU: An empirical evaluation of its determinants. Sustainability, 9(10), 1679.
Singh, A.K., & Ashraf, S.N. (2020). Association of entrepreneurship ecosystem with economic growth in selected countries: An empirical exploration. Journal of Entrepreneurship, Business and Economics, 8(2), 36-92.
Singh, A. K., & Issac, J. (2018). Impact of climatic and non-climatic factors on sustainable livelihood security in Gujarat state of India: A statistical exploration. Agriculture and Food Sciences Research, 5(1), 30-46.
Singh, A.K., & Kumar, S. (2022). Exploring the Impact of Sustainable Development on Social-economic, and Science and Technological Development in Selected Countries: A Panel Data Analysis. Society & Sustainability, 4(1), 55-83.
Singh, A.K., Issac, J., & Narayanan, K.G.S. (2019). Measurement of environmental sustainability index and its association with socio-economic indicators in selected Asian economies: An empirical investigation. International Journal of Environment and Sustainable Development, 18(1), 57-100.
Indexed at, Google Scholar, Cross Ref
Singh, A.K., Jyoti, B., Kumar, S., & Lenka, S.K. (2021). Assessment of global sustainable development, environmental sustainability, economic development and social development index in selected economies. International Journal of Sustainable Development and Planning, 16(1), 123-138.
Singh, A.K., Kumar, S., & Jyoti, B. (2022). Does Sustainable Livelihood Security Have a Relationship with Climatic and Geographical Factors? Evidence from a State-Wise Panel Data Investigation in India. IUP Journal of Applied Economics, 21(1).
Singh, A.K., Kumar, S., & Jyoti, B. (2022). Influence of climate change on agricultural sustainability in India: A state-wise panel data analysis. Asian Journal of Agriculture, 6(1).
Singh, A.K., Kumar, S., Ashraf, S N., & Jyoti, B. (2022). Implications of Farmer’s Adaptation Strategies to Climate Change in Agricultural Sector of Gujarat: Experience from Farm Level Data. Research on World Agricultural Economy, 3(2455-2022-698), 42-57.
Indexed at, Google Scholar, Cross Ref
Singh, A.K., Singh, B.J., & Ashraf, S.N. (2020). Implications of intellectual property protection, and science and technological development in the manufacturing sector in selected economies. Journal of Advocacy, Research and Education, 7(1), 16-35.
Singh, A.K., Singh, B.J., & Negi, V. (2020). Does sustainable development have a causal relationship with environmental development? Evidence from a country-wise panel data analysis. International Journal of technology management & sustainable development, 19(2), 147-171.
Indexed at, Google Scholar, Cross Ref
Skordoulis, M., Kyriakopoulos, G., Ntanos, S., Galatsidas, S., Arabatzis, G., Chalikias, M., & Kalantonis, P. (2022). The Mediating Role of Firm Strategy in the Relationship between Green Entrepreneurship, Green Innovation, and Competitive Advantage: The Case of Medium and Large-Sized Firms in Greece. Sustainability, 14(6), 3286.
Indexed at, Google Scholar, Cross Ref
Söderholm, P. (2020). The green economy transition: the challenges of technological change for sustainability. Sustainable Earth, 3(1), 1-11.
Tawiah, V., Zakari, A., & Adedoyin, F.F. (2021). Determinants of green growth in developed and developing countries. Environmental Science and Pollution Research, 28, 39227-39242.
Yin, C., Salmador, M.P., Li, D., & Lloria, M.B. (2022). Green entrepreneurship and SME performance: The moderating effect of firm age. International Entrepreneurship and Management Journal, 18(1), 255-275.
Zahedi, A., & Otterpohl, R. (2015). Towards sustainable development by creation of green social entrepreneur's communities. Procedia CIRP, 26, 196-201.
Indexed at, Google Scholar, Cross Ref
Zeng, J., & Ren, J. (2022). How does green entrepreneurship affect environmental improvement? Empirical findings from 293 enterprises. International Entrepreneurship and Management Journal, 18(1), 409-434.
Received: 22-Dec-2022, Manuscript No. JIBR-23- 13027; Editor assigned: 26-Dec-2022, Pre QC No. JIBR-23- 13027(PQ); Reviewed: 09-Jan-2023, QC No. JIBR-23-13027; Revised: 22-Feb-2023, Manuscript No. JIBR-23-13027(R) Published: 01-Mar-2023