Research Article: 2019 Vol: 23 Issue: 1
Does the Global Financial Crisis and Merger Impact on Conservatism and Performance? A Study in the Jordanian Banks Context
Yusuf Ali Al-Hroot, Philadelphia University, Jordan
Mohammad Saadat Amireh, Philadelphia University, Jordan
Abstract
This paper investigates the impact of the financial crisis on conservatism and performance for Jordanian merged banks. For the case of this study sample observations from the financial ratios of the AHLI bank in Jordan and incorporated cross-sectional data, while the period from 2001 to 2011 represents a range of years characterized by time series data. The Pooled Data Regression (PDR) is the appropriate model for measuring and linking the cross-sectional data and the time series data and the research method of multiple linear regressions has been used. The AHLI bank comparison in the merger performances were observed to have improved in the post-merger and during the global crisis period in Efficiency, Leverage, and Cash flow ratios, while deteriorating in the post-merger and during the global crisis period in terms of Liquidity ratios. On the other hand, the AHLI bank reports a higher level of conservativeness during the global crisis compared with the pre-crisis period where the adjusted R2 of the model is equal to 25.64% for the period (2006-2011) compared to 16.33% for the period (2001-2004). The study recommended that the role of the private sector should be activated in maintaining accounting standards in Jordan by adopting more conservative policies.
Keywords
Global Financial Crisis, Conservatism, Positive Accounting Theory, Basu Model, Merger, Jordan.
Introduction
An accounting conservatism is a Generally Accepted Accounting Principle (GAAP) that must be met in the financial statements. The accounting conservatism has been evident in practice, with the attention of accountants to the extent that it has become the most important pillar of practice. The accountant has a problem in choosing between a set of alternatives, the accountant chooses an alternative that complies with the accounting conservatism. The increasing number of interesting researchers in the field of financial accounting and the subject of accounting conservatism during the past twenty-five years was divided into many reasons; the impact of the adequacy of accounting information contained in the financial statements, and the researcher believes that there are grounds behind the interest in this subject. The first is the considerable progress in studying the contractual relationships of the entity and its implications for the financial report, and the second reason is the increased demand for producing more conservative financial statements as a result of confirming profit management practices in most financial reporting environments. The third reason relates to the significant number of measurement methods used to measure the accounting conservatism, which include earnings to stock return relations, such as the study of (Bressler, 2014), income statements such as the study of (Choi, 2007), and balance sheet measures research such as the study of (Sunder et al., 2018; Kausar & Lennox, 2017). The fourth reason lies in the great progress in the research of measurement tools for many financial and accounting phenomena from the financial statements. The last reason is due to the increased frequency of the debate on the use of fair value in the valuation of assets. There has also been a growing interest in the recent period in studying the relationship between the accounting reservation and the profits and returns of shares, through the attention of accounting literature to studying the degree of accounting reservation in a number of different countries. The accounting conservatism and the timely release of reports are the essence of the transparency of the financial statements. The conservative role of accounting is reflected in the management's choices to defer recognition of profits and take potential losses into account by not announcing expected gains, overstating expenses, provisions and depreciation of assets to reflect the business results conservatively, and this is done within the framework of the accepted accounting principles. The phenomenon of increasing the reservation in financial reports has become a major issue for contemporary accounting research, especially after the increase in the report of losses by companies with the increasing reservation in the financial reports.
The phenomenon of an increased the level of conservatism in financial reports has become a major issue for contemporary accounting research, especially after the increased losses reported by companies are increasing in line with the conservatism in financial reports. It can be concluded that accounting conservatism is the high degree of verification required to recognize good news (revenue and profit) compared to the low level of verification required to recognize bad news (expenses and revenue). The profit or business results are affected by bad news faster than by good news, and this is what saw confirmed by the results of several studies such as (Ball et al., 2008; Al-Hroot et al., 2017). There is a widespread debate in the scientific and professional circles - both regional and international - about the impact of the level of accounting conservatism in the preparation of financial reports on the value of the establishment. Furthermore, it was concluded by many studies and scientific research theory and practice that the accounting conservatism restricts the opportunistic behavior of managers and improves the value of the enterprise, such as the studies of (Basu, 1997; Beaver & Ryan, 2005; Nasev, 2009). Studies have criticized the accounting conservatism in terms of the potential distortion of information and its negative effects on the allocation of economic resources as well as the destruction of the value of the enterprise, such as the studies of (Miller & Oldroyd, 2018; Biddle et al., 2010; Bushman & Piotroski, 2006). In terms of practical implications and research recommendations, the results of this research will be useful for many parties, such as management boards in banks, investors and regulators. The remainder of this article is organized as follows: the “Objectives of this study” section explains the scope and objective. The “Related literature review” section discusses pertinent literature and the theoretical framework and approaches used in this study and in formulating the research hypothesis. In the “Data and methodology” section, the methodology, data sources and methods are provided. The “Results” section presents and discusses the results of the study and the “Conclusion” section contains concluding remarks. The article ends with some limitations for future research. Merger and Acquisition (M&A) is a strategy applied by the organizations internationally to meet the necessities of the modern dynamic of the environment in business. It has accomplished much interest and significance in the business world. In Jordan, this strategy has been used closely in the industry sector rather than in the banking sector. Therefore, many researchers worked on the effects of the merger almost all over the world. However, in Jordan, the phenomenon is not quite new and little attention has been taken to this substantial area of research. According to our knowledge, no research is observed to have been undertaken to examine the impacts of the merger in Jordan over a period of 10 years (2001-2011), though the said period is more important for this purpose. The objective of the study is to evaluate the financial performance of banks in Jordan after the merger and the financial global crisis over a period of 10 years (2001- 2011); hence our analysis covers the 2007–2008 global financial crisis and providing a comprehensive picture of the effect of the merger and the level of conservatism during the period under review using the financial ratio analysis. It would also benefit banks in the sector and others in the Amman Stock Exchange (ASE). The study would further provide more insight into the relationship between mergers, the performance of commercial banks, level of conservatism and the relationship with financial crisis to be of value to academicians and researchers in the same field.
Central Bank Of Jordan And Mergers History
The CBJ (the Central Bank of Jordan) succeeded the Jordan Currency Board which had been established in 1950. In 1959 the CBJ was established and totally owned by the government, its operational procedures were begun in 1964. In order to preserve the security of all financial transactions, the government has drafted in 2000 an amendment to the Jordanian Banking Law No. 28 of 2000 thus granting the Central Bank of Jordan more control over the management of banks. in addition, the banking law addresses topics, such as; bank mergers, Islamic banks, the organization and management of banks. The Jordan banking sector consists of 25 licensed banks. The number of local listed banks on the Amman Stock Exchange (ASE) accounts for 15 banks. In addition, there are 9 foreign bank subsidiaries and they are non-listed banks on the ASE. Annexure A shows the details of the banking sector in Jordan. Jordan Ahli Bank (previously Jordan National Bank) is one of the prominent financial institutions in Jordan, with a long and great history, founded in 1955 in Jordan, headquartered in Amman, the capital of Jordan. It has operations in two Arab countries; Palestine and Lebanon, and other countries such as Cyprus and the United Kingdom. Jordan National Bank was the sixth public shareholding company to be established in Jordan. The Jordan Ahli Bank (AHLI) bank has more than 120 branches and offices across Jordan and its network was sufficient for the nation's needs for more than 70 years. The bank meets seasonal or unexpected demands. The bank's capital reached 66 million after finishing all the legal procedures of the merger; the new code of the bank after the merger was (AHLI), and from that date, the Philadelphia Investment Bank was delisted.
The Chief Executive Officer of the Amman Stock Exchange (ASE) Jordan suspended the trading on the shares of Jordan National Bank as of January 12, 2005 until the merger procedures with Philadelphia Bank were finalized. As of August 23/2005, the ASE resumed trading on the shares of AHLI Bank after the merger procedures of Jordan National Bank with Philadelphia Bank in the AHLI Bank were finalized. The bank's capital became JD66,050,000. The bank's code (AHLI) and numerical code (111033) remained the same.
Literature Review
The subject of the accounting conservatism has not received sufficient attention from researchers in the Arab financial markets except in the recent period, despite the importance of the indicators given by the measurement of the accounting conservatism in the quality of profits, the quality of financial disclosure and the extent of compliance with accounting standards.
We believe that despite the remarkable convergence between the previous definitions of the accounting conservatism, in the related accounting literature, several definitions for the conservatism concept have been developed. The conventional definition of conservatism is to ‘anticipate no profits but anticipate all losses’ (Bliss, 1924). This can behold as the conservatism concept that profits have to realize when they are definitely confirmed and lose when they are potential. Several studies insert other definitions. The repeatedly used definition of conservatism in accounting research is the definition of Basu (1997): “accountants” propensity to require a higher point of realization for good news than bad news in the financial statements. In this paper we will use Basu’s (1997) definition. On the other hand, there is still a conflict in the classification of the accounting conservatism among many researchers. We see that some of them referred to accounting conservatism as a principle (Basu, 1997), while others called it a constraint (Kieso et al., 2010), and others called it an approach (Pupelis et al., 2008).
The Accounting Conservancy Measurements
Four accounting conservancy measures are most commonly employed:
1. Basu model 1997
According to this model, accounting conservatism tends to reduce the net book value to the market value of stockholders’ equity. Therefore, increasing the ratio of the market value of stockholders’ equity to its book value increases the size of the accounting conservatism and vice versa. This model can be applied either by the market value of stockholders’ equity to the net book value and in this situation when the percentage increases, that constitutes evidence for the exercise of conservatism; the model may be used by the net book value to the market value stockholders’ equity (when a low ratio arises, this is evidence of accounting conservatism practice).
2. (C-score) This indicator was developed by (Penman & Zhang, 2002)
This model measures the effect of the accounting conservatism on the balance sheet, given the ratio of hidden provisions to net operating assets. The increase in hidden provisions is higher than the net operating assets. The company uses conservatism accounting policies when announcing the value of its assets. The rise of the index (C-score) means increasing the degree of conservatism.
3. Accruals-based approach
The accruals-based approach is the difference between operating cash flow and net profit, as the appearance of accruals over a period of time indicates a continuous cash flow rather than profit. In other words, conservatism accounting policies have reduced the company's declared profits. Good profit is not recognized.
4. Book value to market value approach
This approach uses the ratio of book value to market value in order to examine the value of an entity's shares by comparing it carrying value with its market value. Several studies have indicated that the lower book value to market value below the correct one over a period of time indicates that the company uses conservatism accounting policies to recognize profits and the higher the value of assets, the accounting conservatism works to reduce the book value of the company, compared to the market value, in the sense that the company is undervalued, which is the essence of the conservatism called by the accounting theory.
(Ball et al., 2015; Qiang, 2007) distinguish between two types of conservatism. The first is the unconditional conservatism, which does not depend on the occurrence of certain facts, leads to a reduction in the net asset values or the disclosure of the lower carrying values of property rights. The second type is the conditional conservatism, the occurrence of certain events, and this leads to a faster recognition of economic losses. The importance of an accounting conservatism is evident in times of financial crisis in the global economy from time to time (Mitton, 2002; Watts & Zuo, 2012), which led many companies to face financial failure and increase the burden of agency costs, which led many managers to manipulate or alter the real profits by exploiting the private information they have about companies and thus increase the risk of information and agency risks, so a prudent accounting policy reduces the risk of information and agency risks, particularly in financial crises. In addition, (Balakrishnan et al., 2016) found that for companies with low conservatism in their financial statements or reports, the activity come down compared to companies with high conservatism following the insider of the global crisis. (Basu, 1997) suggested that managers may resort to more conservatism in their financial reports as evidence that their personal interest is not in their favour. On the other hand, Givoly & Hayn (2002) noted that managers resort to reservation in their financial reports to avoid a sense of liability. Ball et al. (2013) found that profits in countries that adopt private sector accounting regulation are more conservative in their accounting policies than those that adopt public sector regulation of accounting practices. Givoly & Hayn, (2000) & Basu (1997) noted that the decline in the book value to a market value of less than one percent over a period of time indicates that the company uses conservatism accounting policies towards the recognition of profits and higher asset values. The book value of the company, against its market value; in other words, the company is undervalued, which is the essence of the reservation called by the accounting theory. There are other advantages of accounting conservatism, where accounting conservatism affects the cost of financing, investments and other activities within the company, and contributes to avoiding losses in the value of the company. The results of some previous studies have shown that the accounting conservatism reduces the debt cost (Li, 2015), influences the value of cash assets (Louis et al., 2012) and controls various risks within the company, including the risk of bankruptcy.
Factors Affecting Accounting Conservatism
The size of the company
Where the results of some previous studies have shown that large companies are exposed to a lot of political pressure, so companies exercise accounting conservatism in order to avoid exposure to political costs. In contrast, Givoly & Hayan (2000) found that small-sized companies are experiencing more problems than large companies. For this reason, small companies exercise accounting conservatism in order to avoid the impact of lawsuits.
Debt ratio
To assess the extent to which debt ratio affects the degree or level of accounting conservatism, companies are divided into two groups according to the rate of leverage (Lin et al., 2014), measured by dividing long-term debt over total assets. The first group includes companies with a higher debt ratio than the average leverage for all companies; the second includes companies with a lower debt ratio than the average leverage of all companies.
Corporate governance
Corporate governance is positively correlated with accounting conservancy (Geimechi & Khodabakhshi, 2015). The more effective the governance, the greater the demand for applying a high level of accounting reserve in the financial statements.
Professional accounting organisation
It is the professional organizations responsible for the development of accounting standards that are conservative and those concerned with monitoring compliance with the application of standards such as the capital market authorities.
Efficiency of the financial market
The more active and efficient the capital market, the more conservative the companies tending to reduce the degree of information asymmetry.
The judicial system
The stronger the judicial system, the greater the tendency of management to increase the degree of accounting reservation, as a result of the administration's fear of judicial accountability in exaggerating the increase and decline of asset values. The researchers found that the previous studies were divided into several groups. The first of these groups focused on measuring the level of conservatism in the financial statements and financial reports. The second concerned the measurement of the effects of the accounting conservatism; the third dealt with the factors affecting the levels of conservatism.
Methodology
In accounting research, there are several theories and approaches but the most common two approaches related to this research are the normative and the empirical (also called positive) approaches to empirically investigate the impact of the financial crisis on conservatism and performance in the merged Jordanian bank. Based on the literature study, the hypothesis will be developed to give a prediction for the impact of the global financial crisis on conservatism and performance in the merged Jordanian bank. In this research, the empirical approach will be used, because this research deals with prediction and explanation completely similar to the positive approach. This research will try to examine if the performance of merged banks is associated with conservatism, for the reason that a change in conservatism through the before-crisis and crisis time could exert an indirect influence on decreasing profits. For this study, we can draw and test the following two hypotheses developed from the previous literature and refer to Figures 1 & 2 in relation to the theoretical framework.
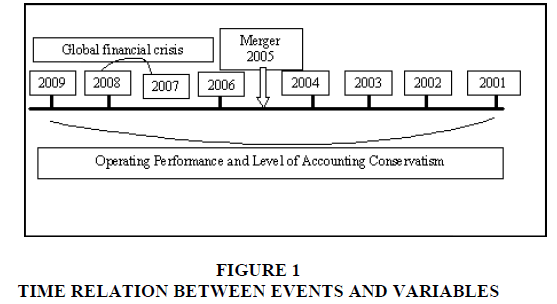
Figure 1: Time Relation Between Events And Variables
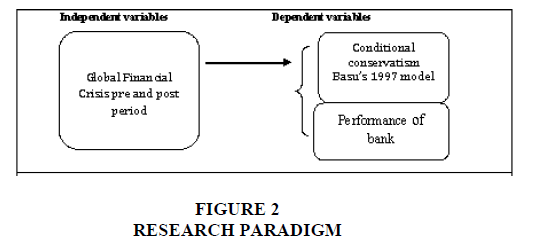
Figure 2: Research Paradigm
H1: AHLI bank reports low performance during the global crisis compared with the pre-crisis period.
To achieve the goal, the first hypothesis will be divided into four hypotheses:
1. Efficiency testing hypothesis H0: ?1 = ?2; H1: ?1 ≠ ?2
2. Liquidity testing hypothesis H0: ?1 = ?2; H1: ?1 ≠ ?2
3. Leverage testing hypothesis H0: ?1 = ?2; H1: ?1 ≠ ?2
4. Cash flow testing hypothesis H0: ?1 = ?2; H1: ?1 ≠ ?2
Where, ?1 is the mean performance of the four years before-merger (M-4, M-3, M-2, M-1) and ?2 is the mean performance of the four years following the merger (M+1, M+2, M+3, M+4) of the particular banks.
H2: AHLI bank reports a low level of conservatism during the global crisis compared with the pre-crisis period.
Measurement of Variables
In order to measure the effects of the global financial crisis, the mean performance (?1) of the four years before-merger (M-4, M-3, M-2, M-1) is compared with the mean performance (?2) of the four years after-merger (M+1, M+2, M+3, M+4) of the particular banks. The merger year is suggested as (?0) and is not displayed in the evaluation of performance. The performances of the merger banks are measured through the Efficiency, Leverage, Liquidity and Cash flow ratios. Table 1 exhibits the list of ratios used to measure the performances of the merger banks (Kumar, 2009; Kumbirai & Webb, 2010; Kemal, 2011; Ismail et al., 2011; Shah & Khan, 2017).
| Table 1 List of ratios used to measure the performances of the merger banks |
|||
| Financial ratios | Symbol | Measurement | |
| Efficiency ratios | |||
| Return on Assets | ROA | =Net Income/Total Asset. | |
| Return on Equity | ROE | =Net Income/Shareholders' Equity. | |
| Interest spread | IS | =Interest income-Interest expenses/Total assets. | |
| Interest margin | IM | =Interest income-Interest expenses/Total assets. | |
| Liquidity ratios | |||
| Cash and Cash Equivalent to Total Assets | CCETA | =Cash+Cash Equivalen/Total Assets. | |
| Investment to Total Assets | ITA | =Investment/Total Assets. | |
| Deposits to Total Assets | DTA | =Deposits/Total Assets. | |
| Total Liabilities to Total Assets (Debt Ratio) | DR | =Total Liabilities/Total Assets. | |
| Net Credit Facilities to Total Deposits (Gross advances to total deposits) | NCFTD | =Net Credit Facilities to Total Deposits. | |
| Leverage ratios | |||
| Equity Ratio | ER | =Total equity to total assets. | |
| Total Deposits to Total Equity (Times) | TDTE | =Total Deposits/Total Equity. | |
| Cash flow ratio | |||
| Cash generated from net cash flow from operating activities to Profit after tax (Times) | CCFPAT | =Non-cash accounts to net income. | |
The methodologies used to measure the degree of conservatism in financial reporting have varied. However, these methodologies sometimes differed in their findings, but all depend on the effect of the asymmetric recognition of gains and losses in financial reports, specifically net assets, profits and receivables. The model of the study used to measure the level of the accounting reservation and the factors influencing it is presented below. Table 2 shows the Efficiency ratios of AHLI bank’s comparison of the ROE, ROA, Interest Spread (IS), and Interest Margin (IM) in the pre and post-merger period. AHLI bank shows a better performance in the post-merger period. Moreover, the average of Liquidity ratios is decreased in the postmerger period except that the Net Credit Facilities to Total Deposits ratio appears to have increased in the post-merger period. In addition, a decline is also observed in the average Total Deposits to Total Equity ratio in the post-merger period. Furthermore, the Equity Ratio of AHLI bank’s improvement is observed. AHLI bank’s comparison of Cash flow ratio surfaces to have an improvement in the post-merger period, which indicates better performance in the postmerger period.
| Table 2 Financial Ratio Analysis For The Periods (2001-2004 And 2006-2011) |
||||||||||
| Financial ratios | After global crisis | After merger 4 years | Before merger 4 years | |||||||
| 2011 | 2010 | 2009 | 2008 | 2007 | 2006 | 2004 | 2003 | 2002 | 2001 | |
| C+3 | C+2 | M+4 & C+1 | M+3 | M+2 | M+1 | M-1 | M-2 | M-3 | M-4 | |
| Efficiency Ratios/Profitability ratios | ||||||||||
| Return on Assets | 0.87% | 0.82% | 0.83% | 0.83% | 0.55% | 1.16% | 0.38% | 0.00% | -0.27% | 0.01% |
| Return on Equity | 9.14% | 9.25% | 8.69% | 8.61% | 5.50% | 9.56% | 6.14% | -0.01% | -5.86% | 0.23% |
| Interest spread | 51.60% | 49.73% | 49.88% | 50.02% | 47.21% | 52.70% | 55.08% | 47.36% | 37.31% | 37.71% |
| Interest margin | 3.23% | 2.96% | 2.59% | 2.84% | 2.91% | 2.44% | 1.89% | 2.03% | 1.67% | 2.31% |
| Liquidity ratios | ||||||||||
| Cash and Cash Equivalent to Total Assets | 35.33% | 34.28% | 31.03% | 34.30% | 42.22% | 42.97% | 55.31% | 48.54% | 48.30% | 41.36% |
| Investment to Total Assets | 0.10% | 0.08% | 0.05% | 0.39% | 1.33% | 1.99% | 0.85% | 1.33% | 3.65% | 4.86% |
| Deposits to Total Assets | 68.54% | 68.27% | 67.29% | 65.22% | 62.89% | 62.61% | 83.13% | 81.07% | 74.91% | 74.03% |
| Total Liabilities to Total Assets (Debt Ratio) | 92.96% | 92.78% | 90.42% | 90.36% | 90.01% | 87.78% | 93.83% | 94.39% | 95.37% | 94.89% |
| Net Credit Facilities to Total Deposits (Gross advances to total deposits) | 54.53% | 53.81% | 54.33% | 54.17% | 48.20% | 46.81% | 32.17% | 40.64% | 44.25% | 53.93% |
| Capital ratios/Leverage ratios | ||||||||||
| Capital ratio (Equity Ratio) | 9.72% | 9.67% | 9.51% | 9.57% | 9.91% | 12.15% | 6.17% | 5.61% | 4.63% | 5.11% |
| Total Deposits to Total Equity (Times) | 8.03 | 7.44 | 7.07 | 6.82 | 6.35 | 5.15 | 13.01 | 13.84 | 12.78 | 12.39 |
| Cash flow ratio | ||||||||||
| Cash generated from net cash flow from (Used In) operating activities to Profit after tax (Times) | 4.27 | 4.16 | 3.92 | 2.02 | 10.22 | -10.63 | 43.62 | -16565.4 | -15.61 | 620.14 |
Paired Samples Statistics Test
Table 3 indicates the differentiation of the before and after-merger means of the 12 ratios set for this study. The impact of the merger on performance in pre and post-merger period is measured in terms of four ratios. The change is found to significantly increase in the mean value of ROA, ROE and IM. We reject the null hypothesis (H0) and accept the alternative hypothesis (H1). However, an insignificant improvement performance was observed in the Interest Spread (IS) in the after-merger period, which may be referred to the decrease performance in administrative expenses in the after-merger period. We failed to reject the null hypothesis (H0) in this case. The change of before and after- merger liquidity ratios provides significant statistical decrease performance in cash and cash equivalent to total assets, deposits to total assets and total liabilities to total assets ratios in the after-merger period. We reject the null hypothesis (H0) and accept the alternative hypothesis (H1). However, the investment to total assets ratio shows an insignificant declining performance in the after-merger period. Improvement is observed in the performance of net credit facilities to total assets in the after-merger period. Thus, we failed once more to reject the null hypothesis (H0) in this case. The comparison of before and after- merger leverage ratios (capital ratios) shows a significant statistical improvement performance in equity ratio and total deposits to total equity in the after-merger period. Thus, we reject the null hypothesis (H0) and accept the alternative hypothesis (H1). The differentiation of the before and after-merger cash flow ratio shows a better performance in the mean value of cash generated from net cash flow from operating activities to profit after tax in the after-merger period. Thus, we once more failed to reject the null hypothesis (H0) in this case.
| Table 3 Paired Samples Statistics Test |
|||||||
| Financial ratios | Status | Mean | Standard deviation | t-value | p-value Sig (2-Tailed) |
||
| Efficiency ratios/Profitability ratios | |||||||
| Return on Assets | Pre-merger | 0.097 | 0.188 | 11.306 | 0.001* | ||
| Post-merger | 0.842 | 0.249 | |||||
| Return on Equity | Pre-merger | 1.937 | 2.812 | -5.187 | 0.014* | ||
| Post-merger | 8.090 | 1.779 | |||||
| Interest spread | Pre-merger | 4.436 | 8.521 | -1.403 | 0.255 | ||
| Post-merger | 4.995 | 2.242 | |||||
| Interest margin | Pre-merger | 1.975 | 0.268 | -3.716 | 0.034* | ||
| Post-merger | 2.695 | 0.218 | |||||
| Liquidity ratios | |||||||
| Cash and Cash Equivalent to Total Assets | Pre-merger | 4.837 | 5.696 | 6.492 | 0.007* | ||
| Post-merger | 3.763 | 5.894 | |||||
| Investment to Total Assets | Pre-merger | 2.672 | 1.903 | 1.250 | 0.300 | ||
| Post-merger | .940 | 0.884 | |||||
| Deposits to Total Assets | Pre-merger | 7.828 | 4.499 | 4.170 | 0.025* | ||
| Post-merger | 6.450 | 2.195 | |||||
| Total Liabilities to Total Assets (Debt Ratio) | Pre-merger | 9.462 | 0.661 | 12.975 | 0.001* | ||
| Post-merger | 8.964 | 1.254 | |||||
| Net Credit Facilities to Total Deposits (Gross advances to total deposits) | Pre-merger | 4.274 | 9.011 | -2.740 | 0.071 | ||
| Post-merger | 5.087 | 3.935 | |||||
| Capital ratios/Leverage ratios | |||||||
| Capital ratio (Equity Ratio) | Pre-merger | 5.380 | 0.661 | -12.743 | 0.001* | ||
| Post-merger | 10.28 | 1.255 | |||||
| Total Deposits to Total Equity (Times) | Pre-merger | 1.300 | 0.612 | 10.976 | 0.002* | ||
| Post-merger | 6.347 | 0.852 | |||||
| Cash flow ratio | |||||||
| Cash generated from net cash flow from (Used In) operating activities to Profit after tax (Times) | Pre-merger | 1.725 | 298.705 | 1.123 | 0.343 | ||
| Post-merger | 4.545 | 3.887 | |||||
Note: *Significant at level 0.05.
Study Model for Assessing Accounting Conservatism
In order to measure the degree of reservation in the financial statements of merged banks, a model was adopted, which relies on the fact that accountants tend to recognize unrealized losses before unrealized profits (Basu, 1997). The profits declared in the current period must contain unrealized losses; profits are expected to be more affected by bad news (Basu, 1997), a reservation works on the timing of the recognition of economic events during the earnings report where bad news is reflected in profits faster than good news, so earnings are expected to be more closely related to the share price movement in periods of bad news than in good news periods.
Therefore, the measure of holding is the difference between stock price movement and profit signal in bad news periods (Givoly & Hayn, 2000), and their relationship to periods of good news.
The Basu Accounting Conservatism Model
The metric of Basu (1997) is the commonly used model for measuring the level of accounting conservatism. Under this model, earnings are more sensitive to bad news than to good news in relation to the asymmetric of the confirmation of gains and losses. In other words, the accounting conservatism is covered as the scope to which negative returns (bad news) are further impacted in reported earnings than positive returns (good news). Basu’s formula can be expressed as:
 (1)
(1)
For investigating the relationship between accounting conservatism and the global financial crisis by adding (CRIS) as a dummy variable to develop Basu’s model to be more appropriate, to give the ability of testing differences in conservatism between the pre and during crisis period. This regression results in the following model:

Xit is the earnings per share for a company (i) in the year (t), the factor Pit-1 is per share price at the beginning of the fiscal year, DRit is the returns on a company (i) for one year, Rit is the dummy variable, CRISI is a dummy variable, equal to 0 if the observation falls in the beforecrisis period (2001-2004) and equal to 1 if the observation falls during the crisis period (2006- 2011). While eit is the error which cannot be interpreted by the model. The regression model is used in order to make a judgment during the study years from 2001 to 2009; this period contains the period during the global financial crisis. In the model, the variable returns (DRit) reports positive and negative market returns nonchalantly. The dummy variable (Rit) is the variable of news which carries the values 1 or 0. The variable (DRit) is to divide the negative returns from positive returns. The DRit takes the value of one of the negative returns, while positive returns carry the zero value. The output of multiplying the variable Rit by the variable DRit results in Rit×DRit as a new independent variable and takes only the negative return values. On the other hand, the beta variables (β1), (β2) and (β3) measure the coefficient regression of positive returns, accounting conservatism, negative returns respectively with either positive or negative values.
For the case of this study, 12 observations were included; these observations are based on the accounting data of AHLI bank in Jordan and incorporate cross-sectional data, while the period from 2001 to 2011 represents a range of years characterized by time series data. The Pooled Data Regression (PDR) is the appropriate model for measuring and linking the crosssectional data and time series data. To verify the rightness of data many tests are required; the normal distribution test, time-series, multicollinearity test and autocorrelation test, from the results shown in Table 4. Firstly, we should test the normal distribution of data, using the Jarque- Bera test (J-B test). The decision of this kind of test is in three ways; first, a normal distribution occurs when the result of the J-B test probability is greater than 0.05; otherwise, the null hypothesis will be rejected. It can be concluded that variables at a whole in the table are less than 0.05, which means that data is not normally distributed. To obtain a more normal distribution the data should transfer to a natural logarithm for solving this problem. Secondly, the p-value for the 12 observations is (0.312), while the critical values of the ADF test at the 1% and 5% levels are -3.41 and -3.98, respectively. The critical value is less than the p-value. We then accept the null hypothesis, which means that the time series data remains approximately stable for the period between 2001 and 2011. The third important test is the Variance Inflation Factor (VIF) and Tolerance to evaluate if there is a multicollinearity problem, if the VIF values are above 5 or 10, while the Tolerance values must be less than 0.20 or 0.10, which means there is no multicollinearity problem. The final test is the Durbin Watson (DW) test, which measures the autocorrelation problem, the range of DW degree is between zero and four. Moreover, if the DW value is less than 1.5, it means that there is a positive autocorrelation problem. While if the DW value is more than 2.5, results indicate that there is a negative correlation. Otherwise, the model of the study is free from autocorrelation problems. From Table 4, the value of the DW is 1.97. This value falls between 1.5 and 2.5, this result supports the third test that indicated that there is no autocorrelation problem.
| Table 4 The validity testing of data for statistical analysis |
||||
| Variable | Normal Distribution (Jarque Bera test) |
Times series test | ||
| J-B | Sig. | ADF | PP | |
| Xit | 612 | 0.000 | 7.435 | 8.441 |
| Pi,t-1 | 326 | 0.000 | 6.521 | 7.231 |
| Ri,t | 133 | 0.000 | 6.726 | 7.104 |
| Variable | Multicollinearity (Collinearity test) |
Autocorrelation (Durban Watson test) |
||
| VIF | Tolerance | |||
| DRi,t | 1.203 | 0.792 | DW | 1.97 |
| Ri,t | 1.001 | 0.923 | ||
| DRi,t×Ri,t | 1.068 | 0.879 | ||
Table 5 summarizes the regression analysis for the period attending to the merger. As assumed, the constant variable coefficient (α) and the variable (β3) are positive, with a value of 0.317 and 0.198, sequentially. The p-value is 0.594 of the R×DR; the (β3) variable is positive and greater than 0.05 which means that it is statistically insignificant. In addition, surprisingly, the DR variable coefficient is negative and equal to -0.331. Moreover, the sensitivity of earnings to negative returns (bad news) is 1 to 0.402 times that of the sensitivity of earnings to positive returns (good news); ((-0.331+0.198)/-0.331)=0.402 for the period 2001-2004. The adjusted R2 of the model is equal to 16.33%; the results show that the accounting conservatism level is low for the pre-merger period from 2001 to 2004.
| Table 5 Regression analysis for the period (2001-2004) |
|||
| Variables | Coefficient | t-value | p-value |
| α | 0.317 | 0.639 | 0.327 |
| Rit (β1) | -0.022 | 0.543 | -0.609 |
| DRit (β2) | -0.331 | 0.587 | -0.411 |
| Rit×DRit (β3) | 0.198 | 0.106 | 0.594 |
| (β 2+β 3)/β2 | 0.402 | - | - |
| R2 | 12.7 | - | - |
| Adjusted R2 | 16.33% | - | - |
Tables 6 & 7 summaries the regression analysis for the post-merger period, the constant variable coefficient (α) and the variable (β3) are positive, with values of 0.562 and 0.858, sequentially. The R×DR (β3) variable is positive and a statistically significant value (pvalue= 0.022) and this value is greater than 0.05. In addition, the DR variable coefficient is positive and equal to 0.858. Moreover, the sensitivity of earnings to negative returns (bad news) is 1 to 6.95 times that of the sensitivity of earnings to positive returns (good news); ((0.144+0.858)/0.144)=1.11 for the post-merger period 2006-2011. The adjusted R2 of the model is equal to 25.57%; the results show that the level of accounting conservatism increased in the pre-merger period from 2006 to 2011. In addition, this period contains the global crisis 2007- 2008. These results are associated with the study of Al-Hroot et al. (2017), who concluded that the level of accounting conservatism in the banking sector in Jordan during and after the world global crisis increased compared with the period before, based on the results provided in Tables 5-7. The (H2) hypothesis should be rejected which states that the “AHLI bank report low level of conservatism during the global crisis compared with the pre-crisis period”. These results support that the AHLI bank reports a higher level of conservatism during the global crisis compared with the pre-crisis period (Table 7). This result is consistent with many studies about the relationship between the Asian financial crisis and conservatism such as Herrmann et al. (2008) and Vichitsarawong et al. (2010). Researchers found that the level of accounting conservatism during and post-crisis period was higher compared to the pre-crisis period.
| Table 6 Regression analysis for the period (2006-2011) |
|||
| Variables | Coefficient | t-value | p-value |
| α | 0.567 | 0.189 | 0.828 |
| Rit (β1) | -0.170 | -0.378 | 0.712 |
| DRit (β2) | 0. 1 49 | 0.264 | 0.749 |
| Rit×DRit (β3) | 0.860 | 0.263 | 0.022 |
| (β2+β3)/β2 | 6.77 | ||
| R2 | 20.326 | ||
| Adjusted R2 | 25.64% | ||
| Table 7 Yearly level of conservatism |
||
| Year | Level of conservatism Adj. R2 | t-value |
| 2001 | 11.3% | 1.04 |
| 2002 | 12.59% | 1.09 |
| 2003 | 11.12% | 1.07 |
| 2004 | 15.45% | 2.253 |
| 2005 | 17.62% | 3.292 |
| 2006 | 18.3% | 3.018 |
| 2007 | 19.77% | 5.871 |
| 2008 | 23.21% | 3.907 |
| 2009 | 17% | 2.92 |
| 2010 | 21% | 3.604 |
| 2011 | 26% | 3.978 |
Disscusion And Conclusion
In this paper, we investigate the impact of the financial crisis on conservatism and performance for Jordanian merged banks. Although various researches investigated conservatism over time such as the effect of the Asian financial crisis on the level of conservatism, according to our knowledge, no researches investigated the impact of the global financial crisis on conservatism and performance for Jordanian merged banks. For the case of this study, 12 observations were included; these observations are based on the financial ratios of AHLI bank in Jordan and incorporate cross-sectional data, while the period from 2001 to 2011 represents a range of years characterized by time series data. The Pooled Data Regression (PDR) is the appropriate model for measuring and linking the cross-sectional data and time series data.
The performance analysis for the period pre and post the global crisis shows that the Efficiency ratios of AHLI bank’s comparison of ROE, ROA, Interest Spread (IS), and Interest Margin (IM) in the pre and post-merger period. AHLI bank shows a better performance in the post-merger period. Moreover, the average of Liquidity ratios is decreased in the post-merger period except that the Net Credit Facilities to Total Deposits ratio appears to have increased in the post-merger period. In addition, a decline is also observed in the average Total Deposits to Total Equity ratio in the post-merger period. Furthermore, The Equity Ratio of AHLI bank’s improvement is observed. AHLI bank’s comparison of Cash flow ratio surfaces to have an improvement in the post-merger period, which indicates better performance in the post-merger period. Previous studies measuring the impact of the merger on performance in the post-merger period indicates mixed results such as (Healy et al., 1992; Lau et al., 2008; Al-Sharkas et al., 2008); our results are consistent with this type of studies which indicated mixed results. Other studies observed improvement in performance in the post-merger period such as Badreldin & Kalhoefer (2009), and other research shows no changes or decline in their results. In summary, the AHLI bank comparison in the performances of the merger was observed to have improvement in the post-merger and during the global crisis period in Efficiency, Leverage, and Cash flow ratios, while deteriorating in the post-merger and during the global crisis period in Liquidity ratios. Moreover, the sensitivity of earnings to negative returns (bad news) is 1 to 0.402 times that of the sensitivity of earnings to positive returns (good news) for the period 2001-2004. The adjusted R2 of the model is equal to 16.33%; the results show that the accounting conservatism level is low for the pre-merger and global crisis period from 2001 to 2004. In addition, the AHLI bank reports higher level of conservatism during the global crisis compared with the pre-crisis period where the adjusted R2 of the model is equal to 25.57% for the period (2006-2011). This result is consistent with Herrmann et al. (2008). The researchers found that Big 4 audit clients reported more conservatively during the global crisis period compared to the post-crisis period. Moreover, Deloitte & Touche is one of the big4 audit firms around the world and its audited AHLI bank statements during the period from 2001 to 2011.
The current study also resulted in similar findings to the previous studies. Most of the ratios studied indicate mixed results in the post-merger period. Therefore, the banks may invest their resources in expanding their networking or providing good customer service instead of participating in the ineffective mergers transacts.
Limitations And Suggestions Of The Research
The first limitation is that this paper does not study the unconditional conservatism. Moreover, the sample size of this study is limited to one bank in Jordan because it is the only case founded which is consistent with the crisis period. In addition, the study recommended that the role of the private sector should be activated in maintaining accounting standards in Jordan by adopting more conservative policies. For further research in the future, first, it should be interesting to examine the level of unconditional conservatism in Jordan and gulf countries. Second, it should be examined if the conclusions are the same for gulf countries as for Jordan.
References
- Al-Hroot, Y.A., Al-Qudah, L.A.M., & Alkharabsha, F.I.A. (2017). The effect of the global financial crisis on the level of accounting conservatism in commercial banks: Evidence from Jordan.International Journal of Business and Management,12(2), 151.
- Al?Sharkas, A.A., Hassan, M.K., & Lawrence, S. (2008). The impact of mergers and acquisitions on the efficiency of the US banking industry: Further evidence.Journal of Business Finance & Accounting,35(1?2), 50-70.
- Badreldin, A., & Kalhoefer, C. (2009). The effect of mergers and acquisitions on bank performance in Egypt. Journal of management Technology, 25, 1-15.
- Balakrishnan, K., Watts, R., & Zuo, L. (2016). The effect of accounting conservatism on corporate investment during the global financial crisis. Journal of Business Finance & Accounting, 43(5-6), 513-542.
- Ball, R., Kothari, S.P., & Nikolaev, V.V. (2013). Econometrics of the Basu asymmetric timeliness coefficient and accounting conservatism. Journal of Accounting Research, 51(5), 1071-1097.
- Ball, R., Kothari, S.P., & Robin, A. (2000). The effect of international institutional factors on properties of accounting earnings. Journal of Accounting and Economics, 29(1), 1-51.
- Ball, R., Robin, A., & Sadka, G. (2008). Is financial reporting shaped by equity markets or by debt markets? An international study of timeliness and conservatism. Review of Accounting Studies, 13(2-3), 168-205.
- Basu, S. (1997). The conservatism principle and the asymmetric timeliness of earnings. Journal of Accounting and Economics, 24(1), 3-37.
- Beaver, W.H., & Ryan, S.G. (2005). Conditional and unconditional conservatism: Concepts and modeling. Review of Accounting Studies, 10(2-3), 269-309.
- Biddle, G.C., Ma, M.L., & Song, F.M. (2016). Accounting conservatism and bankruptcy risk. SSRN.
- Bliss, J.H. (1924). Management through accounts. Ronald Press Company.
- Bressler, P. (2014). Bressler, paige, accounting conservatism measures and stock returns: An empirical comparison of a new income statement based measure of conservatism to existing measures of accounting conservatism. SSRN.
- Bushman, R.M., & Piotroski, J.D. (2006). Financial reporting incentives for conservative accounting: The influence of legal and political institutions. Journal of Accounting and Economics, 42(1-2), 107-148.
- Choi, W. (2007). Bank relationships and the value relevance of the income statement: Evidence from Income?Statement Conservatism. Journal of Business Finance & Accounting, 34(7?8), 1051-1072.
- Geimechi, G., & Khodabakhshi, N. (2015). Factors affecting the level of accounting conservatism in the financial statements of the listed companies in Tehran stock exchange. International Journal of Accounting Research, 2(4).
- Givoly, D., & Hayn, C. (2000). The changing time-series properties of earnings, cash flows and accruals: Has financial reporting become more conservative? Journal of Accounting and Economics, 29(3), 287-320.
- Givoly, D., & Hayn, C. (2002). Rising conservatism: Implications for financial analysis. Financial Analysts Journal, 58(1), 56-74.
- Healy, P.M., Palepu, K.G., & Ruback, R.S. (1992). Does corporate performance improve after mergers? Journal of Financial Economics, 31(2), 135-175.
- Herrmann, D.R., Pornupatham, S., & Vichitsarawong, T. (2008). The impact of the Asian financial crisis on auditors' conservatism. Journal of International Accounting Research, 7(2), 43-63.
- Ismail, T.H., Abdou, A.A., & Annis, R.M. (2011). Review of literature linking corporate performance to mergers and acquisitions. The Review of Financial and Accounting Studies, 1, 89-104.
- Kausar, A., & Lennox, C. (2017). Balance sheet conservatism and audit reporting conservatism. Journal of Business Finance & Accounting, 44(7-8), 897-924.
- Kemal, M.U. (2011). Post-merger profitability: A case of royal bank of Scotland (RBS). International Journal of Business and Social Science, 2(5), 157-162.
- Kieso, D.E., Weygandt, J.J., & Warfield, T.D. (2010). Intermediate accounting: IFRS, (Second Edition). John Wiley & Sons.
- Kumar, R. (2009). Post-merger corporate performance: An Indian perspective. Management Research News, 32(2), 145-157.
- Kumbirai, M., & Webb, R. (2010). A financial ratio analysis of commercial bank performance in South Africa. African Review of Economics and Finance, 2(1), 30-53.
- Li, X. (2015). Accounting conservatism and the cost of capital: An international analysis. Journal of Business Finance & Accounting, 42(5-6), 555-582.
- Lin, F., Wu, C.M., Fang, T.Y., & Wun, J.C. (2014). The relations among accounting conservatism, institutional investors and earnings manipulation. Economic Modelling, 37, 164-174.
- Louis, H., Sun, A.X., & Urcan, O. (2012). Value of cash holdings and accounting conservatism. Contemporary Accounting Research, 29(4), 1249-1271.
- Miller, A.D., & Oldroyd, D. (2018). An economics perspective on financial reporting objectives. Australian Accounting Review, 28(1), 104-108.
- Mitton, T. (2002). A cross-firm analysis of the impact of corporate governance on the East Asian financial crisis. Journal of Financial Economics, 64(2), 215-241.
- Nasev, J. (2009). Linear information models: The effect of unconditional conservatism. In Conditional and Unconditional Conservatism, (7-29). Gabler.
- Penman, S.H., & Zhang, X.J. (2002). Accounting conservatism, the quality of earnings, and stock returns. The Accounting Review, 77(2), 237-264.
- Pupelis, G., Zeiza, K., Plaudis, H., & Suhova, A. (2008). Conservative approach in the management of severe acute pancreatitis: Eight?year experience in a single institution. HPB, 10(5), 347-355.
- Qiang, X. (2007). The effects of contracting, litigation, regulation, and tax costs on conditional and unconditional conservatism: Cross-sectional evidence at the firm level. The Accounting Review, 82(3), 759-796.
- Shah, B.A., & Khan, N. (2017). Impacts of mergers and acquisitions on acquirer banks’ performance. Australasian Accounting, Business and Finance Journal, 11(3), 30-54.
- Sunder, J., Sunder, S.V., & Zhang, J. (2018). Balance sheet conservatism and debt contracting. Contemporary Accounting Research, 35(1), 494-524.
- Vichitsarawong, T., Eng, L.L., & Meek, G.K. (2010). The impact of the Asian financial crisis on conservatism and timeliness of earnings: Evidence from Hong Kong, Malaysia, Singapore, and Thailand. Journal of International Financial Management & Accounting, 21(1), 32-61.
- Watts, R.L., & Zuo, L. (2012). Accounting conservatism and firm value: Evidence from the global financial crisis. WorkingPaper.