Research Article: 2017 Vol: 21 Issue: 2
Does Vertical Integration Strategy for Merger & Acquisitions a Fruitful Decision? An Evidence From Pakistani Merger Market
Zaib Maroof, National Defence University Islamabad
SM Amir Shah, Allama Iqbal Open University Islamabad
Bilal Ahmad, University of Ulster
Keywords
Merger & Acquisition, Vertical Mergers, Financial Ratio, Integration Strategies.
Introduction
The revolution of information technology has greatly influenced the business world. It has changed the market place from geographical basis to global. Researchers have demonstrated that in order to compete with rivals and expanding businesses, different integration strategies are used by firms (David, 2000). David (2000) discussed in his book “Strategic Management concepts and cases” that different Integration strategies are adopted by firms at domestic and International level according to the circumstances. Among all the integration strategies the most widely used includes vertical integration strategies, diversification strategies and defensive strategies however the type and mean of adopting and implementing a strategy depends on the circumstances faced by the firms (David, 2000). Literature signified M&A activity the most widely used for expansion and has witnessed an upward trend (Santos et al., 2011).
Merger is, basically, a transaction between two equal size business partners, whereas acquisition is the transaction between two companies in which a financially strong company (acquirer) absorbs the financially weak company (target). However both are having a common aim to boost their shareholder’s wealth by increasing the stock prices (Coontz, 2004; Stalstedt and Eriksson, 2006; Ostergard, 2009). The review of the literature depicted that the two terms “Merger” and “acquisitions” are used jointly and without any distinction. The same terminology will be followed in this study.
Studies signifies that on the basis of the Integration Strategies there are three types of mergers namely vertical mergers, Conglomerate mergers (diversification) and horizontal mergers (Robert, Wallace and Moles, 2012). Vertical mergers are usually characterized by forward and backward integration along the supply chain, i.e., integrating with the distributors and suppliers of the business, respectively. Fan and Goyal (2002) investigated the impact of vertical mergers on wealth creation of the companies merged during the time period 1962 to 1996 and revealed that vertical mergers contributes positively towards the wealth creation of the merged companies.
Broadly, two viewpoints regarding the economic outcome of mergers and acquisition activity were evidenced in literature. Primarily, studies argued that vertical mergers can result in market foreclosure which consequently, decreases competition. Furthermore, it was followed by another concept contending that vertical mergers do not enhance market power and can often lead to a price reduction for the final good. John and Graham (1971) illustrated availability of substitution opportunities for production of final goods and encourages an upstream monopolist to control the downstream stage. Likewise, Fred (1981) also validated that vertical mergers are more probable to raise the price of the final good. Martin and Groff (1983) express that vertical integration by a monopolist or oligopolists into a monopolistically competitive downstream stage can lower welfare.
Extending the previous work, Slanger (1998) fill the gap and addressed the concern about market foreclosure by investigating three issues, i.e., will vertically integrated producers participate in the intermediate good market and if not, how will vertical merger affect the market for the intermediate goods and lastly how the change in the intermediate good market will affect competition in the final goods market? The findings indicated that vertical mergers have a potential to increase the price of intermediate goods which ultimately dominate the elimination of the double marginalization causing reduced cost of production, better quality control and increased price of the final goods and improved profits and financial performance.
Furthermore, Teerce (1981) also discovered that vertical mergers play a significant role in reducing systematic risk of the companies and ultimately increased returns. Frederikslust, Van der Wal and Westdijk (2017). Loughran and Vijhx (1997) found that the company’s shareholder wealth increased significantly as a result of merger and acquisition. Selcuk and Yilmaz (2011) evidenced that financial performance of the acquired firms, in contrast to target firms, decreased as a result of the Merger and acquisition activity.
Very little evidence has been found about the M&A activities in Pakistan despite the fact that M&A activities had increased considerably across the globe. Numerous studies have been conducted across the globe that investigated the post-merger financial performance and the impact of merger deals on the share holder’s wealth patterns. In Pakistan almost negligible researches have been done in this area and a very few studies have been carried out to investigates the Impact of Mergers and Acquisitions on Shareholders Wealth (Bashir et al., 201l). Bashir et al. (2007) proposed that M&A activity has no impact on the wealth maximization of the merged firms in Pakistan, in contrast to the literature and the findings of the global researches.
Kemal (2011) further analyzed the four years financial statements (2006-2009) of the Royal Bank of Scotland (RBS) to measure its Post-Merger Profitability. Findings revealed that profitability, cash flows, liquidity, leverage and assets management of the RBS was satisfactory before the merger deal but its profitability and performance decline after the merger. Arshad (2012) analyzed the post-merger performance of Standard Chartered Bank in Pakistan and results revealed that financial performance of the Standard Chartered Bank decreased after the merger. Usman et al. (2008) proposed that post-merger operating performance of the firms in textile sectors of Pakistan also decreased as compared to the pre-merger financial performance.
Literature Review
Researches demonstrated M&A activity from different perspectives. Mantravadi and Reddy (2007); Agrawal, Jaffe and Mandelker (1992) demonstrated the impact of merger and acquisition on the relative size and operating performance of the firms. The findings suggested that when there is a difference in the relative size of the acquirer and the target firm the impact of mergers on operating performance is decreased. Menapara (2007); Dewan (2007) examined the impact of M&A activity on the financial performance of the Indian corporate sector. The results revealed that there was a significant difference between the financial performance of the companies before the merger and after the merger. Liargovas and Repousis (2011) further examined the impact of the merger and acquisition on the performance of the Greek Banking Sector. Event study methodology was used to analyze the data and overall results indicated that Mergers and acquisitions held in Greek banking sector have no impact on their financial performance and also do not create shareholders wealth (Liargovas & Repousis, 2011).
Capron (1999) investigated the impact of the post acquisition assets divestiture and the resource redeployment on the long-term performance of the merged firms. The results discovered that asset divestiture and the resource redeployment of merged firms played a significant role in the improving the post merger performance of the firms (Capron, 1999). Bettis and Hall (1982); Chang and Thomas (1989); Selcuk & Kiymaz (2013) showed that strategically related firms encounter lower risk and more return but the firms merged through unrelated diversification or the conglomerate strategy encounter higher risk and low returns. Teerce (1981) investigated the impact of vertical mergers on wealth creation and financial performance of the merged companies and findings revealed that vertical mergers contributed positively towards the wealth creation and reducing systematic risk. (Fan & Goyal, 2002).
Afzal and Yusuf (2011) investigated the impact of mergers on efficiency of banks in Pakistan. The results revealed that the mergers held in banking sector reported improvement in the cost efficiency in Pakistan from 93.83% to 94.15%. Kouser and Saba (2011) examined the impact of M&A activity on the profitability of the merged banks in Pakistan. The six financial ratios, i.e., profitability ratio, return to net worth ratio, invested capital ratio and debt to equity ratio were used to analyze the data by using the paired sample t-test, findings showed that the financial performance of the merged commercial banks decreased after the mergers (Kouser & Saba, 2011). Rehman et al. (2011) investigated that do bank mergers lead to efficiency gains in Pakistan. Findings revealed that efficiency effect is marginal and pre merger efficiency of acquirer didn’t contribute anything in efficiency (Rehman et al., 2011). Usman, Wang, Mehmood and Shahid (2010) investigated the impact of Scale Efficiency in Banking Sector of Pakistan. For analytical purpose banks were divided into three categories: domestic private banks, state owned Banks and foreign owned banks. Foreign owned banks were reported most efficient, followed by state owned banks and domestic private banks were found to be the least efficient (Usman et al., 2010). Shaukat et al. (2013) examined the impact of merger and acquisition on operating performance and shareholder wealth in Pakistan banking sector. The findings showed the operating performance and the shareholder wealth of the banks have decreased after the merger as compared to before merger (Shaukat et al., 2013).
Apropos in view, a need is identified to carry out an in-depth comprehensive analysis of the impact of M&A on the financial performance of the merged firms in Pakistan with an aim to analyze the pre merger & post merger financial statements of all the merged firms in all sector from time period 2000 to 2010 and then identify whether mergers in Pakistan are contributing significantly to financial growth of the companies or not. This study adopted a different methodology to investigate the issue from the strategic perspective. Literature evidenced that all the companies that merged during time period 2000 to 2010 adopted certain integration strategy for merging with the target company. Some of the companies merge through vertical integration, some adopt horizontal integration strategy and some merged through conglomerate integration strategy. The current study investigated this issue and analyzed the 3 to 5 years pre merger and post merger financial performance of the companies merged through vertical integration strategies with an aim to examine the financial performance of merger deals held in Pakistan and suggesting the way forward to the advisory firms and investment banks. Hence the study investigates to answer two questions: First, is a vertical integration strategy has an impact on the financial performance of merged firms in Pakistan? Second, is an adopting vertical integration strategy having an impact on the Profitability of the merged firms in Pakistan?” Further this study may assist the government policy makers in formulating a policy that can increase the volume of merger activity in Pakistan and further these policy makers may recommend to advisory firms, Multinational Corporations and investment banks whether the vertical integration strategy is suitable strategy of mergers deals for clients in Pakistan or not. Finally, this study may suggest the researchers, financial analysts and business owner, a guideline whether vertical integration strategy is a suitable strategy in Pakistan to carry out M&A activity or not.
There will be seven hypotheses that are as follow:
H1, H2, H3, H4, H5, H6 and H7
There is a significant difference between the Pre and Post Merger means of current ratio, sales growth, NPM, ROE, operating expense, Interest coverage Ratio and Debt to equity Ratio respectively (Figure 1).

Figure 1:Theoretical Framework.
Sources of Data Collection (Secondary) Resources
In the current study the data regarding the merger deals held from 2000 to 2010 was identified from the official website of Pakistan Stock Exchange (KSE) and Security & Exchange Commission of Pakistan (SECP). The data required for the financial analysis prominently includes 3 to 5 years premerger and 3 to 5 years post-merger financial statement of the merged companies for both the target and the acquire firms. Financial statements of the companies were collected from the State bank of Pakistan (SBP) website and Paksearch.com website. Some of the financial statements were obtained from the company’s website and by personally contacting the companies as well.
Initially 23 Merger events were observed from the time period of 10 years from year 2000 to 2010 amalgamated through vertical Integration Strategies. However 6 merger events were dropped due to non-availability of the financial data and final sample comprises of 17 merger deals held from 2000 to 2010.
Data Analysis Technique/Instruments
Financial Ratio Analysis was used to analyze the data. Total of seven ratios were calculated in the current study. These are Current Ratio, Sales Growth ratio, Net profit margin ratio, Return on equity ratio, Operating expense ratio, Interest coverage ratio and Debt to equity ratio to measure the liquidity, profitability, operating efficiency and financial leverage of the merged firms. The data were collected for each of the three to five years (-5, -4, -3, -2, -1) separately for both the acquirers’ and the target firms in the sample. Similarly, the testable variables are then calculated for the acquiring firms only for three to five years post merger period (+1, +2, +3, +4, +5). A combined mean for three years pre and combined mean for three years post-merger period were then calculated. The difference between the mean performance measure of the pre and post-merger years is then worked out. To verify the results and significant differences in the performances during the pre and post merger periods paired sample t-test was used
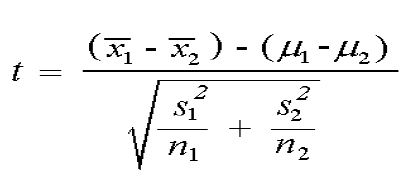
Where; X1=Target firm, X2=Acquirer firm, μ1=Population of Target firm, μ2=Population of Acquirer firm, S1=variance of target firm, S2=Variance of acquirer firm, n1=Sample of target firm, n2=Sample of Acquirer firm.
Further OLS multiple linear regressions were also used to measure the profitability of the merged firms. For the purpose of the current research we have used Return on Assets and Return on Equity as an indicator to measure the profitability of the vertically merged firms in Pakistan.
The Quantitative analysis of the data of the vertical mergers show that the current ratio of firms merged through vertical integration strategy increased during the post-merger period hence showing that the ability of the vertically merged firms to pay back their short term obligation improved after the mergers. The results of the statistical analysis for the sales growth Ratio also evidenced an improvement in sales during post-merger period hence indicating that the finished goods were more efficiently sold during post-merger period as compared to pre-merger period.
The findings of the t-test for the difference of mean between NPM ratio and ROE also reported more profits and improved financial performance. Moreover, the findings of the t-test for the difference of mean between Operating Expense Ratio decreasing trend as compared to operating income hence validate the increased efficiency of vertically integrated firms during post-merger period. The results further highlighted improved Interest Coverage ratio hence demonstrating improved ability of the firms to pay back their interest expense after the mergers lastly, debt to equity ratio also showed improvement during post-merger period.
Comprehensively, we can conclude that the liquidity position, sales growth, profitability and operating efficiency of the vertically merged firms increased after the merger while the risk/leverage of the vertically merged firms decreased during the post-merger period.
OLS Multiple Regression Analysis of Vertical Mergers
The regression equation is:
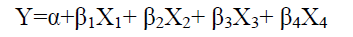
Where, Y=ROE, bi=the slopes of the regression line for variables xi, where i=1, 2, 3 and 4. α=y- intercept of the regression line, x1=Operating Expense, x2=Debt to Equity, x3=Sales Growth, x4 =Dummy Variable.
Current study investigated the impact of different sets of independent variables on the profitability of the vertical mergers. Two different indicators, i.e., Return on Equity and Return on Assets were used to measure the profitability of the vertical mergers.
| Table 1: Results Of Paired Sample T-Test |
|||||||
| Current Ratio | Sales Growth | NPM | ROE | ||||
|---|---|---|---|---|---|---|---|
| No. | Company | Year | T-Value | T-Value | T-Value | T-Value | |
| 1. | Shaheen Cotton Mills & Shehzad Textile Mills | 2004 | |||||
| Shaheen Cotton Mills | 6.54* | 0.10 | -3.61* | -2.84* | |||
| Shehzad Textile Mills | 4.35* | 0.06 | -0.88 | -2.00* | |||
| Shehzad Textile Mills | |||||||
| 2. | World Multi Media Ltd. & World Call Telecom Ltd | 2006 | |||||
| World Multi media Ltd. | -0.62 | -1.98 | -2.91* | -5.59* | |||
| World Call Telecom Ltd. | -1.05 | 10.91* | 0.41 | 0.74 | |||
| World Call Telecom Ltd. | |||||||
| 3. | Kohinoor Generatek Ltd. & Kohinoor Weaving Mills Ltd. | 2004 | |||||
| Kohinoor Generatek Ltd. | -26.6* | 3.43* | 5.56* | -1.53 | |||
| Kohinoor Weaving Mills Ltd. | -1.82 | 2.89* | -2.89* | -5.35* | |||
| Kohinoor Weaving Mills Ltd. | |||||||
| 4. | Atlas Lease & Atlas Investment Bank | 2002 | |||||
| Atlas Lease | 13.4* | 2.08* | 3.34* | 8.19* | |||
| Atlas investment bank | 2.5* | 2.05* | 2.54* | 6.94* | |||
| Atlas investment bank | |||||||
| 5. | WORLDCALL Broadcast & WORLDCALL Telecom Ltd. | 2006 | |||||
| WORLDCALL Broadcast Ltd. | -0.54 | -1.87 | -2.43* | -3.35* | |||
| WORLDCALL Telecom Ltd. | -1.05 | 10.9* | 0.41 | 0.74 | |||
| WORLDCALL Telecom Ltd. | |||||||
| 6. | World Call Communication & World Call Telecom Ltd. | 2006 | |||||
| World Call Communication | -0.42 | -1.64 | -1.19 | -4.10* | |||
| World Call Telecom Ltd. | -1.05 | 10.9* | 0.41 | 0.74 | |||
| World Call Telecom Ltd. | |||||||
| 7. | Atlas investment bank, Atlas bank Ltd. | 2004 | |||||
| Atlas investment bank | -9.48* | -1.14 | -3.61* | 3.88* | |||
| Atlas bank Ltd. | -2.64* | -1.14 | -1.13 | 7.81* | |||
| Atlas bank Ltd. | |||||||
| 8. | Pakistan Industrial Leasing Corp. Ltd & Trust Investment Bank Ltd | 2001 | |||||
| Pakistan Industrial Leasing Corp. Ltd. | 10.55* | 2.97* | -3.61* | 3.22* | |||
| Trust Investment Bank Ltd. | 8.51* | 3.62* | -1.13 | 3.03* | |||
| Trust Investment Bank Ltd. | |||||||
| 9. | Elahi Spinning & Taj Textile mills | 2000 | |||||
| Elahi Spinning | 5.57* | 2.02* | -3.61* | 2.31* | |||
| Taj Textile mills | 2.12* | 2.67* | -1.13 | 1.56 | |||
| Taj Textile mills | |||||||
| 10. | Nafees Cotton Mills Legler-Nafees Denim Mills Ltd. | 2004 | |||||
| Nafees Cotton Mills Ltd. | -1.97 | -0.300 | 5.33* | 2.64* | |||
| Legler-Nafees Denim Mills Ltd. | 7.78* | -0.301 | 4.81* | 0.46 | |||
| Legler-Nafees Denim Mills Ltd. | |||||||
| 11. | KASB Company Ltd & KASB Bank Ltd. | 2003 | |||||
| KASB Company Ltd. | 2.94* | 3.67* | 5.33* | 5.88* | |||
| KASB Bank Ltd. | 2.84* | -9.07* | 4.81* | -2.24* | |||
| KASB Bank Ltd. | |||||||
| 12. | Dawood Cotton Mill & Dawood Lawrencepur Ltd. | 2004 | |||||
| Dawood Cotton Mill | -7.25* | -7.25* | 2.04* | 12.9* | |||
| Dawood Lawrencepur Ltd. | |||||||
| 13. | Lawrencepur Woolen & Textile Mills Ltd. & Dawood Lawrencepur Ltd. | 2004 | |||||
| Lawrencepur Woolen & Textile Mills Ltd. | -2.00* | -36.6* | 1.98* | 10.9* | |||
| Dawood Lawrencepur Ltd. | |||||||
| 14. | Burewala Textile Mill & Dawood Lawrencepur Ltd. | 2004 | |||||
| Burewala Textile Mill | -1.19 | 441.3* | 2.01* | 6.62* | |||
| Dawood Lawrencepur Ltd. | |||||||
| 15. | Dilon Mills Ltd. & Dawood Lawrencepur Ltd. | 2004 | |||||
| Dilon Mills Ltd. | -1.19 | -0.15 | 2.08* | 10.2* | |||
| Dawood Lawrencepur Ltd. | |||||||
| 16. | Ibrahim Textile Mill & Ibrahim Fibers | 2002 | |||||
| Ibrahim Textile Mill | -6.24* | -7.18* | 2.31* | 4.27* | |||
| Ibrahim Fibers | -6.20* | -4.39* | -2.53* | 2.69* | |||
| Ibrahim Fibers | |||||||
| 17. | Orix investment bank & Orix lease | 2009 | |||||
| Orix investment bank | 2.34* | 6.22* | -452.5* | -10.72* | |||
| Orix lease | 3.77* | -0.75 | -1.56 | -0.31 | |||
| Orix lease | |||||||
Significance level 1% (**), 5%(*).
| Table 2: Results Of Paired Sample T-Test |
||||||||
| Operating Expense | Interest coverage | Debt to Equity | ||||||
|---|---|---|---|---|---|---|---|---|
| No. | Company | Year | T-Value | T-Value | T-Value | |||
| 1. | Shaheen Cotton Mills & Shehzad Textile Mills | 2004 | ||||||
| Shaheen Cotton Mills | 3.46* | -16.1* | -11.4* | |||||
| Shehzad Textile Mills | 5.32* | -1.76 | -3.11* | |||||
| Shehzad Textile Mills | ||||||||
| 2. | World Multi media Ltd. & World Call Telecom Ltd. | 2006 | ||||||
| World Multi media Ltd. | 8.55* | 2.77* | 0.49 | |||||
| World Call Telecom Ltd. | 5.0* | 1.67 | -0.40 | |||||
| World Call Telecom Ltd. | ||||||||
| 3. | Kohinoor Generatek Ltd. & Kohinoor Weaving Mills Ltd. | 2004 | ||||||
| Kohinoor Generatek Ltd. | 3.43* | -4.26* | 8.83* | |||||
| Kohinoor Weaving Mills Ltd. | 2.89* | -8.26* | 2.87* | |||||
| Kohinoor Weaving Mills Ltd. | ||||||||
| 4. | Atlas Lease & Atlas Investment Bank | 2002 | ||||||
| Atlas Lease | -130.3* | 13.2* | -466.3* | |||||
| Atlas investment bank | 2.82* | -1.51 | -2.35* | |||||
| Atlas investment bank | ||||||||
| 5. | WORLDCALL Broadcast & WORLDCALL Telecom Ltd. | 2006 | ||||||
| WORLDCALL Broadcast Ltd. | 8.05* | 3.15* | -0.60 | |||||
| WORLDCALL Telecom Ltd. | 5.0* | 1.67 | -0.40 | |||||
| WORLDCALL Telecom Ltd. | ||||||||
| 6. | World Call Communication & World Call Telecom Ltd. | 2006 | ||||||
| World Call Communication | 7.52* | 3.13* | -0.60 | |||||
| World Call Telecom Ltd. | 5.0* | 1.67 | -0.40 | |||||
| World Call Telecom Ltd. | ||||||||
| 7. | Atlas investment bank; Atlas bank Ltd. | 2004 | ||||||
| Atlas investment bank | 4.27* | 27.61* | -249.3* | |||||
| Atlas bank Ltd. | 2.98* | 28.15* | -254.9* | |||||
| Atlas bank Ltd. | ||||||||
| 8. | Pakistan Industrial Leasing Corp. Ltd. & Trust Investment Bank Ltd. | 2001 | ||||||
| Pakistan Industrial Leasing Corp. Ltd. | -2.18* | 3.25* | -79.98* | |||||
| Trust Investment Bank Ltd. | 5.59* | 5.89* | -28.36* | |||||
| Trust Investment Bank Ltd. | ||||||||
| 9. | Elahi Spinning & Taj Textile mills | 2000 | ||||||
| Elahi Spinning | 23.3* | 3.30* | 0.52 | |||||
| Taj Textile mills | 2.00* | 1.66 | -4.34* | |||||
| Taj Textile mills | ||||||||
| 10. | Nafees Cotton Mills Legler-Nafees Denim Mills Ltd. | 2004 | ||||||
| Nafees Cotton Mills Ltd. | 5.05* | 0.27 | 5.37* | |||||
| Legler-Nafees Denim Mills Ltd. | -0.92 | 1.81 | -1.24* | |||||
| Legler-Nafees Denim Mills Ltd. | ||||||||
| 11. | KASB Company Ltd. & KASB Bank Ltd. | 2003 | ||||||
| KASB Company Ltd. | -0.87 | 0.92 | 7.04* | |||||
| KASB Bank Ltd. | 0.89 | -2.83* | 2.88* | |||||
| KASB Bank Ltd. | ||||||||
| 12. | Dawood Cotton Mill & Dawood Lawrencepur Ltd. | 2004 | ||||||
| Dawood Cotton Mill | 145.0* | 2.87* | 0.98 | |||||
| Dawood Lawrencepur Ltd. | ||||||||
| 13. | Lawrencepur Woolen & Textile Mills Ltd. & Dawood Lawrencepur Ltd. | 2004 | ||||||
| Lawrencepur Woolen & Textile Mills Ltd. | 75.09* | 1.09 | -2.85* | |||||
| Dawood Lawrencepur Ltd. | ||||||||
| 14. | Burewala Textile Mill & Dawood Lawrencepur Ltd. | 2004 | ||||||
| Burewala Textile Mill | 0.66 | -13.07* | -2.30* | |||||
| Dawood Lawrencepur Ltd. | ||||||||
| 15. | Dilon Mills Ltd. & Dawood Lawrencepur Ltd. | 2004 | ||||||
| Dilon Mills Ltd. | 52.0* | 14.45* | 0.28 | |||||
| Dawood Lawrencepur Ltd. | ||||||||
| 16. | Ibrahim Textile Mill & Ibrahim Fibers | 2002 | ||||||
| Ibrahim Textile Mill | 1.60 | 2.36* | -12.65* | |||||
| Ibrahim Fibers | 1.53 | -1.19 | -9.77* | |||||
| Ibrahim Fibers | ||||||||
| 17. | Orix investment bank & Orix lease | 2009 | ||||||
| Orix investment bank | -361* | -39.4* | 0.19 | |||||
| Orix lease | 0.50 | 2.05* | -1.58 | |||||
| Orix lease | ||||||||
| Table 3: Comparative Analysis Of Financial Ratio |
||
| S. no. | Ratio | Vertical Merger |
|---|---|---|
| 1 | Current Ratio | Improved |
| 2 | Sales Growth Ratio | Improved |
| 3 | NPM | Improved |
| 4 | ROE | Improved |
| 5 | Operating Expense Ratio | Deteriorated |
| 6 | Interest Coverage Ratio | Improved |
| 7 | Debt to Equity | Deteriorated |
| S. no. | Ratio | Vertical Merger |
| 1 | Liquidity position | Improved |
| 2 | Profitability | Improved |
| 3 | Operating Efficiency | Improved |
| 4 | Financial Leverage | Declined |
| Table 4: Results Of Regression Analysis For Return On Equity Model Summary |
||||
| Model | R | R Square | Adjusted R square | Std.Error of Estimate |
|---|---|---|---|---|
| 1 | 0.283a | 0.080 | 0.059 | 0.71493 |
a: Predictors (Constant), Dummy Var, Sales G, Debt to Equity, Operating Exp
| ANOVA a | |||||
| Model | Sum of Square | df | Mean Square | F | Sig. |
|---|---|---|---|---|---|
| Regression Residual Total |
7.816 89.446 97.261 |
4 175 179 |
1.954 0.511 |
3.823 | 0.005b |
| a. Dependent Variable: ROE | |||||
| b. Predictors: (Constant), Dummy Variable, Sales G, Debt to Equity, Operating Exp | |||||
| Coefficients | ||||||||
|---|---|---|---|---|---|---|---|---|
| Model | Unstandardized Coefficients | Stand Co | t value | Sig | Collinearity Statistics | |||
| B | Std. Error | Beta | tolerance | VIF | ||||
| (Constant) | -0.074 | 0.076 |
-0.971 |
0.333 | ||||
| OperExp Debt Equity SalesG DummyVar |
-0.021 0.030 0.023 0.176 |
0.079 0.014 0.008 0.108 |
-0.019 0.156 0.215 0.120 |
-0.263 |
0.793 0.033 0.004 0.104 |
0.981 0.995 0.997 .0981 |
1.019 1.005 1.003 1.019 |
|
P<0.05
Tables 1-4 mentioned above shows the result of the regression analysis carried out when sales growth, debt to equity, operating expense and premerger & post-merger dummy variable were acting as an independent variable and ROE as a dependent variable. The value of R2=0.059 which reveals that 6% change in the dependent variable is caused by these independent variables. Furthermore the beta value tells us the change in the outcome variable due to unit change in the predictor. The t-values demonstrate that Debt to equity (2.14, P<0.033) and Sales growth (2.955, P<0.004) contributed significantly in enhancing profitability of vertical mergers in terms of ROE while Operating expense do not contribute significantly in bringing change in the ROE of Vertically merged firms. The Dummy variable is significant at (t value 1.63, P<0.10) hence showing that there is a difference between Pre Merger and Post-Merger performance of Vertically Integrated firms in case of Pakistan.
| Table 5: Results Of Regression Analysis For Return On Assets Model Summary |
||||
| Model | R | R Square | Adjusted R square | Std.Error of Estimate |
|---|---|---|---|---|
| 1 | 0.839a | 0.704 | 0.697 | 0.46196 |
a: Predictors (Constant), Dummy Var, Sales G, Debt to Assets and Total Asset turnover .
| ANOVA b | ||||||
|---|---|---|---|---|---|---|
| Model | Sum of Squares | df | Mean Square | F | Sig. | |
| 1 | Regression | 88.819 | 4 | 22.205 | 104.049 | 0.000a |
| Residual | 37.346 | 175 | 0.213 | |||
| Total | 126.165 | 179 | ||||
| a. Predictors: (Constant), Debt Asset, TOA, SalesG, DummyVar | ||||||
| b. Dependent Variable: ROA | ||||||
| Coefficients | ||||||||
| Model | Unstandardized Coefficients | Standardized Coefficients | t | Sig. | Collinearity Statistics | |||
|---|---|---|---|---|---|---|---|---|
| B | Std. Error | Beta | Tolerance | VIF | ||||
| 1 | (Constant) | 0.004 | 0.050 | 0.081 | 0.936 | |||
| DummyVar | 0.140 | 0.069 | 0.084 | 2.019 | 0.045 | 0.985 | 1.015 | |
| SalesG | -0.004 | 0.005 | -0.031 | -0.758 | 0.450 | 1.000 | 1.000 | |
| TOA | 0.032 | 0.002 | 0.831 | 20.196 | 0.000 | 0.999 | 1.001 | |
| Debt Asset | -0.007 | 0.011 | -0.028 | -0.684 | 0.495 | 0.986 | 1.014 | |
| a. Dependent Variable: ROA | ||||||||
P<0.05
Table 5 above shows the result of the regression analysis carried out when sales growth, debt to Assets, Total Assets turnover and pre-merger and post-merger dummy variable were acting as an independent variable and ROA as a dependent variable. The value of R2=0.70 which reveals that 70% change in the dependent variable is caused by these independent variables. Furthermore the beta value tells us the change in the outcome variable due to unit change in the predictor. The t-values demonstrate that total assets turnover (0.831, P<0.05) is significantly contributing in enhancing profitability in terms of ROA while Debt to Assets and Sales Growth do not contribute significantly in bringing change in ROA of Vertically merged firms. The Dummy variable is significant at (t value 2.019, P<0.10) hence showing that there is a difference between Pre Merger and Post-Merger performance of Vertically Integrated firms in case of Pakistan.
Discussion
The results indicate that the liquidity position of the vertically merged firms improved during the post-merger period hence depicting that the firms which adopted Vertical integration strategy for mergers had reported improved ability to pay back their short term obligations and had good financial health and resultantly faced less financial difficulties during post-merger period in Pakistan. Hence all hypotheses have been accepted i.e. significant difference exits between the Pre-Merger and Post Merger means of current ratio of Vertically Integrated firms.
The results further evidence that the Sales of the vertically merged firms improved after the merger demonstrating that the firms which adopted Vertical integration strategy for merger in Pakistan do not lose their sales during the Post-merger period hence depicting that the compounded annualized rate of growth of a company's revenues, earnings and in turn dividends get better after the merge. Hence we can reject Null Hypothesis (H0) and accept alternate Hypothesis (H9), i.e., significant difference exits between the Pre-Merger and Post-Merger means of Sales Growth of vertically merged firms.
The findings also evidenced that the profitability of firms that adopted Vertical Integration strategy for mergers inclined after the merger depicting higher earnings & Revenues of the firms during the post-merger period hence we can reject Null Hypothesis (H0) and accept alternate Hypothesis (H3) & (H4), i.e., significant difference exits between the Pre-Merger and Post-Merger means of NPM Ratio and ROE Ratio of Vertically merged firms.
The results showed that the operating expense ratio of the firms merged through vertical integration strategy deteriorated after the merger hence depicting that the Operating efficiency of vertically integrated company’s increased during Post Merger Period because lower Operating expense Ratio depicts that the company has lower Operating expenses as compared to gross operating income. Hence we can reject Null Hypothesis (H0) and accept alternate Hypothesis (H5), i.e., significant difference exits between the Pre-Merger and Post Merger means of Operating expense ratio of vertically merged firms.
The findings showed that the interest coverage ratio of the firms merged through vertical integration strategy improved after the merger hence depicting that the ability of the vertically merged firms to pay their interest payment or outstanding debts inclined after the merger. Hence we can reject Null Hypothesis (H0) and accept alternate Hypothesis (H6), i.e., significant difference exits between the Pre-Merger and Post Merger means of Interest coverage ratio of vertically merged firms. The findings showed that the Debt to Equity ratio of the merged firms deteriorated after the merger hence showing that the vertically merged firms relied more on shareholders' equity relative to debt and hence signify that risk profile and financial leverage of the vertically merged company’s improved after the merger. Hence we can reject Null Hypothesis (H0) and accept alternate Hypothesis (H7), i.e., significant difference exits between the Pre-Merger and Post Merger means of debt to equity ratio of vertically merged firms.
Overall the financial ratio analysis of the vertically merged firms showed that on an average Liquidity position, Profitability, Operating Efficiency of the vertically merged firms improved during post-merger period while financial leverage (Risk) declined during post-merger period. Likewise, results of the regression analysis reported improved profitability of Vertical mergers when return on assets was used as a profitability measure however the results were although positive but weak when return on equity was used as a profitability measure in the current study.
Although, the results of OLS Regression for ROA strongly evidenced improved profitability of Vertical mergers in Pakistan during time period 2000 to 2010. At the same time very small statistical evidence, i.e., only 6% regarding the ROE measure of profitability has also been evidenced with respect to the variables, dimensions and time frame adopted in the current study. Furthermore, the study advocated that unstable economic and political condition, poor law and order situation, absence of regulatory quality & Rule of law, lack of governance, aggravated terrorism activities during the study period, decreased FDI, stock market crash, high inflation, unemployment, increased corruption, poor investment opportunities, flight of large amounts of capital from Asian countries, etc., might have contributed in decreased profitability in terms of ROE for the case of Pakistan hence opening the doors for future researchers to investigate the this issue intensely in context of Pakistan as the current study is an initial study of its nature in Pakistan.
Conclusion
Economic condition of Pakistan encountered huge challenges since last two decades; one among them is to generate opportunities for the investment in Pakistan. The current study investigated and explores the impact of Vertical integration strategy on the financial performance of the merged firms in Pakistan. The results of the financial ratio analysis demonstrated that vertical integration strategy is the most effective integration strategies adopted by the firms for conducting merger deals in Pakistan from time period 2000 to 2010. The findings further revealed that the firms that adopted vertical integration strategy for merging reported improvement in liquidity position, profitability, Operating efficiency and financial leverage during the post-merger period and hence is identified as an effective integration strategy. Therefore findings suggest that Vertical Integration strategy is the most favorable in Pakistani environment and hence recommends Investors, MNCs, advisory firms and Investment Banks to adopt vertical integration strategy for conducting future merger deals in Pakistan and also suggests their clients. Moreover, the study recommends that the Planning commission of Pakistan should formulate a proper mechanism for selecting a suitable integration strategy after properly analyzing the previous trends and financial facts in the industry.
Limitation & Future Researches
As the current study is a pioneer study in context of the issue under discussion in Pakistan therefore the future researchers must investigate certain untapped economic and financial factors that have contributed in bringing decreased change in profitability in terms of ROE in Pakistan. Furthermore, current study analyzed the impact of Vertical integration strategy on financial performance and profitability of the merged firms in Pakistan. Future researchers should also investigate the impact of Horizontal and Conglomerate strategy on the financial performance of the merged firms in Pakistan. Moreover, comparative analysis on the aforementioned strategies by future researchers can also produce fruitful results in scenario of Pakistan. The current study used seven financial ratio to measure the financial performance of the firms while the future researchers could make use of acid test ratio, Quick ratio, Operating profit margin, pretax profit margin, Return on investment, Return on Capital employed, EPS & Market value ratio to quantify the performance of the merged firms in Pakistan. Lastly, sectoral analysis in context of Pakistan can also yield beneficial results (Appendix).
Appendix
| Table 1: Paired T-Test Analysis For Current Ratio Of Sampled Vertical Mergers |
|||||||||||||||||
| Event No. | Company | Years | Mean/ SD |
Premerger | Post-Merger | T-Value | |||||||||||
|---|---|---|---|---|---|---|---|---|---|---|---|---|---|---|---|---|---|
| 1. | Shaheen Cotton Mills & Shehzad Textile Mills | 2004 | |||||||||||||||
| Shaheen Cotton Mills | Mean | 0.36 | 6.54* | ||||||||||||||
| S.D | 0.15 | ||||||||||||||||
| Shehzad Textile Mills | Mean | 1.02 | 4.35* | ||||||||||||||
| S.D | 0.16 | ||||||||||||||||
| Shehzad Textile Mills | Mean | 2.33 | |||||||||||||||
| S.D | 0.49 | ||||||||||||||||
| 2. | World Multi media Ltd. & World Call Telecom Ltd. | ||||||||||||||||
| World Multi media Ltd. | Mean | 1.91 | -0.62 | ||||||||||||||
| S.D | 1.21 | ||||||||||||||||
| World Call Telecom Ltd. | Mean | 2.5 | -1.05 | ||||||||||||||
| S.D | 2.34 | ||||||||||||||||
| World Call Telecom Ltd. | Mean | 1.06 | |||||||||||||||
| S.D | 0.22 | ||||||||||||||||
| 3. | World Call Broad Cast Ltd. & World Call Telecom Ltd. | 2006 | |||||||||||||||
| World Call Broad Cast Ltd. | Mean | 1.80 | -0.54 | ||||||||||||||
| S.D | 0.55 | ||||||||||||||||
| World Call Telecom Ltd. | Mean | 2.5 | -1.05 | ||||||||||||||
| S.D | 2.34 | ||||||||||||||||
| World Call Telecom Ltd. | Mean | 1.06 | |||||||||||||||
| S.D | 0.22 | ||||||||||||||||
| 4. | World Call Communication & World Call Telecom Ltd. | 2006 | |||||||||||||||
| World Call Communication | Mean | 1.63 | -0.42 | ||||||||||||||
| S.D | 0.25 | ||||||||||||||||
| World Call Telecom Ltd. | Mean | 2.50 | -1.05 | ||||||||||||||
| S.D | 2.34 | ||||||||||||||||
| World Call Telecom Ltd. | Mean | 1.06 | |||||||||||||||
| S.D | 0.22 | ||||||||||||||||
| 5. | Kohinoor Generetek Ltd. &Kohinoor Weaving Mills Ltd. | 2004 | |||||||||||||||
| Kohinoor Generatek Ltd. | Mean | 2.28 | -26.6* | ||||||||||||||
| S.D | 0.60 | ||||||||||||||||
| Kohinoor Weaving Mills Ltd. | Mean | 0.98 | -1.82 | ||||||||||||||
| S.D | 0.03 | ||||||||||||||||
| Kohinoor Weaving Mills Ltd. | Mean | 0.88 | |||||||||||||||
| S.D | 0.08 | ||||||||||||||||
| 6. | Atlas Lease & Atlas Investment Bank | 2002 | |||||||||||||||
| Atlas Lease | Mean | 0.81 | 13.4* | ||||||||||||||
| S.D | 0.55 | ||||||||||||||||
| Atlas investment bank | Mean | 1.11 | 2.5* | ||||||||||||||
| S.D | 0.04 | ||||||||||||||||
| Atlas investment bank | Mean | 1.17 | |||||||||||||||
| S.D | 0.00 | ||||||||||||||||
| 7. | Atlas investment bank &Atlas bank Ltd. | 2004 | |||||||||||||||
| Atlas investment bank | Mean | 1.17 | -9.48* | ||||||||||||||
| S.D | 0.01 | ||||||||||||||||
| Atlas bank Ltd. | Mean | 0.56 | -2.64* | ||||||||||||||
| S.D | 0.15 | ||||||||||||||||
| Atlas bank Ltd. | Mean S.D |
0.33 | |||||||||||||||
| 0.02 | |||||||||||||||||
| 8. | Pakistan Industrial Leasing Corp. Ltd. &Trust Investment Bank Ltd. | 2001 | |||||||||||||||
| Pakistan Industrial Leasing Corp. Ltd. | Mean | 0.23 | 10.55* | ||||||||||||||
| S.D | 0.02 | ||||||||||||||||
| Trust Investment Bank Ltd. | Mean | 0.55 | 8.51* | ||||||||||||||
| S.D | 0.18 | ||||||||||||||||
| Trust Investment Bank Ltd. | Mean | 1.90 | |||||||||||||||
| S.D | 0.20 | ||||||||||||||||
| 9. | Elahi Spinning & Taj Textile Mills | 2000 | |||||||||||||||
| Elahi Spinning | Mean | 0.70 | 5.57* | ||||||||||||||
| S.D | 0.02 | ||||||||||||||||
| Taj Textile mills | Mean | 0.99 | 2.12* | ||||||||||||||
| S.D | 0.09 | ||||||||||||||||
| Taj Textile mills | Mean | 1.17 | |||||||||||||||
| S.D | 0.11 | ||||||||||||||||
| 10. | Nafees Cotton Mills Ltd. & Legler-Nafees Denim Mills Ltd. | 2004 | |||||||||||||||
| Nafees Cotton Mills Ltd. | Mean | 1.26 | -1.97 | ||||||||||||||
| S.D | 0.25 | ||||||||||||||||
| Legler-Nafees Denim Mills Ltd. | Mean | 0.02 | 7.78* | ||||||||||||||
| S.D | 0.07 | ||||||||||||||||
| Legler-Nafees Denim Mills Ltd. | Mean | 1.94 | |||||||||||||||
| S.D | 0.54 | ||||||||||||||||
| 11. | KASB Company Ltd. & KASB Bank Ltd. | 2003 | |||||||||||||||
| KASB & Company Ltd. | Mean | 1.43 | 2.94* | ||||||||||||||
| S.D | 0.40 | ||||||||||||||||
| KASB Bank Ltd. | Mean | 1.39 | 2.84* | ||||||||||||||
| S.D | 0.44 | ||||||||||||||||
| KASB Bank Ltd. | Mean S.D |
2.19 | |||||||||||||||
| 0.18 | |||||||||||||||||
| 12. | Dawood Cotton Mill &Dawood Lawrencepur Ltd | 2004 | |||||||||||||||
| Dawood Cotton Mill | Mean | 4.98 | -7.25* | ||||||||||||||
| S.D | 0.48 | ||||||||||||||||
| Dawood Lawrencepur Ltd | Mean | 2.11 | |||||||||||||||
| S.D | 0.48 | ||||||||||||||||
| 13. | Lawrencepur Woolen Textile Mills Ltd. & Dawood Lawrencepur Ltd. | 2004 | |||||||||||||||
| Lawrencepur Woolen & Textile Mills Ltd. | Mean | 4.02 | -2.00* | ||||||||||||||
| S.D | 1.57 | ||||||||||||||||
| Dawood Lawrencepur Ltd. | Mean | 2.11 | |||||||||||||||
| S.D | 0.48 | ||||||||||||||||
| 14. | Burewala Textile Mill & Dawood Lawrencepur Ltd. | 2004 | |||||||||||||||
| Burewala Textile Mill | Mean | 2.44 | -1.19 | ||||||||||||||
| S.D | 1.91 | ||||||||||||||||
| Dawood Lawrencepur Ltd. | Mean | 2.11 | |||||||||||||||
| S.D | 0.48 | ||||||||||||||||
| 15. | Dilon Mills Ltd & Dawood Lawrencepur Ltd. | 2004 | |||||||||||||||
| Dilon Mills Ltd. | Mean | 2.44 | |||||||||||||||
| S.D | 1.91 | ||||||||||||||||
| Dawood Lawrencepur Ltd. | Mean | 2.11 | -1.19 | ||||||||||||||
| S.D | 0.48 | ||||||||||||||||
| 16. | Ibrahim Textile Mill & Ibrahim Fibers (2002) | 2002 | |||||||||||||||
| Ibrahim Textile Mill | Mean | 0.95 | -6.24* | ||||||||||||||
| S.D | 0.07 | ||||||||||||||||
| Ibrahim Fibers | Mean | 2.66 | -6.20* | ||||||||||||||
| S.D | 0.51 | ||||||||||||||||
| Ibrahim Fibers | Mean S.D |
0.82 | |||||||||||||||
| 0.03 | |||||||||||||||||
| 17. | Orix investment bank & Orix lease 2009 | 2009 | |||||||||||||||
| Orix Investment bank | Mean | 1.66 | 2.34* | ||||||||||||||
| S.D | 0.65 | ||||||||||||||||
| Orix Lease | Mean | 1.20 | 3.77* | ||||||||||||||
| S.D | 0.26 | ||||||||||||||||
| Orix Lease | Mean | 1.86 | |||||||||||||||
| S.D | 0.15 | ||||||||||||||||
Significance level 1% (**), 5% (*)
| Table 2: Paired T-Test For Sales Growth Ratio Of Sampled Vertical Mergers |
||||||
| Event No. | Company | Year | Mean/ SD |
Premerger | Post-Merger | T-Value |
|---|---|---|---|---|---|---|
| 1. | Shaheen Cotton Mills & Shehzad Textile Mills | 2004 | ||||
| Shaheen Cotton Mills | Mean | 0.27 | 0.10 | |||
| S.D | 0.95 | |||||
| Shehzad Textile Mills | Mean | 0.04 | 0.06 | |||
| S.D | 0.01 | |||||
| Shehzad Textile Mills | Mean | 0.13 | ||||
| S.D | 2.38 | |||||
| 2. | World Multi media Ltd. & World Call Telecom Ltd. | 2006 | ||||
| World Multi media Ltd. | Mean | 0.75 | -1.98 | |||
| S.D | 0.03 | |||||
| World Call Telecom Ltd. | Mean | -0.00 | 10.91* | |||
| S.D | 0.07 | |||||
| World Call Telecom Ltd. | Mean | 0.63 | ||||
| S.D | 0.06 | |||||
| 3. | Kohinoor Generatek Ltd. & Kohinoor Weaving Mills Ltd. | 2004 | ||||
| Kohinoor Generatek Ltd. | Mean | 0.15 | 3.43* | |||
| S.D | 0.04 | |||||
| Kohinoor Weaving Mills Ltd. | Mean | 0.22 | 2.89* | |||
| S.D | 0.22 | |||||
| Kohinoor Weaving Mills Ltd. | Mean | 0.63 | ||||
| S.D | 0.10 | |||||
| 4. | Atlas Lease & Atlas Investment Bank | 2002 | ||||
| Atlas Lease | Mean | 0.04 | 2.08* | |||
| S.D | 0.03 | |||||
| Atlas investment bank | Mean | 0.04 | 2.05* | |||
| S.D | 0.19 | |||||
| Atlas investment bank | Mean | 0.41 | ||||
| S.D | 0.23 | |||||
| 5. | WORLDCALL Broadcast & WORLDCALL Telecom Ltd. | 2006 | ||||
| WORLDCALL Broadcast Ltd. | Mean | 0.74 | -1.87 | |||
| S.D | 0.11 | |||||
| WORLDCALL Telecom Ltd. | Mean | 0.07 | 10.9* | |||
| S.D | -0.00 | |||||
| WORLDCALL Telecom Ltd. | Mean | 0.63 | ||||
| S.D | 0.06 | |||||
| 6. | World Call Communication & World Call Telecom Ltd. | 2006 | ||||
| World Call Communication | Mean | 0.73 | -1.64 | |||
| S.D | 0.02 | |||||
| World Call Telecom Ltd. | Mean | 0.07 | 10.9* | |||
| S.D | -0.00 | |||||
| World Call Telecom Ltd. | Mean | 0.63 | ||||
| S.D | 0.06 | |||||
| 7. | Atlas investment bank & Atlas bank Ltd. | 2004 | ||||
| Atlas investment bank | Mean | 0.50 | -1.14 | |||
| S.D | 0.63 | |||||
| Atlas bank Ltd. | Mean | 0.50 | -1.14 | |||
| S.D | 0.63 | |||||
| Atlas bank Ltd. | Mean | 0.03 | ||||
| S.D | 0.01 | |||||
| 8. | Pakistan Industrial Leasing Corp. Ltd. & Trust Investment Bank Ltd. | 2001 | ||||
| Pakistan Industrial Leasing Corp. Ltd. | Mean | -0.00 | 2.97* | |||
| S.D | 0.10 | |||||
| Trust Investment Bank Ltd. | Mean | -0.14 | 3.62* | |||
| S.D | 0.31 | |||||
| Trust Investment Bank Ltd. | Mean | 0.62 | ||||
| S.D | 0.19 | |||||
| 9. | Elahi Spinning & Taj Textile mills | 2000 | ||||
| Elahi Spinning | Mean | 0.10 | 2.02* | |||
| S.D | 0.01 | |||||
| Taj Textile mills | Mean | -0.16 | 2.67* | |||
| S.D | 0.72 | |||||
| Taj Textile mills | Mean | 0.95 | ||||
| S.D | 0.05 | |||||
| 10. | Nafees Cotton Mills Legler-Nafees Denim Mills Ltd. | 2004 | ||||
| Nafees Cotton Mills Ltd. | Mean | 0.03 | -0.300 | |||
| S.D | 0.01 | |||||
| Legler-Nafees Denim Mills Ltd. | Mean | 0.04 | -0.301 | |||
| S.D | 0.01 | |||||
| Legler-Nafees Denim Mills Ltd. | Mean | -0.10 | ||||
| S.D | 0.722 | |||||
| 11. | KASB Company Ltd. & KASB Bank Ltd. | 2003 | ||||
| KASB Company Ltd. | Mean | 0.54 | 3.67* | |||
| S.D | 0.08 | |||||
| KASB Bank Ltd. | Mean | 29.92 | -9.07* | |||
| S.D | 5.50 | |||||
| KASB Bank Ltd. | Mean | 1.04 | ||||
| S.D | 0.22 | |||||
| 12. | Dawood Cotton Mill & Dawood Lawrencepur Ltd. | 2004 | ||||
| Dawood Cotton Mill | Mean | 0.09 | -7.25* | |||
| S.D | 0.13 | |||||
| Dawood Lawrencepur Ltd. | Mean | -0.05 | ||||
| S.D | 0.54 | |||||
| 13. | Lawrencepur Woolen & Textile Mills Ltd. & Dawood Lawrencepur Ltd. | 2004 | ||||
| Lawrencepur Woolen & Textile Mills Ltd. | Mean | 0.01 | -36.6* | |||
| S.D | 0.08 | |||||
| Dawood Lawrencepur Ltd. | Mean | -0.05 | ||||
| S.D | 0.54 | |||||
| 14. | Burewala Textile Mill & Dawood Lawrencepur Ltd. | 2004 | ||||
| Burewala Textile Mill | Mean | 0.006 | 441.3* | |||
| S.D | 0.15 | |||||
| Dawood Lawrencepur Ltd. | Mean | -0.05 | ||||
| S.D | 0.54 | |||||
| 15. | Dilon Mills Ltd. & Dawood Lawrencepur Ltd. | 2004 | ||||
| Dilon Mills Ltd. | Mean | 0.13 | -0.15 | |||
| S.D | 0.34 | |||||
| Dawood Lawrencepur Ltd. | Mean | -0.05 | ||||
| S.D | 0.54 | |||||
| 16. | Ibrahim Textile Mill & Ibrahim Fibers | 2002 | ||||
| Ibrahim Textile Mill | Mean | 0.14 | -7.18* | |||
| S.D | 0.28 | |||||
| Ibrahim Fibers | Mean | 0.07 | -4.39* | |||
| S.D | 0.01 | |||||
| Ibrahim Fibers | Mean | -0.05 | ||||
| S.D | 0.04 | |||||
| 17. | Orix investment bank & Orix lease | 2009 | ||||
| Orix investment bank | Mean | -0.07 | 6.22* | |||
| S.D | 0.01 | |||||
| Orix lease | Mean | 0.13 | -0.75 | |||
| S.D | 0.11 | |||||
| Orix lease | Mean | 0.08 | ||||
| S.D | 0.04 | |||||
| Table 3 Paired T-Test for Net Profit Margin Ratio of Sampled Vertical Mergers |
||||||||
| Event No |
Company | Year | Mean/ SD |
Pre Merger |
Post Merger |
T-Value | ||
| 1. | Shaheen Cotton Mills & Shehzad Textile Mills | 2004 | ||||||
| Shaheen Cotton Mills | Mean | 1.16 | -3.61* | |||||
| S.D | 0.41 | |||||||
| Shehzad Textile Mills | Mean | 0.001 | -0.88 | |||||
| S.D | 0.003 | |||||||
| Shehzad Textile Mills | Mean | -0.38 | ||||||
| S.D | 0.35 | |||||||
| 2. | World Multi media Ltd & World Call Telecom Ltd | 2006 | ||||||
| World Multi media Ltd | Mean | 0.32 | -2.91* | |||||
| S.D | 0.00 | |||||||
| World Call Telecom Ltd | Mean | 0.05 | 0.41 | |||||
| S.D | 0.13 | |||||||
| World Call Telecom Ltd | Mean | 0.09 | ||||||
| S.D | 0.04 | |||||||
| 3. | WORLDCALL Broadcast Ltd & WORLDCALL Telecom Ltd | 2006 | ||||||
| WORLDCALL Broadcast Ltd | Mean | 0.28 | -2.43* | |||||
| S.D | 0.006 | |||||||
| WORLDCALL? Telecom Ltd | Mean | 0.05 | 0.41 | |||||
| S.D | 0.13 | |||||||
| WORLDCALL? Telecom Ltd | Mean | 0.09 | ||||||
| S.D | 0.04 | |||||||
| 4. | World Call Communication & World Call Telecom Ltd | 2006 | ||||||
| World Call Communication | Mean | 0.18 | -1.19 | |||||
| S.D | 0.06 | |||||||
| World Call Telecom Ltd | Mean | 0.05 | ?? 0.41 | |||||
| S.D | 0.13 | |||||||
| World Call Telecom Ltd | Mean | 0.09 | ||||||
| S.D | 0.04 | |||||||
| 5. | Kohinoor Generatek Ltd Kohinoor Weaving Mills Ltd |
2004 | ||||||
| Kohinoor Generatek Ltd | Mean | 0.13 | 5.56* | |||||
| S.D | 0.13 | |||||||
| Kohinoor Weaving Mills Ltd | Mean | 0.06 | -2.89* | |||||
| S.D | 0.02 | |||||||
| Kohinoor Weaving Mills Ltd | Mean | -0.01 | ||||||
| S.D | 0.03 | |||||||
| 6. | Atlas Lease & Atlas Investment Bank | 2002 | ||||||
| Atlas Lease | Mean | 0.01 | 3.34* | |||||
| S.D | 0.01 | |||||||
| Atlas investment bank(2002) | Mean | 0.02 | 2.54* | |||||
| S.D | 0.03 | |||||||
| Atlas investment bank(2002) | Mean | 0.11 | ||||||
| S.D | 0.05 | |||||||
| 7. | Atlas Investment Bank & Atlas Bank | 2004 | ||||||
| Atlas Lease | Mean | 0.11 | -3.61* | |||||
| S.D | 0.05 | |||||||
| Atlas bank | Mean | -12.48 | -1.13 | |||||
| S.D | 0.23 | |||||||
| Atlas bank Ltd | Mean | -1.34 | ||||||
| S.D | 11.12 | |||||||
| 8. | Pakistan Industrial Corporation & Trust Investment Bank | 2001 | ||||||
| Pakistan Industrial Leasing Corp. Ltd | Mean | 0.04 | -3.61* | |||||
| S.D | 0.01 | |||||||
| Trust Investment Bank Ltd | Mean | 0.14 | -1.13 | |||||
| S.D | 0.08 | |||||||
| Trust Investment Bank Ltd | Mean | 0.28 | ||||||
| S.D | 0.21 | |||||||
| 9. | Elahi Spinning & Taj Textile mills | 2000 | ||||||
| Elahi Spinning | Mean | -0.11 | -3.61* | |||||
| S.D | 0.08 | |||||||
| Taj Textile mills | Mean | 0.01 | -1.13 | |||||
| S.D | 0.00 | |||||||
| ?Taj Textile mills | Mean | -0.02 | ||||||
| S.D | 0.06 | |||||||
| 10. | Nafees Cotton Mills & Legler Nafees Denim Mills Ltd | 2004 | ||||||
| Nafees Cotton Mills Ltd | Mean | 0.04 | 5.33* | |||||
| S.D | 0.02 | |||||||
| Legler-Nafees Denim Mills Ltd | Mean | ?? 0.06 | 4.81* | |||||
| S.D | 0.02 | |||||||
| Legler-Nafees Denim Mills Ltd | Mean | 0.18 | ||||||
| S.D | 0.03 | |||||||
| 11. | KASB Company Ltd & KASB Bank Ltd | 2003 | ||||||
| KASB & Company Ltd | Mean | 2.23 | 5.33* | |||||
| S.D | 0.85 | |||||||
| KASB Bank Ltd | Mean | 13.6 | 4.81* | |||||
| S.D | 2.51 | |||||||
| KASB Bank Ltd | Mean | 11.7 | ||||||
| S.D | 0.95 | |||||||
| 12. | Dawood Cotton Mill & Dawood Lawrencepur Ltd | 2004 | ||||||
| Dawood Cotton Mill | Mean | 0.01 | 2.04* | |||||
| S.D | 0.00 | |||||||
| Dawood Lawrencepur Ltd | Mean | 0.11 | ||||||
| S.D | 0.09 | |||||||
| 13. | Lawrencepur? Woolen & Textile Mills Ltd & Dawood Lawrencepur Ltd | 2004 | ||||||
| Lawrencepur? Woolen & Textile Mills Ltd | Mean | 0.00 | 1.98* | |||||
| S.D | 0.01 | |||||||
| Dawood Lawrencepur Ltd | Mean | 0.11 | ||||||
| S.D | 0.09 | |||||||
| 14. | Burewala Textile Mill & Dawood Lawrencepur Ltd | 2004 | ||||||
| Burewala Textile Mill | Mean | 0.00 | 2.01* | |||||
| S.D | 0.00 | |||||||
| Dawood Lawrencepur Ltd | Mean | 0.11 | ||||||
| S.D | 0.09 | |||||||
| 15. | Dilon Mills Ltd & Dawood Lawrencepur Ltd | 2004 | ||||||
| Dilon Mills Ltd | Mean | 0.00 | 2.08* | |||||
| S.D | 0.01 | |||||||
| Dawood Lawrencepur Ltd | Mean | 0.11 | ||||||
| S.D | 0.09 | |||||||
| 16. | Ibrahim Textile Mill & Ibrahim Fibers | 2002 | ||||||
| Ibrahim Textile Mill | Mean | 0.02 | 2.31* | |||||
| S.D | 0.01 | |||||||
| Ibrahim Fibers | Mean | 0.11 | -2.53* | |||||
| S.D | 0.04 | |||||||
| Ibrahim Fibers | Mean | 0.06 | ||||||
| S.D | 0.02 | |||||||
| 17. | Orix investment bank & Orix lease | 2009 | ||||||
| Orix investment bank | Mean | 1.39 | -452.5* | |||||
| S.D | 0.07 | |||||||
| Orix lease | Mean | 0.03 | -1.56 | |||||
| S.D | 0.02 | |||||||
| Orix lease | Mean | 0.014 | ||||||
| S.D | 0.00 | |||||||
Significance level 1% (**), 5 %(*)
| Table 4: Results Of Paired T-Test For Return On Equity Ratio Of Sampled Vertical Mergers |
||||||
| Event No. | Company | Year | Mean/ SD |
Premerger | Post-Merger | T-Value |
|---|---|---|---|---|---|---|
| 1. | Shaheen Cotton Mills & Shehzad Textile Mills | 2004 | ||||
| Shaheen Cotton Mills | Mean | 0.22 | -2.84* | |||
| S.D | 0.07 | |||||
| Shehzad Textile Mills | Mean | 0.01 | -2.00* | |||
| S.D | 0.02 | |||||
| Shehzad Textile Mills | Mean | -0.50 | ||||
| S.D | 0.44 | |||||
| 2. | World Multi media Ltd. & World Call Telecom Ltd. | 2006 | ||||
| World Multi media Ltd. | Mean | 0.24 | -5.59* | |||
| S.D | 0.08 | |||||
| World Call Telecom Ltd. | Mean | 0.01 | 0.74 | |||
| S.D | 0.06 | |||||
| World Call Telecom Ltd. | Mean | 0.04 | ||||
| S.D | 0.01 | |||||
| 3. | WORLDCALL Broadcast Ltd. & WORLDCALL Telecom Ltd. | 2006 | ||||
| WORLDCALL Broadcast Ltd. | Mean | 0.16 | -3.35* | |||
| S.D | 0.06 | |||||
| WORLDCALL Telecom Ltd. | Mean | 0.01 | 0.74 | |||
| S.D | 0.06 | |||||
| WORLDCALL Telecom Ltd. | Mean | 0.04 | ||||
| S.D | 0.01 | |||||
| 4. | World Call Communication & World Call Telecom Ltd. | 2006 | ||||
| World Call Communication | Mean | 0.18 | -4.10* | |||
| S.D | 0.08 | |||||
| World Call Telecom Ltd. | Mean | 0.01 | 0.74 | |||
| S.D | 0.06 | |||||
| World Call Telecom Ltd. | Mean | 0.04 | ||||
| S.D | 0.01 | |||||
| 5. | Kohinoor Generetek Ltd. & Kohinoor weaving Mill Ltd. | 2004 | ||||
| Kohinoor Generatek Ltd. | Mean | 0.05 | -1.53 | |||
| S.D | 0.01 | |||||
| Kohinoor Weaving Mills Ltd. | Mean | 0.19 | -5.35* | |||
| S.D | 0.00 | |||||
| Kohinoor Weaving Mills Ltd. | Mean | -0.00 | ||||
| S.D | 0.01 | |||||
| 6. | Atlas Lease & Atlas Investment Bank | 2002 | ||||
| Atlas Lease | Mean | 0.08 | 8.19* | |||
| S.D | 0.02 | |||||
| Atlas investment bank | Mean | 0.12 | 6.94* | |||
| S.D | 0.01 | |||||
| Atlas investment bank | Mean | 0.36 | ||||
| S.D | 0.05 | |||||
| 7. | Atlas investment bank & Atlas bank Ltd. | 2004 | ||||
| Atlas investment bank | Mean | 0.13 | 3.88* | |||
| S.D | 0.06 | |||||
| Atlas bank Ltd. | Mean | -0.01 | 7.81* | |||
| S.D | 0.03 | |||||
| Atlas bank Ltd. | Mean | 0.29 | ||||
| S.D | 0.05 | |||||
| 8. | Pakistan Industrial Leasing Corp. Ltd. & Trust Investment Bank Ltd. | 2001 | ||||
| Pakistan Industrial Leasing Corp. Ltd. | Mean | 0.04 | 3.22* | |||
| S.D | 0.01 | |||||
| Trust Investment Bank Ltd. | Mean | 0.06 | 3.03* | |||
| S.D | 0.01 | |||||
| Trust Investment Bank Ltd. | Mean | 0.33 | ||||
| S.D | 0.15 | |||||
| 9. | Elahi Spinning & Taj Textile Mills | 2000 | ||||
| Elahi Spinning | Mean | -0.18 | 2.31* | |||
| S.D | 0.38 | |||||
| Taj Textile mills | Mean | 0.05 | 1.56 | |||
| S.D | 0.03 | |||||
| Taj Textile mills | Mean | 0.54 | ||||
| S.D | 0.29 | |||||
| 10. | Nafees Cotton Mills Ltd. & Legler-Nafees Denim Mills Ltd. | 2003 | ||||
| Nafees Cotton Mills Ltd. | Mean | 0.05 | 2.64* | |||
| S.D | 0.01 | |||||
| Legler-Nafees Denim Mills Ltd. | Mean | 0.13 | 0.46 | |||
| S.D | 0.01 | |||||
| Legler-Nafees Denim Mills Ltd. | Mean | 0.15 | ||||
| S.D | 0.06 | |||||
| 11. | KASB Company Ltd. & KASB Bank Ltd | 2003 | ||||
| KASB & Company Ltd. | Mean | 0.19 | 5.88* | |||
| S.D | 0.05 | |||||
| KASB Bank Ltd. | Mean | 7.24 | -2.24* | |||
| S.D | 2.64 | |||||
| KASB Bank Ltd. | Mean | 3.57 | ||||
| S.D | 0.99 | |||||
| 12. | Dawood Cotton Mill &Dawood Lawrencepur Ltd. | 2004 | ||||
| Dawood Cotton Mill | Mean | 0.10 | 12.9* | |||
| S.D | 0.02 | |||||
| Dawood Lawrencepur Ltd. | Mean | 0.80 | ||||
| S.D | 0.10 | |||||
| 13 | Lawrencepur Woolen & Textile Mills Ltd. | 2004 | ||||
| Dawood Lawrencepur Ltd. | Mean | 0.11 | 10.9* | |||
| S.D | 0.04 | |||||
| Dawood Lawrencepur Ltd. | Mean | 0.80 | ||||
| S.D | 0.10 | |||||
| 14. | Burewala Textile Mill & Dawood Lawrencepur Ltd. | |||||
| Burewala Textile Mill | Mean | 0.13 | 6.62* | |||
| S.D | 0.04 | |||||
| Dawood Lawrencepur Ltd. | Mean | 0.80 | ||||
| S.D | 0.10 | |||||
| 15. | Dilon Mills Ltd & Dawood Lawrencepur Ltd | 2004 | ||||
| Dilon Mills Ltd. | Mean | 0.18 | 10.2* | |||
| S.D | 0.16 | |||||
| Dawood Lawrencepur Ltd. | Mean | 0.80 | ||||
| S.D | 0.10 | |||||
| 16. | Ibrahim Textile Mill & Ibrahim Fibers (2002) | 2002 | ||||
| Ibrahim Textile Mill | Mean | 0.16 | 4.27* | |||
| S.D | 0.05 | |||||
| Ibrahim Fibers | Mean | 0.14 | 2.69* | |||
| S.D | 0.04 | |||||
| Ibrahim Fibers | Mean | 0.52 | ||||
| S.D | 0.13 | |||||
| 17. | Orix investment bank & Orix lease 2009 | 2009 | ||||
| Orix investment bank | Mean | 0.17 | -10.72* | |||
| S.D | 0.06 | |||||
| Orix lease | Mean | 0.08 | -0.31 | |||
| S.D | 0.07 | |||||
| Orix lease | Mean | 0.06 | ||||
| S.D | 0.01 | |||||
| Table 5: Results Of Paired T-Test For Operating Expense Ratio Of Sampled Vertical Mergers |
||||||
| Event No. | Company | Year | Mean/ SD |
Premerger | Post-Merger | T-Value |
|---|---|---|---|---|---|---|
| 1. | Shaheen Cotton Mills & Shehzad Textile Mills | 2004 | ||||
| Shaheen Cotton Mills | Mean | 0.15 | 3.46* | |||
| S.D | 0.09 | |||||
| Shehzad Textile Mills | Mean | 0.00 | 5.32* | |||
| S.D | 0.00 | |||||
| Shehzad Textile Mills | Mean | 0.42 | ||||
| S.D | 0.13 | |||||
| 2. | World Multi media Ltd. & World Call Telecom Ltd. | 2006 | ||||
| World Multi media Ltd. | Mean | -0.39 | 8.55* | |||
| S.D | 0.00 | |||||
| World Call Telecom Ltd. | Mean | -0.17 | 5.0* | |||
| S.D | 0.06 | |||||
| World Call Telecom Ltd. | Mean | 0.14 | ||||
| S.D | 0.08 | |||||
| 3. | WORLDCALL Broadcast Ltd. & WORLDCALL Telecom Ltd. | 2006 | ||||
| WORLDCALL Broadcast Ltd. | Mean | -0.36 | 8.05* | |||
| S.D | 0.05 | |||||
| WORLDCALL Telecom Ltd. | Mean | -0.17 | 5.0* | |||
| S.D | 0.06 | |||||
| WORLDCALL Telecom Ltd. | Mean | 0.14 | ||||
| S.D | 0.08 | |||||
| 4. | World Call Communication & World Call Telecom Ltd. | 2006 | ||||
| WORLD CALL Communication | Mean | -0.33 | 7.52* | |||
| S.D | 0.11 | |||||
| WORLD CALL Telecom Ltd. | Mean | -0.17 | 5.0* | |||
| S.D | 0.06 | |||||
| WORLD CALL Telecom Ltd. | Mean | 0.14 | ||||
| S.D | 0.08 | |||||
| 5. | Kohinoor Generatek Ltd. & Kohinoor Weaving Mills Ltd. | 2004 | ||||
| Kohinoor Generatek Ltd.. | Mean | 0.01 | 0.20 | |||
| S.D | 0.00 | |||||
| Kohinoor Weaving Mills Ltd. | Mean | 0.85 | -4.66* | |||
| S.D | 0.29 | |||||
| Kohinoor Weaving Mills Ltd. | Mean | 0.05 | ||||
| S.D | 0.02 | |||||
| 6. | Atlas Lease & Atlas investment bank | 2002 | ||||
| Company A: Atlas Lease | Mean | 0.94 | -130.3* | |||
| S.D | 0.04 | |||||
| Atlas investment bank | Mean | 0.17 | 2.82* | |||
| S.D | 0.01 | |||||
| Atlas investment bank | Mean | 0.18 | ||||
| S.D | 0.00 | |||||
| 7. | Atlas investment bank & Atlas bank Ltd. | 2004 | ||||
| Atlas Investment Bank | Mean | 0.18 | 4.27* | |||
| S.D | 0.00 | |||||
| Atlas bank Ltd. | Mean | 0.36 | 2.98* | |||
| S.D | 0.25 | |||||
| Atlas bank Ltd. | Mean | 0.80 | ||||
| S.D | 0.26 | |||||
| 8. | Pakistan Industrial Leasing Corp. Ltd. | 2001 | ||||
| Pakistan Industrial Leasing Corp. Ltd. | Mean | 0.79 | -2.18* | |||
| S.D | 0.01 | |||||
| Trust Investment Bank Ltd. | Mean | -0.29 | 5.59* | |||
| S.D | 0.20 | |||||
| Trust Investment Bank Ltd. | Mean | 0.49 | ||||
| S.D | 0.13 | |||||
| 9. | Elahi Spinning & Taj Textile mills | 2000 | ||||
| Elahi Spinning | Mean | 0.24 | 23.3* | |||
| S.D | 0.04 | |||||
| Taj Textile mills | Mean | 0.04 | 2.00* | |||
| S.D | 0.01 | |||||
| Taj Textile mills | Mean | 0.05 | ||||
| S.D | 0.009 | |||||
| 10. | Nafees Cotton Mills Ltd. & Legler-Nafees Denim Mill | 2004 | ||||
| Nafees Cotton Mills Ltd. | Mean | 0.02 | 5.05* | |||
| S.D | 0.01 | |||||
| Legler-Nafees Denim Mills Ltd. | Mean | 2.68 | -0.92 | |||
| S.D | 1.90 | |||||
| Legler-Nafees Denim Mills Ltd. | Mean | 0.46 | ||||
| S.D | 0.15 | |||||
| 11. | KASB Company Ltd. & KASB Bank Ltd. | 2003 | ||||
| KASB & Company Ltd. | Mean | 2.06 | -0.87 | |||
| S.D | 3.17 | |||||
| KASB Bank Ltd. | Mean | 0.39 | 0.89 | |||
| S.D | 0.11 | |||||
| KASB Bank Ltd. | Mean | 0.46 | ||||
| S.D | 0.07 | |||||
| 12. | Dawood Cotton Mill &Dawood Lawrencepur Ltd. | 2004 | ||||
| Dawood Cotton Mill | Mean | -0.02 | 145.0* | |||
| S.D | 0.00 | |||||
| Dawood Lawrencepur Ltd. | Mean | 0.38 | ||||
| S.D | 0.00 | |||||
| 13. | Lawrencepur Woolen & Textile Mills Ltd. and Dawood Lawrencepur Ltd. | 2004 | ||||
| Lawrencepur Woolen & Textile Mills Ltd. | Mean | 0.09 | 75.09* | |||
| S.D | 0.00 | |||||
| Dawood Lawrencepur Ltd. | Mean | 0.38 | ||||
| S.D | 0.00 | |||||
| 14. | Burewala Textile Mill & Dawood Lawrencepur Ltd | 2004 | ||||
| Burewala Textile Mill | Mean | 0.29 | 0.66 | |||
| S.D | 0.35 | |||||
| Dawood Lawrencepur Ltd. | Mean | 0.38 | ||||
| S.D | 0.00 | |||||
| 15. | Dilon Mills Ltd. & Dawood Lawrencepur Ltd. | 2004 | ||||
| Dilon Mills Ltd. | Mean | 0.04 | 52.0* | |||
| S.D | 0.01 | |||||
| Dawood Lawrencepur Ltd. | Mean | 0.386 | ||||
| S.D | 0.00 | |||||
| 16. | Ibrahim Textile Mill & Ibrahim Fibers | 2002 | ||||
| Ibrahim Textile Mill | Mean | 0.04 | 1.60 | |||
| S.D | 0.00 | |||||
| Ibrahim Fibers | Mean | 0.03 | 1.53 | |||
| S.D | 0.02 | |||||
| Ibrahim Fibers | Mean | 0.90 | ||||
| S.D | 0.92 | |||||
| 17. | Orix investment bank & Orix lease | 2009 | ||||
| Orix investment bank | Mean | 0.13 | -361* | |||
| S.D | 0.01 | |||||
| Orix lease | Mean | 0.011 | 0.50 | |||
| S.D | 0.00 | |||||
| Orix lease | Mean | 0.011 | ||||
| S.D | 0.00 | |||||
Significance level 1% (**), 5%
| Table 6: Paired T-Test For Interest Coverage Ratio Of Sampled Vertical Mergers |
||||||
| Event No. | Company | Year | Mean/ SD |
Premerger | Post-Merger | T-Value |
|---|---|---|---|---|---|---|
| 1. | Shaheen Cotton Mills & Shehzad Textile Mills | 2008 | ||||
| Shaheen Cotton Mills | Mean | 8.17 | -16.1* | |||
| S.D | 1.74 | |||||
| Shehzad Textile Mills | Mean | 0.06 | -1.76 | |||
| S.D | 0.00 | |||||
| Shehzad Textile Mills | Mean | -0.93 | ||||
| S.D | 0.97 | |||||
| 2. | World Multi media Ltd. & World Call Telecom Ltd. | 2006 | ||||
| World Multi media Ltd. | Mean | -0.96 | 2.77* | |||
| S.D | 0.10 | |||||
| World Call Telecom Ltd. | Mean | -0.06 | 1.67 | |||
| S.D | 0.88 | |||||
| World Call Telecom Ltd. | Mean | 1.29 | ||||
| S.D | 1.09 | |||||
| 3. | WORLDCALL Broadcast & WORLDCALL Telecom Ltd. | 2006 | ||||
| WORLDCALL Broadcast Ltd. | Mean | -1.27 | 3.15* | |||
| S.D | 0.73 | |||||
| WORLDCALL Telecom Ltd. | Mean | -0.06 | 1.67 | |||
| S.D | 0.88 | |||||
| WORLDCALL Telecom Ltd. | Mean | 1.29 | ||||
| S.D | 1.09 | |||||
| 4. | World Call Communication & World Call Telecom Ltd. | 2006 | ||||
| World Call Communication | Mean | -1.25 | 3.13* | |||
| S.D | 0.94 | |||||
| World Call Telecom Ltd. | Mean | -0.06 | 1.67 | |||
| S.D | 0.88 | |||||
| World Call Telecom Ltd. | Mean | 1.29 | ||||
| S.D | 1.09 | |||||
| 5. | Kohinoor Generetek Ltd. & Kohinoor Weaving Mills | 2004 | ||||
| Kohinoor Generatek Ltd. | Mean | 3.10 | -4.26* | |||
| S.D | 1.31 | |||||
| Kohinoor Weaving Mills Ltd. | Mean | 6.50 | -8.26* | |||
| S.D | 0.78 | |||||
| Kohinoor Weaving Mills Ltd. | Mean | -0.53 | ||||
| S.D | 1.25 | |||||
| 6. | Atlas Lease & Atlas investment bank | 2002 | ||||
| Atlas Lease | Mean | 0.04 | 13.2* | |||
| S.D | 0.05 | |||||
| Atlas investment bank | Mean | 0.02 | -1.51 | |||
| S.D | 0.90 | |||||
| Atlas investment bank | Mean | 0.81 | ||||
| S.D | 0.09 | |||||
| 7. | Atlas investment bank &Atlas bank Ltd. | 2004 | ||||
| Atlas investment bank | Mean | 0.83 | 27.61* | |||
| S.D | 0.10 | |||||
| Atlas bank Ltd. | Mean | 0.76 | 28.15* | |||
| S.D | 0.20 | |||||
| Atlas bank Ltd. | Mean | 4.44 | ||||
| S.D | 7.44 | |||||
| 8. | Pakistan Industrial Leasing Corp. Ltd. & Trust Investment Bank Ltd. | 2001 | ||||
| Pakistan Industrial Leasing Corp. Ltd. | Mean | 0.24 | 3.25* | |||
| S.D | 0.00 | |||||
| Trust Investment Bank Ltd. | Mean | -0.45 | 5.89* | |||
| S.D | 0.07 | |||||
| Trust Investment Bank Ltd. | Mean | 1.10 | ||||
| S.D | 0.45 | |||||
| 9. | Elahi Spinning & Taj Textile Mills | 2000 | ||||
| Elahi Spinning | Mean | 0.27 | 3.30* | |||
| S.D | -0.63 | |||||
| Taj Textile mills | Mean | 0.13 | 1.66 | |||
| S.D | 0.40 | |||||
| Taj Textile mills | Mean | 1.45 | ||||
| S.D | 1.08 | |||||
| 10. | Nafees Cotton Mills Ltd. & Legler-Nafees Denim Mills | 2004 | ||||
| Nafees Cotton Mills Ltd. | Mean | 2.76 | 0.27 | |||
| S.D | 0.73 | |||||
| Legler-Nafees Denim Mills Ltd. | Mean | 1.90 | 1.81 | |||
| S.D | 0.46 | |||||
| Legler-Nafees Denim Mills Ltd. | Mean | 2.95 | ||||
| S.D | 0.88 | |||||
| 11. | KASB Company Ltd. & KASB Bank Ltd. | 2003 | ||||
| KASB Company Ltd. | Mean | 8.20 | 0.92 | |||
| S.D | 2.11 | |||||
| KASB Bank Ltd. | Mean | 122.4 | -2.83* | |||
| S.D | 67.18 | |||||
| KASB Bank Ltd. | Mean | 12.03 | ||||
| S.D | 6.82 | |||||
| 12. | Dawood Cotton Mill &Dawood Lawrencepur Ltd. | 2004 | ||||
| Dawood Cotton Mill | Mean | 0.82 | 2.87* | |||
| S.D | 0.27 | |||||
| Dawood Lawrencepur Ltd. | Mean | 0.74 | ||||
| S.D | 0.06 | |||||
| 13. | Lawrencepur Woolen & Textile Mills Ltd. & Dawood Lawrencepur Ltd. | 2004 | ||||
| Lawrencepur Woolen & Textile Mills Ltd. | Mean | 0.52 | 1.09 | |||
| S.D | 0.34 | |||||
| Dawood Lawrencepur Ltd. | Mean | 0.74 | ||||
| S.D | 0.06 | |||||
| 14. | Burewala Textile Mill & Dawood Lawrencepur Ltd. | 2004 | ||||
| Burewala Textile Mill | Mean | 1.32 | -13.07* | |||
| S.D | 0.62 | |||||
| Dawood Lawrencepur Ltd. | Mean | 0.74 | ||||
| S.D | 0.06 | |||||
| 15. | Dilon Mills Ltd. & Dawood Lawrencepur Ltd. | 2004 | ||||
| Dilon Mills Ltd. | Mean | 0.14 | 14.45* | |||
| S.D | 0.03 | |||||
| Dawood Lawrencepur Ltd. | Mean | 0.74 | ||||
| S.D | 0.06 | |||||
| 16. | Ibrahim Textile Mill & Ibrahim Fibers | 2002 | ||||
| Ibrahim Textile Mill | Mean | 1.12 | 2.36* | |||
| S.D | 0.52 | |||||
| Ibrahim Fibers | Mean | 5.41 | -1.19 | |||
| S.D | 7.36 | |||||
| Ibrahim Fibers | Mean | 1.44 | ||||
| S.D | 0.23 | |||||
| 17. | Orix investment bank & Orix lease | 2009 | ||||
| Orix investment bank | Mean | 1.39 | -39.4* | |||
| S.D | 1.19 | |||||
| Orix lease | Mean | 0.40 | 2.05* | |||
| S.D | 0.10 | |||||
| Orix lease | Mean | 0.52 | ||||
| S.D | 0.03 | |||||
Significance level 1% (**), 5% (*)
| Table 7: Paired T-Test For Debt To Equity Ratio Of Sampled Vertical Mergers |
||||||
| Event No. | Company | Year | Mean/ SD |
Premerger | Post-Merger | T-Value |
| 1. | Shaheen Cotton Mills & Shehzad Textile Mills | 2004 | ||||
| Shaheen Cotton Mills | Mean | 0.05 | -11.4* | |||
| S.D | 0.03 | |||||
| Shehzad Textile Mills | Mean | 0.01 | -3.11* | |||
| S.D | 0.00 | |||||
| Shehzad Textile Mills | Mean | 0.004 | ||||
| S.D | 0.005 | |||||
| 2. | World Multi media Ltd. & World Call Telecom Ltd. | 2006 | ||||
| World Multi media Ltd. | Mean | 0.21 | 0.49 | |||
| S.D | 0.00 | |||||
| World Call Telecom Ltd. | Mean | 0.53 | -0.40 | |||
| S.D | 0.58 | |||||
| World Call Telecom Ltd. | Mean | 0.39 | ||||
| S.D | 0.17 | |||||
| 3. | WORLDCALL Broadcast & WORLDCALL Telecom Ltd. | 2006 | ||||
| WORLDCALL Broadcast Ltd. | Mean | 0.60 | -0.60 | |||
| S.D | 0.08 | |||||
| WORLDCALL Telecom Ltd. | Mean | 0.58 | -0.40 | |||
| S.D | 0.53 | |||||
| WORLDCALL Telecom Ltd. | Mean | 0.39 | ||||
| S.D | 0.17 | |||||
| 4. | WORLD CALL Comm & World Call Telecom Ltd. | 2006 | ||||
| World Call Communication | Mean | 0.60 | -0.60 | |||
| S.D | 0.08 | |||||
| World Call Telecom Ltd. | Mean | 0.53 | -0.40 | |||
| S.D | 0.58 | |||||
| World Call Telecom Ltd. | Mean | 0.39 | ||||
| S.D | 0.17 | |||||
| 5. | Kohinoor Generatek Ltd. & Kohinoor Weaving Mills Ltd. | 2004 | ||||
| Kohinoor Generatek Ltd. | Mean | 0.08 | 8.83* | |||
| S.D | 0.06 | |||||
| Kohinoor Weaving Mills Ltd. | Mean | 2.06 | 2.87* | |||
| S.D | 0.16 | |||||
| Kohinoor Weaving Mills Ltd. | Mean | 3.02 | ||||
| S.D | 0.55 | |||||
| 6. | Atlas Lease & Atlas investment bank | 2002 | ||||
| Atlas Lease | Mean | 7.49 | -466.3* | |||
| S.D | 1.57 | |||||
| Atlas investment bank | Mean | 0.06 | -2.35* | |||
| S.D | 0.00 | |||||
| Atlas investment bank | Mean | 0.03 | ||||
| S.D | 0.02 | |||||
| 7. | Atlas investment bank & Atlas bank Ltd. | 2004 | ||||
| Atlas investment bank | Mean | 0.06 | -249.3* | |||
| S.D | 0.00 | |||||
| Atlas bank Ltd. | Mean | 0.04 | -254.9* | |||
| S.D | 0.03 | |||||
| Atlas bank Ltd. | Mean | -5.49 | ||||
| S.D | 11.12 | |||||
| 8. | Pakistan Industrial Leasing Corp. Ltd. &Trust Investment Bank Ltd. | 2001 | ||||
| Pakistan Industrial Leasing Corp. Ltd. | Mean | 6.05 | -79.98* | |||
| S.D | 0.19 | |||||
| Trust Investment Bank Ltd. | Mean | 2.34 | -28.36* | |||
| S.D | 0.12 | |||||
| Trust Investment Bank Ltd. | Mean | 0.30 | ||||
| S.D | 0.21 | |||||
| 9. | Elahi Spinning & Taj Textile mills | 2000 | ||||
| Elahi Spinning | Mean | 0.28 | 0.52 | |||
| S.D | 0.03 | |||||
| Taj Textile mills | Mean | 2.77 | -4.34* | |||
| S.D | 0.91 | |||||
| Taj Textile mills | Mean | -0.05 | ||||
| S.D | 0.06 | |||||
| 10. | Nafees Cotton Mills Ltd. & Legler-Nafees Denim Mills Ltd. | 2003 | ||||
| Nafees Cotton Mills Ltd. | Mean | 0.16 | 5.37* | |||
| S.D | 0.01 | |||||
| Legler-Nafees Denim Mills Ltd. | Mean | 8.96 | -1.24* | |||
| S.D | 3.85 | |||||
| Legler-Nafees Denim Mills Ltd. | Mean | 17.3 | ||||
| S.D | 0.50 | |||||
| 11. | KASB Company Ltd. & KASB Bank Ltd. | 2003 | ||||
| KASB & Company Ltd. | Mean | 0.03 | 7.04* | |||
| S.D | 0.01 | |||||
| KASB Bank Ltd. | Mean | 4.97 | 2.88* | |||
| S.D | 4.94 | |||||
| KASB Bank Ltd. | Mean | 15.3 | ||||
| S.D | 0.95 | |||||
| 12. | Dawood Cotton Mill &Dawood Lawrencepur Ltd. | 2004 | ||||
| Dawood Cotton Mill | Mean | 0.38 | 0.98 | |||
| S.D | 0.25 | |||||
| Dawood Lawrencepur Ltd. | Mean | 0.40 | ||||
| S.D | 0.02 | |||||
| 13. | Lawrencepur Woolen Textile Mill & Dawood Lawrencepur | 2004 | ||||
| Lawrencepur Woolen & Textile Mills Ltd. | Mean | 0.52 | -2.85* | |||
| S.D | 0.07 | |||||
| Dawood Lawrencepur Ltd. | Mean | 0.40 0.02 |
||||
| S.D | ||||||
| 15. | Dilon Mills Ltd. & Dawood Lawrencepur Ltd. | 2004 | ||||
| Dilon Mills Ltd. | Mean | 0.35 | 0.28 | |||
| S.D | 0.28 | |||||
| Dawood Lawrencepur Ltd. | Mean | 0.40 | ||||
| S.D | 0.02 | |||||
| 16. | Ibrahim Textile Mill & Ibrahim Fibers | 2002 | ||||
| Ibrahim Textile Mill | Mean | 2.42 | -12.65* | |||
| S.D | 0.84 | |||||
| Ibrahim Fibers | Mean | 0.65 | -9.77* | |||
| S.D | 0.35 | |||||
| Ibrahim Fibers | Mean | 0.68 | ||||
| S.D | 0.23 | |||||
| 17. | Orix investment bank & Orix lease | 2009 | ||||
| Orix investment bank | Mean | 0.06 | 0.19 | |||
| S.D | 0.00 | |||||
| Orix lease | Mean | 0.07 | -1.58 | |||
| S.D | 0.00 | |||||
| Orix lease | Mean | 0.06 | ||||
| S.D | 0.00 | |||||
Significance level 1% (**), 5% (*).
References
- David, F.R. (2000). Strategic management: Concept and cases (13 Ed), New York, David Publisher: Prentice Hall.
- Coontz, G. (2004). Economic impact of corporate mergers and acquisitions on acquiring firm shareholder wealth. The Park Place Economist, 12 (1).
- Stalstedt, E., Eriksson, J. (2006). Mergers & Acquisitions: Abnormal returns in the Pharmaceutical industry. Jönköping International Business School, UMI N/A.
- Roberts, A., Wallace, W. & Moles, P. (2012). Mergers and acquisitions, United Kingdom, Edinburg Business School. Retrieved on 10 January from https://www.ebsglobal.net/documents/course-tasters/english/pdf/h17mq-bk-taster.pdf.
- Fan, J.P.H. & Goyal, V.K. (2006). On the patterns and wealth effects of vertical mergers. Journal of Business, 79(2), 877-902.
- Teerce, J.D., Armour, O.H. & Saloner, J. (1981).Vertical mergers and risk and return. Research No. 563 REV.ED. Retrieved from https://gsbapps.stanford.edu/researchpapers/library/RP563.pdf.
- Frederikslust, I.A.R., Van der Wal. & Westdijk, H. (2017). Shareholder wealth effects of mergers and acquisitions. Unpublished paper, Rotterdam School of Management, Netherland.
- Selcuk, E.A. & Kiymaz, H. (2013). The impact of diversifying acquisitions on shareholders wealth. Retrieved from http://www.aabri.com/NO2013Manuscripts/NO13074.pdf.
- Selcuk, E.A. & Yilmaz, A.A. (2011). The impact of mergers and acquisitions on acquirer performance: Evidence from Turkey. Business and Economics Journal, 2011(BEJ-22).
- Siegenthaler, P.J. (2011). What role for HR during mergers and acquisitions? Human Resource Management International Digest, 19(1),4-6.
- Kemal, M.U. (2011). Post-merger profitability: A case of Royal Bank of Scotland (RBS). International Journal of Business and Social Science, 2(5), 157.
- Arshad, A. (2012).Post merger performance analysis of standard chartered bank Pakistan. Interdisciplinary Journal of Contemporary Research in Business, 4(6).
- Bashir, A., Sajid, M.R. & Sheikh, S.F. (2011). The impact of mergers and acquisitions on shareholders wealth: evidence from Pakistan. Middle-East Journal of Scientific Research, 8 (1).
- Agrawal, A., Jaffe, F.J. & Mandelker, G.N. (1982).The post-merger performance of acquiring firms: A re-examination of an anomaly. Journal of Finance, XLVII(4).
- Loughran, T. Vijh, M.A. (1997). Do long-term shareholders benefit from corporate acquisitions? The Journal of Finance, 52(5), 1765-1790.
- Usman, A., Khan, K.M., Wajid, A. & Malik, I.M. (2011). Investigating the operating performance of merged companies in textile sector of Pakistan. Asian Journal of Business and Management Sciences, 1(10), 11-16.
- Meador, A.L., Church, P.H. & Rayburn, L.G. (1996). Development of prediction models for horizontal and vertical mergers. Journal of Financial and Strategic Decision, 9(1).
- Mishra, S., Prakash, A.J., Karels, G.V. & Peterson. (2005). Bank mergers and components of risk: An evaluation. Journal of Economics and Finance, 29(1), 85-96.
- Natarajan, P. & Kalaichelvan. (2011).Stock price reaction of the merged banks - An event study approach. International Journal of Research in Commerce & Management, 2(4).
- Dewan, A. (2007). Effect of mergers and acquisitions on operating performance: A study of acquiring firms in India-(Mergers, n.d). http://www.wbiconpro.com/302-%20Astha.pdf.
- Menapara, M. & Pithadia, V. (2013). A study on financial performance of selected companies during pre-post-merger and acquisition. Abhinav, 1(11), 192-198.
- Liargovas, P. & Repousis, S. (2011). The impact of mergers and acquisitions on the performance of the Greek banking sector: An event study approach. International Journal of Economics and Finance, 3(2), 89-100.
- Bettis, R.A. & Hal, W.K. (1982). Diversification strategy, accounting determined risk and accounting determined return. Academy of Management Journal, 25(2),254-264.
- Afzal, T. & Yusuf, M.U. (2012). The impact of mergers on efficiency of banks in Pakistan. Elixir Fin Mgmt, 48(2012), 9158-9163.
- Kouser, R. & Saba, I. (2011). Effects of business combination on financial performance: Evidence from Pakistan’s banking sector. Australian Journal of Business and Management Research, 1(8), 54-64.
- Rehman, M.U., Naseer, A., Khan, M. & Rehman, S.U. (2011). Do bank mergers lead to efficiency gains? The case study of bank mergers in Pakistan (working paper). Retrieved from http://saicon2011.ciitlahore.edu.pk/11-1003%20mushtaq%20ur%20rehman.pdf.
- Sudarsanam, P.S. (1995). The essence of merger and acquisitions. Great Britain: Prentice Hall.
- Ramaswamy, K. (1997). The performance impact of strategic similarity in horizontal mergers: Evidence from the U.S. banking industry. Academy of Management Journal, 40(3).
- Richard, S. (1973). A note on the theory of vertical integration. Journal of Political Economy, 442-449.
- Boulton, W. & Frederick, R. (1974). Vertical control with variable proportions. Journal of Political Economy, 783-802.
- Fred, M.W. (1981). Vertical integration: Does product price rise or fall? American Economic Review, 334-346.
- Martin, K.P. & Groff, R.H. (1983). Forward Integration by a monopolist into a monopolistically competitive industry, Mimeo.
- John M.V. & Graham, D.A. (1971). Profitability of monopolization by vertical integration. Journal of Political Economy, 924-925.
- Salinger, M.A. (1998). Vertical mergers and market foreclosure. The Quarterly Journal of Economics, 103(2), 345-356.