Research Article: 2017 Vol: 21 Issue: 2
Dynamics of Volatility Spillover Between The Indian Stock Market and Foreign Exchange Market Return
Pradip Kumar Mitra, Ves Institute of Management Studies and Research
Keyword
Stock Market, Financial Crisis, Foreign Exchange Return
Introduction
This paper tries to find the volatility spillovers of foreign exchange return and stock market return. In common parlance of economic theories changes in exchange rate may influence a firm?s international competitiveness as it will have a direct effect on the increase and decrease of its operating cash flows and will also create an economic exposure in the firm?s overall valuation process by changing the value of its assets and liabilities (Dombusch and Fischer,1980). The portfolio adjustment process states that the inflow and outflow of foreign capital will be induced by the changes in stock price. Further any depreciation or appreciation in home currency will affect the international trades negatively or positively leading to a bear or bull market (Jorion, 1991). Pricing of securities is influenced by inter-market volatility, so understanding the relationship between these markets becomes an important tool for formulating the regulatory policies for a developing country like India that has paved its way towards the integration with global economy. Huge capital flows from foreign countries and internationalization of stock markets have changed the dynamics of Indian capital market making it more interdependent with the foreign exchange market. A series of currency crisis coupled with the prevalence of floating exchange rate mechanism in the emerging markets have allured the practitioners to understand the volatility spillover between these two markets and explain the effect of exchange rate changes on stock market return with the understanding that changes in exchange rate may affect the corporate earnings (Kim 2003).This will bring an insight how the integration process will have the contagion effect of these two markets (Zubair,2013). In that case the knowledge of the volatility spillover between these two financial markets will create a roadmap for better understanding the possible integration of these markets and generating a new set of information to guide the domestic investors, policy makers and multinational corporations for competent decision making.
The interdependence of return and volatility of these two financial markets has been suggested by many researchers but mostly concentrated on developed markets. However in India, Apte in 2001 studied the volatility spillover between these two markets and found that there is a spillover from the foreign exchange market to the stock market and it is unidirectional which means the reverse is not true. Mishra et al in 2007 studied the volatility spillover between stock and foreign exchange markets and they found bidirectional volatility spillover between the Indian stock market with the exception of S&P CNX Nifty and S&P CNX 500. They also found that both the markets have a long term relationship and they move in tandem. In both the cases the study was based on US dollar and stock index of BSE (Bombay Stock Exchange) and NSE (National Stock Exchange). Some other important currencies like GBP (Great Britain Pound), Euro and Japanese Yen was not taken into account for research.
This research differentiates with the fact that the data period is chosen post structural break in the economy (Post subprime crisis) and daily data were collected for four major currencies (USD, Euro, GBP and Yen) being traded in India prominently in NCDEX. Two major indices are selected SENSEX and CNX Nifty having 30 stocks and 51 stocks respectively as their constituents. The objective of the research is to find whether the scenario in volatility spillover has been changed post structural break in the economy and how the relationship is established for all the four major currencies traded in India.
Literature Review
Interdependency between stock and foreign exchange market in recent times has been augmented and further fuelled the volatility transmission between these two markets enhancing the international portfolio risk (Kanas, 2000). Knowledge of how transmission of shocks are percolated across financial markets and understanding their effects may lead to success in policy making and its implementations (Ebrahim, 2000). Sabri in (2004) shows that the volume in the stock trading is having a positive correlation with the currency rate movements in emerging markets (Sabri, 2004). Many researchers have been studying the spillover of information between these two markets and most of the studies were directed to understand the transmission of volatility between foreign exchange market and stock market (Jebran & Iqbal, 2016). In their work Bodart and Reding (2001) examined that exchange rate volatility has strong influence on expected stock return and their volatility but the magnitude of the effect is not very significant in nature (Bodart & Reding, 2001). Aloui (2007) studied the currency market and US equity market with 5 major countries from Europe using E-GARCH model and found that there is bidirectional volatility spillover between currency and equity market (Aloui, 2007). Mishra et al (2007) examined the volatility spillover on Indian Stock Market and foreign exchange market using GARCH & E-GARCH framework and found that there is bidirectional volatility spillover between these markets and both the market moves in tandem (Mishra, Swain, & Malhotra, 2007). Beer and Hebein (2011) studied the G8 countries with South Korea, Hong Kong, India and Philippines and found unidirectional volatility shock flow from currency market to equity market for Japan, India, Korea, US and Canada. Kang and Yoon (2013) examined the volatility spillover effect on Korean stock market and exchange rate market and found unidirectional volatility flowing from exchange rate market to stock market. Further Chkili and Nguyen (2014) studied the volatility spillover effect between stock market and foreign exchange market in BRICS countries (Brazil, Russia, India, China and South Africa) using regime switching model and found unidirectional flow from stock prices to exchange rate Jerban and Iqbal (2016) studied on emerging markets with the help of E-GARCH framework and found that there is bidirectional asymmetric volatility spillover between stock market and foreign exchange market Pakistan, China and Srilanka and unidirectional volatility transmission from stock market to foreign exchange market of India. But there are some exceptions to the above discussed literature. Some of the studies have also reported that there is no evidence of volatility spillover between stock market and foreign exchange market (Apergis and Rezitis 2001; Kearney and Daly 1998; Morales 2008).
Volatility of stock market has been researched by many authors with reference to ARCH-GARCH framework (Engle, 1982) and subsequently the same framework was further nurtured by (Bollerslev, 1986) & (Nelson, 1991). In their paper King and Wadhwani (1990) argued that a contagion effect is there across markets as markets may over react in certain events of another market without taking the effect of economic values associated with it. While working on New Zealand stock market Choi et al in 2010 found that when exchange rate volatility increases the stock market volatility reduces. But after the 1997 stock market crash the volatility spillover became positive significantly. Fang and Miller in 2002 investigated the impact of currency depreciation on Korean stock market return during the financial turmoil in Korea for a period 1997 to 2000. From the study a bi-directional causality was found between Korean foreign exchange market and the Korean stock market. Exchange rate volatility was also found affecting positively the stock market return and volatility of stock market return also responded positively to exchange rate depreciation volatility. So it was evident from their study that the pattern of volatility spillover between exchange rate changes and changes in stock market return behaves differently before and after shocks (Choi, Fang, & Fu, 2010). During the subprime crisis it was witnessed that volatility spillover index has a strong root to magnify spillover effects in US-BRIC equity markets (Singh & Kaur, 2016). The above discussion leads the researcher to investigate how the volatility spillover information flows on Indian stock market and foreign exchange market post subprime crisis. This information will help in formulating efficient portfolio management strategies, and will throw light on the integration pattern of these two financial markets for better currency management in future.
Research Methodology
For testing the volatility transmission or the effect of volatility spill over between the foreign exchange return the researcher has taken the Generalized Autoregressive Conditional Heteroscedastic model (GARCH). In this model conditional variance remains dependent on its own previous lags. It will be possible to ascertain whether the current fitted variance is a weighted function of long term average value of the previous period volatility and also to interpret how the variance from the model of previous period is fitted. To keep the conditional volatility positive in this model restrictions are needed to be placed on the parameters. But while estimating volatility, problems may be created which may deliver a symmetric response of volatility at different positive and negative shocks. Again the nonnegative constraints can be imposed on the parameters by the model. The volatility spillover effect may occur as a causal relationship where volatility in one market will induce the other or vice versa via lead lag relationship. Again volatility in both the markets can be affected by some common international factors also.
Different orders of AR-GARCH model is examined herewith to model the volatility spill over between two markets. Since the data belongs to foreign exchange market and stock market can be well fitted in AR (1)-GARCH (1) model the same has been used here. Volatility spillover can be tested by drawing volatility series with available data for the stock index return and the exchange rate returns. After the determination of the series to understand the presence of co-movement the Johansen Co-integration test is applied. Further from a specific model whether it is stock market or exchange rate market residuals are generated which can be used as shocks arising from a specific market and can be used in the volatility equation of a different market. The significance of the coefficients can be tested to examine the presence of the volatility spillover. So the spillover equation is framed with AR (1) and GARCH (1, 1) as mentioned below:
AR (1): yt=c + ? yt-1 + ?t, ?t N (0, ?t2) (1)
Here yt represents the return of both stock indices used and all the returns from the exchange rates used for time period t, the previous period return at time period t-1 is represented as yt-1, ? is the coefficient, c is the intercept and ?t is the white noise error term.
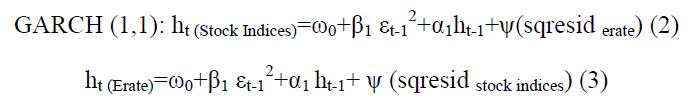
Here ?0 > 0, ?1? 0, ?1 ? 0. In both the equation ht is the conditional variance for both the stock indices and exchange rates respectively. These are the functions of ?0 (mean). The lag of the squared residual from the mean equation (?t-12) of exchange rate and stock indices is measured from the volatility of the previous period. Similarly the last period?s forecast variance (ht-1) and the squared residuals of both the stock indices and exchange rates are also been derived from the previous volatility measures. The squared residual of another market (?) is used instead of residual on their own level as a proxy of shocks in other market. However, to check the volatility spillover effect only Dollar being the major currency has been taken into consideration. But for testing cointegration all the indices and exchange rates have been taken for consideration.
Description of the Variables
The objective of the paper is to check the volatility spillover post financial crisis. Two indices were chosen representing two major stock exchanges from India Bombay Stock Exchange (BSE) and National Stock Exchange (NSE). Sensex is consisting of 30 stocks a less diversified but prominent index of BSE compared to Nifty a well-diversified index of NSE constituted of 51 stocks. Four pairs of currencies are identified as key foreign exchange rates for analysis as USD-INR, EURO-INR, GBP-INR and YEN-INR. The daily closing prices of all variables are collected from reliable sources from April 4, 2008 to September 1, 2016 for the analysis. The closing of indices were collected from BSE and NSE and the closing rate of currencies were collected from Reserve Bank of India?s website. Dividend is not included in the data as it was not available and no break in the sample period was found. Stock market operates for five days where as exchange rate is published for six days hence common data points are taken to create homogeneity in the time frame for the said period. Till date in Indian context most of the researcher has considered the US dollar for analysis but in this paper all the four currencies traded in the Indian Commodity Exchanges has been used to understand any difference in the pattern of cointegration effect currency pair wise. Though for cointegration test all the four currency pairs been used for analysis but for squared residual analysis (?) only USD-INR (Dollar) has been used for analysis. E-views software is used for data analysis.
Observation From Data Analysis
The data collected are then used to generate the log normal return following continuously compounded concept using the following formula
Log Normal Returns (Rn) = Ln (P1/P0)
Here P1 is the current day?s price and P0 is previous day?s price. Conditional variance of the stochastic component of the return is then captured to describe the volatility model. Augmented Dickey Fuller (ADF) test is conducted to check the stationarity of the data and the test suggests (Refer Table 1 and 2 below) that null hypothesis of unit root is rejected at their return levels for all the variables. All the series are found stationary at their first difference.
| Table 1: Result of Adf Test | ||
| Lag Length: 0 (Automatic - based on SIC, max lag = 24) | ||
| t-Statistic | Prob.* | |
| Augmented Dickey-Fuller test statistic | -2.106294 | 0.5414 |
| Augmented Dickey-Fuller test statistic | -1.571548 | 0.497 |
| Augmented Dickey-Fuller test statistic | -1.045115 | 0.7389 |
| Augmented Dickey-Fuller test statistic | -0.719899 | 0.8398 |
| Augmented Dickey-Fuller test statistic | 0.736452 | 0.8735 |
| Augmented Dickey-Fuller test statistic | 0.750045 | 0.8761 |
| Table 2: Adf Test Result (First Difference | ||
| Exogenous: Constant | ||
|---|---|---|
| Lag Length: 0 (Automatic - based on SIC, max lag=24) | ||
| t-Statistic | Prob.* | |
| Augmented Dickey-Fuller test statistic | -41.86311 | 0 |
| Augmented Dickey-Fuller test statistic | -41.09228 | 0 |
| Augmented Dickey-Fuller test statistic | -39.32284 | 0 |
| Augmented Dickey-Fuller test statistic | -41.61545 | 0 |
| Augmented Dickey-Fuller test statistic | -30.49261 | 0 |
| Augmented Dickey-Fuller test statistic | -43.20708 | 0.0001 |
Here P1 is the current day?s price and P0 is previous day?s price. Conditional variance of the stochastic component of the return is then captured to describe the volatility model. Augmented Dickey Fuller (ADF) test is conducted to check the stationarity of the data and the test suggests (Refer Table 1 and 2 below) that null hypothesis of unit root is rejected at their return levels for all the variables. All the series are found stationary at their first difference.
To test the volatility spillover, cointegration analysis is used. The volatility series is first extracted for the model for all the variables and then the cointegration analysis is done. Johansen conitegration test (1988) has been followed to examine the relationship. The following statements of null hypotheses are being framed and tested with the trace statistics and max-eigen value statistics.
H01 DOLLAR_Garch and NIFTY_Garch Series are not cointegrated
H02 YEN_Garch and NIFTY_Garch Series are not cointegrated
H03 EURO_Garch and NIFTY_Garch Series are not cointegrated
H04 POUND_Garch and NIFTY_Garch Series are not cointegrated
H05 DOLLAR_Garch and SENSEX_Garch Series are not cointegrated
H06 YEN_Garch and SENSEX_Garch Series are not cointegrated
H07 EURO_Garch and SENSEX_Garch Series are not cointegrated
H08 POUND_Garch and SENSEX_Garch Series are not cointegrated
The results of the cointegration relationship is being summarized and presented in the following table
Table no 4 summarizes the cointegration result of the volatility series of NIFTY and the different exchange rates. In case of Dollar_Garch and Nifty_Garch series it is found that trace statistics value (68.3929) at (r=0) is greater than the associated probability value of (15.4947) at 5%. Hence the null hypothesis of no cointegrating vector is rejected and the alternative hypothesis is accepted of having one or more cointegration vectors. Further at (r<=1) it is found that the trace statistics value (16.2133) is greater than the critical value (3.8417) at 5% level suggesting the rejection of null hypothesis of no cointegrating vectors and accept the presence of one or more cointegrating vectors.
| Table 3: Ar (1) Model Fit | |||||
| Constant | AR(1) | Q1 | Q2 | LM3 | |
|---|---|---|---|---|---|
| Sensex | 0.0005 | 0.07 | 0.07 | 0.69 | 0.68 |
| 0.03 | 0.05 | 0.35 | 0.2 | 0.4 | |
| Nifty | 0.0006 | 0.07 | 0.02 | 0.64 | 0.64 |
| 0.03 | 0.004 | 0.45 | 0.21 | 0.42 | |
| Euro | 0 | 0.05 | 0.36 | 0.07 | 0.07 |
| 0.94 | 0.04 | 0.44 | 0.46 | 0.78 | |
| Japanese Yen | -0.001 | -0.01 | 0.19 | 0.45 | 0.44 |
| 0.46 | 0.58 | 0.52 | 0.44 | 0.5 | |
| US Dollar | 0.0001 | 0.01 | 2.2 | 0.37 | 0.36 |
| 0.23 | 0.5 | 0.11 | 0.22 | 0.54 | |
| GB Pound | 0.00002 | 0.02 | 0.0002 | 0.72 | 0.71 |
| 0.51 | 0.41 | 0.91 | 0.31 | 0.39 | |
1 represents L-Jung Box Q Statistics for the residual of AR (1) model
2 represents L-Jung Box Q statistics for the squared residuals from AR (1) model.
3 represents Lagrange Multiplier Statistics to test the presence of ARCH effect in the residuals from AR (1) Model.
Again comparing the max-eigen statistics it is found that the max-eigen value (52.1795) is greater than the corresponding 5% critical value (14.2646) and it can be concluded that there exists one or more cointegrating vectors as the null hypothesis of no cointegrating vectors is rejected at (r=0). Further the result suggests that the max-eigen statistics at (r=1) is having a value of 16.2133 higher than the critical value of 3.8416 at 5% level rejects the null hypothesis of no cointegrating vectors. Hence it can be concluded that the Dollar_Garch and Nifty_Garch series is cointegrated with at least one or more cointegrating vectors.
Similarly in all the remaining series in Table no 4 (Euro_Garch and Nifty_Garch, Pound_Garch and Nifty_Garch, Yen_Garch and Nifty_Garch) it is found that trace statistics value of all these series at (r=0) is greater than their corresponding associated probability value at 5%. Hence, the null hypothesis of having no cointegrating vectors is rejected for all the series and accepts the alternative of presence of one or more cointegrating vectors in all the series.
| Table 4: Cointegration analysis garch variance (nifty and exchange rates)Linear Deterministic Trend with Lags Interval (in first differences) 1 to 4 | |||||
| Name of Series | Hypothesized No of CE(s) | Trace Statistics | Critical Value (0.05) | Max Eigen Statistics | Critical Value (0.05) |
|---|---|---|---|---|---|
| DOLLAR_GARCH, Nifty_Garch | None* (r=0) | 68.39291 | 15.4947 | 52.1795 | 14.2646 |
| At Most 1* (r<=1) | 16.2133 | 3.8414 | 16.2133 | 3.8414 | |
| EURO_GARCH, NIFTY_GARCH | None* (r=0) | 52.5257 | 15.4947 | 38.7258 | 14.2646 |
| At Most 1* (r<=1) | 13.7998 | 3.8414 | 13.7998 | 3.8414 | |
| POUND_GARCH, NIFTY_GARCH | None* (r=0) | 51.3799 | 15.4947 | 40.0809 | 14.2646 |
| At Most 1* (r<=1) | 11.299 | 3.8414 | 11.299 | 3.8414 | |
| YEN_GARCH, NIFTY_GARCH | None* (r=0) | 80.7811 | 15.4947 | 63.0652 | 14.2646 |
| At Most 1* (r<=1) | 17.7159 | 3.8414 | 17.7159 | 3.8414 | |
| Trace Test & Max-eigen value Test indicates 2 conintegrating equation(s) at 0.05 level | |||||
| * denotes rejection of the hypothesis at the 0.05 level and r refers to number of cointegrating vectors | |||||
| Macnnon-Haug-Michelis (1999) p-values is used | |||||
Again reference to Table 4 and comparing the max-eigen statistics in these series (Euro_Garch and Nifty_Garch, Pound_Garch and Nifty_ Garch, Yen_Garch and Nifty_ Garch) it is found that in every series the max-eigen value is greater than the corresponding 5% critical value and it can be concluded that there exists one or more cointegrating vectors as the null hypothesis of no cointegrating vectors is rejected at (r=0) for all these series. Further for each series the result suggests that the max-eigen statistics at (r=1) is having the values higher than the corresponding critical value at 5% level and hence rejects the null hypothesis of no cointegrating vectors in all the series. Hence all the null hypotheses H01, H02, H03 and H04 are rejected and all the series are found to be cointegrated.
| Table 5: Cointegration analysis garch variance (sensex and exchange rates) | |||||
| Linear Deterministic Trend with Lags Interval (in first differences) 1 to 4 | |||||
| Name of Series | Hypothesized No of CE(s) | Trace Statistics | Critical Value (0.05) | Max Eigen Statistics | Critical Value (0.05) |
|---|---|---|---|---|---|
| DOLLAR_GARCH, Sensex_Garch | None* (r=0) | 65.0143 | 15.4947 | 51.3021 | 14.2646 |
| At Most 1* (r<=1) | 13.7121 | 3.8414 | 13.7121 | 3.8414 | |
| EURO_GARCH, Sensex_GARCH | None* (r=0) | 51.3294 | 15.4947 | 39.4497 | 14.2646 |
| At Most 1* (r<=1) | 11.8797 | 3.8414 | 11.8797 | 3.8414 | |
| POUND_GARCH, Sensex_GARCH | None* (r=0) | 49.5134 | 15.4947 | 39.1979 | 14.2646 |
| At Most 1* (r<=1) | 10.3155 | 3.8414 | 10.3155 | 3.8414 | |
| YEN_GARCH, Sensex_GARCH | None* (r=0) | 74.3173 | 15.4947 | 59.7208 | 14.2646 |
| At Most 1* (r<=1) | 14.5964 | 3.8414 | 14.5964 | 3.8414 | |
| Trace Test & Max-eigen value Test indicates 2 conintegrating equation(s) at 0.05 level | |||||
| * denotes rejection of the hypothesis at the 0.05 level and r refers to number of cointegrating vectors | |||||
| Macnnon-Haug-Michelis (1999) p-values is used | |||||
With reference to Table no 5 showing the Trace statistics of all the series (Dollar-Garch and Sensex-Garch, Euro-Garch and Sensex-Garch, Pound-Garch and Sensex-Garch, Yen-Garch and Sensex-Garch) it is found that trace statistics value of all these series at (r=0) is greater than their corresponding associated probability value at 5% hence the null hypothesis of no conintegrating vectors is rejected for each of the series and accept the alternative of presence of one or more cointegrating vectors.
Again with reference to Table 5 and comparing the max-eigen statistics in these series (Dollar-Garch and Sensex-Garch, Euro-Garch and Sensex-Garch, Pound-Garch and Sensex- Garch, Yen-Garch and Sensex Garch) it is found that the in every series the max-eigen value is greater than the corresponding 5% critical value and it can be concluded that there exists one or more cointegrating vectors. So the null hypothesis of no cointegrating vectors is rejected at (r=0) for all these series. Further the result suggests that the max-eigen statistics at (r=1) is having the values of those series higher than the corresponding critical value at 5% level rejects the null hypothesis of no cointegrating vectors in all the series. Hence all the null hypotheses H05, H06, H07 and H08 are rejected and all the series are found to be cointegrated
Finally from the analysis of the result of cointegration test of the volatility series of exchange rate return (Dollar, Pound, Euro and Yen) and stock market return (Sensex and Nifty) in India through GARCH model shows that there exists two cointegrating vectors and long run relationship between them.
Table 6 presents the estimation results of AR1 - GARCH (1,1) model with respect to Nifty and Sensex with dollar only. It is showing all the coefficients of GARCH equations for NIFTY, Sensex and Dollar. The spillover is explained through the use of GARCH model where the residuals are derived after estimating the GARCH of each market and subsequently the same has been used as a shock for other markets. As the equations mentioned previously (equation 1 to 3) ? has been used as a parameter for volatility spillover. The results show that volatility spillover parameter is significant in case of both the markets with respect to Dollar which prompts to conclude that there exists a bi-directional volatility between stock market and foreign exchange rate (Dollar).
| Table 6:Volatility Spillover Nifty & Sensex And Dollar | ||||
| AR1 - GARCH (1,1) | AR1 - GARCH (1,1) | |||
|---|---|---|---|---|
| Coefficients | Nifty to Dollar | Dollar to Nifty | Sensex to Dollar | Dollar to Sensex |
| ?0 | 0.0006 | 0.0001 | 0.0005 | 0.002 |
| Prob | 0.03 | 0.23 | 0.03 | 0.51 |
| ?1 | 0.0726 | 0.016 | 0.07 | 0.02 |
| Prob | 0.0047 | 0.5 | 0.005 | 0.41 |
| ?1 | 0.9198 | 0.83 | 0.92 | 0.83 |
| Prob | 0 | 0 | 0 | 0 |
| ? | 0.073 | 0.14 | 0.07 | 0.148 |
| Prob | 0 | 0 | 0 | 0 |
Concluding Observation
This paper tries to explore the volatility spillovers between foreign exchange rates and Indian stock market post financial crisis in 2008. The objective of the paper was to find if volatility in the return of one market influence the volatility of returns in other market. Garch model is used for this purpose and the evidence is there that there is a long run relationship in these two markets even in post financial crisis. The volatility is bi-directional and highly persistent. Both the market moves in tandem and markets are integrated with each other significantly.
References
- Aloui, C. (2007). Price and volatility spillovers between exchange rates and stock indexes for the pre-and post-euro period. Quant Finan. Quantitative Finance, 7(6), 669-685.
- Apergis, N., & Rezitis, A. (2001). Asymmetric Cross?market Volatility Spillovers: Evidence from Daily Data on Equity and Foreign Exchange Markets. Manchester Sch, 69, 81-96.
- Apte, P. (2001). The interrelationship between Stock Markets and the Foreign Exchange Market. Prajnan, 30, 17-29.
- Beer, F., & Hebein, F. (2011). An Assessment of the stock market and exchange rate Dynamics in industrialized and emerging markets. Int Busi Econ Research J, 7(8), 59-70.
- Bodart, V., & Reding, P. (2001). Do Foreign Exchange Markets Matter for Industry Stock Returns? An Empirical Investigation. Retrieved December 22, 2016, from http://sites.uclouvain.be/econ/DP/IRES/2001-16.pdf
- Bollerslev, T. (1986). Generalized Autoregressive Conditional Heteroskedasticity. Journal of Econometrics(31), 307-327.
- Chkili, W., & Nguyen, D. K. (2014). Exchange rate movements and stock market returns in a regime-switching environment: Evidence for BRICS countries. Res Int Business Financ, 31, 46-56.
- Choi, D., Fang, V., & Fu, T. (2010). Volatility spillovers between stock market returns and exchange rate changes: the New Zealand case. Retrieved March, 25, 2014, from http://?www.?mssanz.?org.?au/?MODSIM07/?papers/?40_?s2/?VolatilitySpillo?verss2Choi.?pdf
- Dombusch, R., & Fischer, S. (1980). Exchange Rates and the Current Account. AER, 70(5), 960-971.
- Ebrahim, S. (2000). Volatility transmission between foreign exchange and money markets. Retrieved September 28, 2016, from Bank of Canada: http://www.bankofcanada.ca/2000/08/working-paper-2000-16/
- Engle, R. (1982). Autoregressive Conditional Heteroskedasticity with Estimates of United Kingdom Inflation. Econometrica(50), 987-1007.
- Fang, W., & Miller, S. (2002). Currency Depreciation and Korean Stock Market Performance during the Asian Financial Crisis. Retrieved December 16, 2016, from http://digitalcommons.uconn.edu/cgi/viewcontent.cgi?article=1285&context=econ_wpapers
- Jebran, K., & Iqbal, A. (2016, December). Dynamics of volatility spillover between stock market and foreign exchange market: evidence from Asian Countries. Retrieved December 26, 2016, from Springer Link: http://link.springer.com/article/10.1186/s40854-016-0021-1
- Jorion, P. (1991). Statistical Analysis of Cointegration Vectors. Journal of Economic Dynamics and Control, 26, 363-376.
- Kanas, A. (2000). Volatility spillovers between stock returns and exchange rate changes: International evidence. J Business Finan Acc 27(3?4):447?467, 27(3), 447-467.
- Kang, S. H., & Yoon, S. M. (2013). Revisited Return and Volatility Spillover Effect in Korea. Korea World Econ, 14(1), 121-145.
- Kearney, C., & Daly, K. (1998). The causes of stock market volatility in Australia. App Finan Econ, 8(6), 597-605.
- Kim, K. (2003). Dollar Exchange Rate and Stock Price: Evidence from Multivariate Cointegration and Error Correction model. Review of Financial Economics(12), 301-313.
- King, M. A., & Wadhwani, S. (1990). Transmission of Volatility between Stock Markets. The review of Financial Studies(3), 5-33.
- Mishra, A., Swain, N., & Malhotra, D. (2007). Volatility Spillover between Stock and Foreign Exchange Markets: Indian Evidence. Internatonal Journal Of Business, 12(3), 343-359.
- Mishra, A., Swain, N., & Malhotra, D. (2007). Volatility Spillover between Stock and Foreign Exchange Markets: Indian Evidence. International Journal Of Business, 341-359.
- Morales, L. (2008). Volatility Spillovers between Equity and Currency Markets: Eviderice from Major Latin American Countries. Cuad Econ, 45(132), 185-215.
- Nelson, B. (1991). Conditional Heteroskedasticity in Asset Returns: A New Approach. Econometrica(59), 347-370.
- Sabri, N. (2004). Stock Return Volatility and Market Crisis in Emerging Economies. Review of Accounting and Finance(3), 59-83.
- Singh, A., & Kaur, P. (2016). A short note on information transmissions across US-BRIC equity markets: evidence from volatility spillover index. Retrieved December 20, 2016, from Journal of Quant Economics: http://link.springer.com/article/10.1007/s40953-016-0047-
- Yoon, S., & Kang, H. S. (2012). Dynamic Relationship between stock returns and exchange rates: Evidence from Korea, Working Papers. Retrieved May 28, 2015, from Pusan National University: http://www.akes.or.kr/eng/papers%282012%29/9.full.pdf
- Zubair, A. (2013). Causal Relationship between Stock Market Index and Exchange Rate: Evidence from Nigeria. CBN journal of Applied Statistics, 4(2), 87-111.