Research Article: 2022 Vol: 25 Issue: 2
Economic efficiency of beef cattle production in Thailand
Sutee Khunchaikarn, King Mongkut’s Institute of Technology Ladkrabang
Panya Mankeb, King Mongkut’s Institute of Technology Ladkrabang
Suneeporn Suwanmaneepong, King Mongkut’s Institute of Technology Ladkrabang
Citation Information: Khunchaikarn, S., Mankeb, P., & Suwanmaneepong, S. (2022). Economic efficiency of beef cattle production in Thailand. Journal of Management Information and Decision Sciences, 25(2), 1-9.
Abstract
Beef farming in Thailand has expanded considerably in recent years. However, the amount of beef supply is still insufficient to meet current demand. This study characterised beef cattle farmers in Thailand and determined their economic efficiency about the technical, allocative, and cost aspects of raising beef cattle. Data were collected from 325 beef cattle farmers across five regions and 21 provinces, representing the upstream beef cattle segment. Data Envelopment Analysis (DEA) was employed to measure the Technical Efficiency (TE), Allocative Efficiency (AE), and Economic Efficiency (EE) of the beef cattle farmers. The results showed that farmers have overall TE, AE, and EE scores of 76%, 36% and 29%, respectively. Under the Constant Returns to Scale (CRS) scenario, the DEA showed lower efficiency than under the Variable Returns to Scale (VRS) scenario, indicating scale inefficiency. The results suggest that the beef cattle industry in Thailand can enhance efficiency by improving farms’ allocation of inputs rather than focusing on producing within the production frontier. Government policy and projects are recommended to develop the knowledge and skills of beef cattle farmers in determining the optimal input mix, which is predicted to improve the level of EE by 71%.
Keywords
Beef cattle; Technical; Allocative; Efficiency; Fattening; CRS.
Introduction
Beef cattle resource farming is a tradition practised by Thailand’s farmers. A conventional beef cattle farming in Thailand started in the northeast region and has undergone rapid physical, social, and economic changes in the past decade. The rapid growth in beef cattle production can be attributed to the country’s favourable geographical environment (Bunmee et al., 2018). Traditionally, the rearing of beef cattle is compatible with rice field activity. Cattle farming in Thailand primarily aimed at providing farm transport and other related activities. However, over the years, meat demand has increased from both local and foreign populations due to Thailand’s rising economic status. This has led to an improvement in native cattle’s structure from smaller to larger sizes to cater to both local and foreign beef markets (Bunmee et al., 2018).
Thailand has several advantages in beef cattle resource farming among the Association of Southeast Asian Nations (ASEAN) countries. These include knowledge and practical skills in cattle breeding, artificial insemination, fattening, production potential, resources, and complete feed sources. In addition, the country’s foundation for retail cuts and related technologies is strong, making it capable of becoming a worldwide food service centre. Beef cattle are raised for meat production, and they represent one of the top five most economically important livestock in the country in terms of Gross Domestic Product (GDP), contributing approximately 20 million Thai Baht (THB) per year (Seankamsorn & Cherdthong, 2020).
Beef farming in Thailand has expanded considerably in recent years. However, the amount of beef supply is still insufficient to meet current demand. The rapid increase in population and the continued economic progress have contributed to increasing demand in terms of both volume and quality for beef from local and foreign markets (Bunmee et al., 2018). It has also been reported that more than 90% of beef cattle raisers in Thailand are small farmers. In 2012, there were more than one million farmers and more than 6.3 million beef cattle recorded in the country, while by 2015, these figures had reduced to approximately 0.764 million farmers and 4.4 million beef cattle (Bunmee et al., 2018). These scenarios indicate the need to focus on the economic efficiency (EE) of beef cattle production. EE is farmers’ ability to produce a given level of output with the least possible cost (Maina et al., 2020). This can be done through Data Envelopment Analysis (DEA).
There are only a few studies that have employed DEA to determine the EE of livestock. For instance, Galluzzo (2019) assessed the technical efficiency (TE) of dairy and sheep farming across Iceland’s regions. The results highlighted the need for farmers to reduce certain inputs such as labour costs and general productive overheads. Mareth et al. (2019) analysed the determinants of TE in dairy farms in Southern Brazil. The results suggested that dairy farmers could increase milk output by 50.1% on average if they improve their TE. Nicola (2018) reviewed previous research outcomes by comparing farming system typologies of mixed-use Irish farms and those with animals. The results of such a study showed that dairy farms have modest levels of EE, achieving close to 77%. Unakitan & Kumbar (2018) determined the efficiency of cattle breeding farms and investigated the reasons for inefficiency. The results of the analysis showed that the farms’ TE coefficient ranged from 0.071-1.00.
The above literature review confirms that there is limited current research on the EE of Thailand’s beef cattle industry. This study was conducted to address this limitation and to investigate the other identified problems. Specifically, this study aimed to characterise beef cattle farmers in Thailand and determine their technical, allocative, and cost-efficiency. The findings of this study can be used as a guideline for beef cattle farmers in developing and meeting farm standards to increase beef market competitiveness in national and foreign markets.
Research Methodology
Study Area and Data Source
This study was conducted in the 21 provinces across the five regions of Thailand - the central, north, northeast, east, and south regions from April 2017 - September 2018. These areas were identified as upstream beef cattle segments employing innovations in the industry’s management and development for food security and competitiveness. The Department of Livestock Development (DLD) assisted in identifying the upstream beef cattle farmers; however, the population size is unknown. The study adopted the formula developed to calculate a representative sample for an unknown population parameter (Kadam & Bhalerao, 2010).
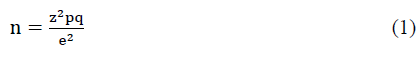
Where n is the sample size,Z is the selected critical value of the desired confidence interval (95%), p is the estimated proportion of an attribute present in the population (30%), q=1 - p and e is the desired level of precision. A total of 325 beef cattle farmers were identified and data collection lasted from April 2017 - September 2018 through face-to-face interviews. The sample was categorised into four groups according to herd size - size class 1 (<20 heads), size class 2 (20-40 head), size class 3 (41-60 head) and size class 4 (>60 head), similar to the methods employed by DeDecker et al., 2005. The categorised data reported a total of 262, 42, 11, and 10 beef cattle farmers in size classes 1, 2, 3 and 4, respectively.
Data Envelopment Analysis
DEA was employed to measure the efficiency of beef cattle farmers. This method is popular for estimating the optimal production possibility frontier, as it provides an analytical tool for determining efficient and inefficient points (Tumer et al., 2020). Moreover, DEA is less data demanding and does not require advanced knowledge of the proper functional form for the frontier, error, and inefficiency structures (Imanirad et al., 2015). According to Sickles (2015), there are three types of efficiency. These are 1) TE, which is the ability of a farm to produce the maximum output from the minimum quantity of inputs, such as labour, capital, and technology; 2) Allocative Efficiency (AE), which refers to the efficient distribution of productive resources among alternative uses to produce the optimal mix of outputs; and 3) EE, which is the combination of the above two efficiency measures and is the basis for performance measurement (Asche & Roll, 2018).
This study used DEA to analyse and propose a performance measurement model that emphasises improving factors of production (input-oriented) and further supposes that the production technology operates under the Constant Returns to Scale (CRS) principle. Lim & Zhu (2015) developed a model that can fix the assumptions by determining Variable Returns to Scale (VRS), in which an increase in farm inputs does not result in a proportional change in its outputs. Such a measure of an organisation’s efficiency is seen as more in line with reality than fixed or constant returns. According to Khalaf & Saunders (2016), the CRS scenario specifies that if inputs increase proportionally, there will be an equivalent improvement inefficiency. Moreover, Imanirad et al. (2015) stated that the DEA model specifying CRS was only appropriate for farms operating at an optimal scale. Asche & Roll (2018) measure equals 1 for efficient farms and decreases with inefficiency.
In the input-oriented model, DEA minimises input for a given level of output; thus, it indicates how much a firm can decrease its input for a given fixed output level. In the output-oriented model, DEA maximises output for a given level of input; thus, it indicates how much a firm can increase its output for a fixed input level. For the CRS scenario, given a fixed quantity of factors, the efficiency will remain the same. For the VRS scenario, the results will vary due to efficiency in the event of the incomplete competition. The main datasets for inputs and outputs are shown in Table 1. Input variables include the cost of feed, supplements, equipment, medicine, and labour. Output data were the income from beef cattle farmers, which are expressed in THB/year Mustafa et al., 2017; Omar, 2014).
| Table 1 Main Input And Output Of The Beef Cattle Dataset Used In The Dea Model |
||
|---|---|---|
| Input variable | Unit | Description |
| Feed | THB/year | Cost of feed for beef cattle for 1 year. |
| Feed supplements | THB/year | Cost of feed supplements for beef cattle for 1 year. |
| Equipment | THB/year | Cost of equipment used on a farm for 1 year. |
| Medicine | THB/year | Cost of medicine used for animals for 1 year. |
| Labour | THB/year | Cost of farm labour for 1 year. |
| Output variable | ||
| Income | THB/year | Total farm net income from beef cattle in 1 year. |
Several studies have considered alternative sets of assumptions that proposed a VRS model 19, 21, 23-26. DEA was used to measure EE in an input-oriented approach under VRS conditions(Sahoo & Tone, 2015).. The VRS DEA model is:
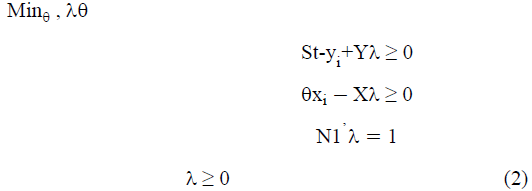
Where θ is the TE score with values of 0 ≤ 1. If θ=1, it indicates that the farmer is on the frontier, λ is the vector N ×1 of the linear combinations of 325 farmers, the linear programming problems must be solved N times for each available value for each farmer to monitor EE or Cost Efficiency (CE) due to DEA and identify the lowest cost. The CRS DEA model is:
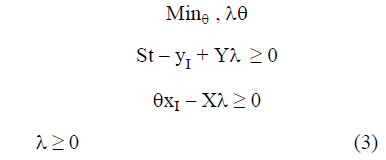
To investigate the EE or CE, the cost minimisation DEA is:

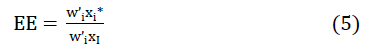
Where w’I is the vector of input costs for 325 farmers, and  is the minimising cost vector of input quantity for 325 farmers. The EE and AE is expressed in equation 5 and 6, respectively.
Results
Socioeconomic Characteristics of Beef Cattle Farmers
The socioeconomic characteristics of beef cattle farms in Thailand by herd size (size class) are shown in Table 2. The majority of beef cattle farmers across herd size (size class 1- 4) are 40-60 years of age, reflecting an ageing population involved in livestock and other agricultural commodities. There is a high frequency of low education levels across the herd size of beef cattle farmers in Thailand. This observation is consistent with previous studies mapping the situation of the beef industry in Thailand (Bunmee et al.,2018; Smith et al., 2018). Beef cattle farmers have a high number of years of farming experience. Raising livestock in the country is a traditional activity wherein farming know-how is mainly transmitted through informal education 1. Larger herd size is positively associated with a larger farm size.
| Table 2 Main Input And Output Of The Beef Cattle Dataset In The Dea Model |
||||
|---|---|---|---|---|
| Variables | Size class 1 (<20 heads) % |
Size class 2 (20-40 heads) % |
Size class 3 (41-60 heads) % |
Size class 4 (>60 heads) % |
| Age (year) | ||||
| <30 | 3 | 7 | - | - |
| 30-40 | 8 | 10 | - | 20 |
| 41-50 | 33 | 33 | 18 | 30 |
| 51-60 | 37 | 19 | 64 | 50 |
| >60 | 19 | 31 | 18 | |
| Education (year) | ||||
| <6 | 52 | 41 | 91 | 60 |
| 6-9 | 37 | 38 | - | 30 |
| 10-12 | 7 | 7 | 9 | - |
| >12 | 5 | 14 | - | 10 |
| Experience (year) | ||||
| <10 | 19 | 19 | - | |
| 10-30 | 69 | 57 | 82 | 60 |
| 31-50 | 10 | 24 | 18 | 40 |
| >50 | 2 | - | - | - |
| Farm size (year) | ||||
| <4 | 23 | 14 | - | - |
| 4-16 | 52 | 38 | 27 | 50 |
| 17-32 | 11 | 14 | 46 | 20 |
| >32 | 14 | 33 | 27 | 30 |
Input and Output Cost for Beef Cattle Farming
Table 3 summarises the input and output variables of beef cattle by herd size. Feed accounts for the largest share, ranging from 18-36% of the total input across herd size. Feed and hay are the main foods of beef cattle, and the inputs associated with the production of feed and hay are part of the feed cost component. The share of labour cost varies across herd size –40% (<20 heads), 37% (20-40 heads), 55% (41-60 heads), and 46% (>60 heads). A larger herd size entails higher costs for medicine (3-12%), while equipment tends to represent a lower share in total input cost for a larger herd size. A larger herd size also leads to a higher net income. The ratio of net income to input cost across herd size shows that size class 3 has the highest ratio of 9:1 owing to its lower cost coupled with high sales.
As this study aims to benchmark the relative efficiency of beef cattle farmers in Thailand, the variation shown in Table 3 in the input and output variables calls for an analysis of efficiency across herd size. The next sections discuss the results of the DEA method in estimating the relative efficiency of beef cattle farms in Thailand.
| Table 3 Summary Of The Input-Output Cost For Beef Cattle |
||||||||
|---|---|---|---|---|---|---|---|---|
| Input-output (THB/year) |
Size class 1 (1-19 heads) |
Size class 2 (20-40 heads) |
Size class 3 (41-60 heads) |
Size class 4 (>60 heads) |
||||
| Mean | SD | Mean | SD | Mean | SD | Mean | SD | |
| Output | ||||||||
| Net income | 144.01 | 128.07 | 303.6 | 109.15 | 551.56 | 229.45 | 551.56 | 229.45 |
| Input | ||||||||
| Food | 30.51 | 32.49 | 34.24 | 28.74 | 14.87 | 16.58 | 40.53 | 35.20 |
| Supplement | 1.80 | 6.54 | 3.13 | 5.86 | 1.34 | 1.76 | 3.52 | 2.18 |
| Equipment | 3.69 | 6.54 | 3.86 | 3.82 | 2.87 | 1.42 | 3.24 | 2.79 |
| Medicine | 1.81 | 1.47 | 5.88 | 3.00 | 6.69 | 2.32 | 13.46 | 3.88 |
| Labour | 25.58 | 12.67 | 28.12 | 13.36 | 31.38 | 12.83 | 50.85 | 20.68 |
| Note: Values for Mean and SD are in Thousand Thai Baht (THB). 1 THB = 0.0322 USD (2019 average exchange rate). |
||||||||
Technical, Allocative, and Cost Efficiency of Beef Cattle
The data in Table 4 shows the result of the pooled efficiency measures of beef cattle farming using the DEA method. The DEA results show that beef cattle farms have a low mean EE of 29% relative to the most efficient farm. This result indicates 71% of input waste, suggesting that beef cattle farms could reduce input cost by this percentage and attain the same output level. The mean allocative inefficiency (64%) of beef cattle farms is higher than the technical inefficiency (22%), suggesting that beef cattle’s high-cost inefficiency is partly attributable to a low optimal mix of inputs and less attributable to managerial factors. Beef cattle farms in Thailand are relatively good at utilising factor inputs but not choosing the optimal input mix. It appears to be attributable to their long experience in beef cattle raising for farms with higher TE. Beef cattle farming have long been a tradition in Thailand, allowing for the gradual improvement of management know-how through informal education and knowledge sharing. Bunmee et al. (2018) also recorded low levels of formal education among beef cattle farmers in Thailand and that a certain level of livestock raising skills is mainly provided through informal education and knowledge sharing. The high allocative inefficiency of beef cattle farms may reflect a large proportion of farmers adopting traditional practices for input use. Beef producers (74%) in Thailand still adopt extensive management, such as taking cattle to graze grasses, legumes, and other plants in the public areas, coupled with a lower application of concentrate and no record keeping (Smith et al., 2018).
| Table 4 Distribution Of Efficincy Score (Te, Ae, And Ce(Ee)) |
|||
|---|---|---|---|
| Efficiency score | TE | AE | CE(EE) |
| 0.00-0.20 | - | 123 | 158 |
| 0.21-0.40 | 15 | 84 | 77 |
| 0.41-0.60 | 50 | 47 | 43 |
| 0.61-0.80 | 101 | 44 | 34 |
| 0.81-1.00 | 159 | 27 | 13 |
| Mean | 0.78 | 0.36 | 0.29 |
| Maximum | 1.00 | 1.00 | 1.00 |
| Minimum | 0.218 | 0.00 | 0.00 |
Returns to Scale for Beef Cattle Production
The data in Table 5 further shows the efficiency measures under Constant (CRS) and Variable (VRS) Return to Scale of production for beef cattle. DEA provides different efficiency scores under CRS and VRS due to their respective restrictions and assumptions during computation. The CRS model assumes constant returns to scale in which any changes in the inputs produces a proportional change in output (Watkins et al., 2014). The VRS model allows us to account for different scales and still considers efficiency. The ratio of CRS and VRS provides the measurement of scale efficiency (Table 6). If the ratio of the two is equal to 1, it indicates scale efficiency, while <1 indicates scale inefficiency (Tutulmaz, 2014).
| Table 5 Efficiency Score Under Crs And Vrs By Herd Size |
||||
|---|---|---|---|---|
| Scale Efficiency | Size class 1 (<20 heads) |
Size class 2 (20-40 heads) |
Size class 3 (41-60 heads) |
Size class 4 (>60 heads) |
| No. of farms | 262 | 42 | 11 | 10 |
| CRS | ||||
| TE | 0.25 | 0.41 | 0.70 | 0.79 |
| AE | 0.32 | 0.24 | 0.40 | 0.13 |
| CE(EE) | 0.07 | 0.09 | 0.29 | 0.11 |
| VRS | ||||
| TE | 0.77 | 0.76 | 0.90 | 0.86 |
| AE | 0.39 | 0.22 | 0.38 | 0.23 |
| CE(EE) | 0.31 | 0.17 | 0.36 | 0.21 |
| Table 6 Returns To Scale A Cross Herd Sizes Of Beef Cattle |
||||
|---|---|---|---|---|
| Herd size | CRS | IRS | DRS | Total farm |
| Size class 1 (<20 heads) | 9 | 251 | 2 | 262 |
| Size class 2 (20-40 heads) | 0 | 41 | 1 | 42 |
| Size class 3 (41-60 heads) | 3 | 8 | 0 | 11 |
| Size class 4 (>60 heads) | 0 | 7 | 3 | 10 |
The envelopment with CRS shows a lower efficiency score than the VRS model does. This indicates scale inefficiency in raising beef cattle in Thailand. The output does not increase in proportion to changes in input use, and beef cattle production in Thailand is experiencing diseconomies of scale. Concerning the previous result of the DEA (Table 4), high overall inefficiency could also be partly attributed to inefficiency in the output. Inefficiencies in the output could be large or larger than the inefficiencies in the inputs. To verify this hypothesis, a study estimating output efficiency is necessary. Most studies, including this one, adopt an input orientation, often on the assumption that DMUs have more control over inputs than output.
As shown in Table 5, scale inefficiency may partly contribute to high-cost inefficiency aside from low AE. Table 6 provides a closer look at the return to scale of beef cattle. The importance of scale efficiency allows a comparison between a farm’s current operating si e and its size, which would be the most effective for minimising cost. Smaller herd sizes appear to experience economies of scale. This means that beef cattle experience Increasing Returns to Scale (IRS) because they are below the optimum size. This suggests that most beef cattle farms are still in an early stage and that increasing the production volume has the potential to deliver huge incentives. There has been a shortage of beef among all markets in Thailand. However, this opportunity may be less accessible because most farmers or beef cooperatives in the country lack sufficient knowledge and motivation (Smith et al., 2018). This partly contributes to Thai beef cattle producers’ inability to be more competitive in overseas markets ( mith et al., 2018). However, larger herd sizes also experience diseconomies of scale because they are beyond the optimum size. This suggests that farms should focus on developing the optimal use of inputs to reduce input waste and cost inefficiency. Although the DEA results indicate that AE contributed a larger share of the low EE (CE) of beef cattle production, improving the allocation of inputs should be the focus. However, it is important to note that the two efficiency measures (TE and AE) of EE should be viewed as complementary and not exclusive.
Conclusion
The study estimated the average technical, allocative, and economic efficiency of Beef cattle farming in Thailand to be 76, 36 and 29%, respectively. The high economic inefficiency is mainly attributable to low AE and poor allocation of inputs in beef cattle production. This suggests focusing more on optimal use of input to reduce waste and mitigate cost inefficiency. The DEA results under CRS show a lower efficiency score than those under VRS, indicating scale inefficiency. Smaller herds appear to experience IRS because they are below the optimum size. At the same time, larger herd sizes experience decreasing returns to scale because they are larger than the optimal size. Thailand may find more room for efficiency enhancement by improving the farm’s allocation of inputs to attain the optimal output along the production frontier. While government policy and projects aiming to develop beef cattle farmers’ knowledge about how to allocate the optimal input mix may improve their level of EE by as much as 71%. Furthermore, the adoption of new technology in beef cattle farming can help Thai producers obtain better market access to the increasing beef cattle demand, where overseas producers currently have a comparative advantage. However, one of the limitations is that this study does not consider the interplay of beef production efficiency and the environment, which is highly relevant in global warming and climate change discussions. Furthermore, aside from production efficiency, Thailand's beef production system must also be evaluated in terms of its associated greenhouse gas (GHG) emissions. Therefore, a future examination of Thailand's economically and environmentally sustainable beef production system is highly recommended for future research.
References
Kadam, P., & Bhalerao, S. (2010). Sample size calculation.International journal of Ayurveda research,1(1), 55.
Khalaf, L. and C.J. Saunders. (2016). Dynamic Technical Efficiency. In Greene, W., L. Khalaf, R. Sickles, M. Veall, M.C. Voia, (Eds). Productivity and Efficiency Analysis. Springer, Cham (pp.99-107).
Lim, S., & Zhu, J. (2015). DEA Cross Efficiency under variable returns to scale. InData Envelopment Analysis(pp. 45-66). Springer, Boston, MA.
Maina, F., Mburu, J., Gitau, G., & VanLeeuwen, J. (2020). Factors influencing economic efficiency of milk production among small-scale dairy farms in Mukurweini, Nyeri County, Kenya.Tropical animal health and production,52(2), 533-539.
Mareth, T., Scavarda, L. F., Thomé, A. M. T., Oliveira, F. L. C., & Alves, T. W. (2019). Analysing the determinants of technical efficiency of dairy farms in Brazil.International Journal of Productivity and Performance Management.
Omar, M. A. E. (2014). Technical and economic efficiency for broiler farms in Egypt. Application of data envelopment analysis (DEA).Global Veterinaria,12(5), 588-593.
Sahoo, B. K., & Tone, K. (2015). Scale elasticity in non-parametric DEA approach. InData Envelopment Analysis(pp. 269-290). Springer, Boston, MA.
Sickles, R. C., Hao, J., & Shang, C. (2016). Productivity measurement, model averaging, and world trends in growth and inequality. InProductivity and Efficiency Analysis(pp. 305-323). Springer, Cham.
Unakitan, G., & Kumbar, N. (2018). Efficiency analysis of cattle breeding farms in Thrace Region, Turkey.Custos e@ gronegócio,14(4), 336-349.