Research Article: 2021 Vol: 27 Issue: 5
Efficiency of Public Entrepreneurial Spending on Solid Waste Management in the Municipalities of the Puno Region
Andres Vilca Mamani, School of Economic Engineering of UNA-Puno
Erika Beatriz García Castro, School of Economic Engineering of UNA-Puno
Ernesto Calancho Mamani, School of Economic Engineering of UNA-Puno
Edson Apaza Mamani, School of Economic Engineering of UNA-Puno
Vitaliano Enriquez Mamani, Public Management Professional School and Social Development of UNAJ-Juliaca
Citation Information: Mamani, A.V., Castro, E.B.G., Mamani, E.C., Mamani, E.A., & Mamani, V.E. (2021). Efficiency of public entrepreneurial spending on solid waste management in the municipalities of the puno región. Academy of Entrepreneurship Journal (AEJ), 27(5), 1-14.
Abstract
The paper evaluates the efficiency of public spending on solid waste management in the municipalities of the Puno region, Peru-2019. The one-stage input-oriented Data Envelopment Analysis of Constant-Scale Returns (DEA-CRS) and Variable-Scale Returns (DEA-VRS) methodology is used to calculate efficiency scores, with a population of 109 municipalities. The TOBIT regression model is used to evaluate the determinants of efficiency. The results show inefficiency in municipal waste management; on average, the municipalities of the Puno region could collect one ton of solid waste per day with 82% fewer resources, with the most efficient municipalities being Juli, San José, Santa Lucia and Juliaca. The resources from the canon and the decrease in the frequency of solid waste collection are negatively associated with efficiency scores, while municipal planning through the implementation of the solid waste management plan and including a greater number of operational collection trucks positively influenced the efficiency of public spending on municipal waste management.
Keywords
Enveloped Data Analysis, Efficiency, Municipalities and Municipal Solid Waste.
Introduction
Measuring and comparing economic performance in municipalities through efficiency remains a relevant topic in public management and are considered a key tool, something essential for policymakers' decisions (Inverno et al., 2018).
Thus, Municipal Waste Management (MWM) becomes relevant in local public management, because the study of local government efficiency contributes to evaluate the fiscal costs associated with strengthening decentralization (Meloet al., 2020) and effective waste management systems can make fundamental contributions to public health, environmental sustainability and economic development (Bernardino et al., 2011).
The assessment of municipal solid waste management efficiency has been one of the indicators to measure the level of urban governance (Nzeadibe & Anyadike, 2012). It can reflect the degree of urban ecological civilization (Eriksson et al., 2005) and is valuable for policy makers (Sharholy et al., 2008).
Municipal solid waste is produced by all activities and, although it is a problem of local origin, it has both local and global effects. Sustainable waste management requires the combination of skills and knowledge from physical sciences and engineering along with economics, ecology, human behavior, entrepreneurship and good governance (Halkos & Petrou, 2016). They are further defined as local waste generated by households, commercial and governmental enterprises. It includes packaging, food waste, food waste, grass clippings, clothing, paper, and other solid forms of waste, but does not include hazardous and infectious waste or sewage (Yukalang et al., 2018). Municipal waste management is a major contributor to several environmental and public health problems (Wang et al., 2000).
Poor performance of municipal solid waste management is associated with poor local public health (Yang et al., 2018). It can be seen that on average in the municipal sector, more resources than necessary are being spent on services delivered to citizens (Horst, 2007). High expenditures reduce the supply of public services (Prior, 2011) and a decrease in coverage.
Serious environmental problems have been raised due to inadequate and inefficient disposal of municipal solid waste (Aleluia & Ferrão, 2016; Bernardino et al., 2011). Efficient resource allocation can increase the social benefits acquired (Melo et al., 2020).
The formidable increase in solid waste generation requires adequate management systems (Albores et al., 2016), because poor municipal waste management is not conducive to improving eco-efficiency (Ferronato et al., 2018).
According to Garcia (2019), Peru still presents problems of public cleanliness and every day there are more urban dwellers (75% of Peruvians live in cities). In 2018, the average amount of solid waste collected by municipalities nationwide amounted to 22 thousand 860 tons; registering 0.7 kg per inhabitant daily. The volume of waste produced in Peru is increasing; 10 years ago, it was 13 thousand T/day, and by 2018 it went to 22 thousand tons a day. The 83.2% of this waste is not properly disposed of, and its final destination is a landfill.
Likewise, the cities of the Puno region in total in 2019 produced 576.8 Tn/day of solid waste, and also report a gap of 65% of municipal waste collection service coverage according to the National Registry of Municipalities of 2019 in addition.
Municipal inefficiency would be related to high levels of corruption, low accountability, larger population size, per capita subsidies, when resources are oriented to administrative expenses, greater distance to the regional capital, greater dependence on the foncomun with respect to their own income, transfers from the canon resource (Abrate et al., 2014; Ayaviri & Quispe, 2011; Catalán & Ballve, 2009; Pacheco et al., 2013; Stastna & Gregor, 2011). Likewise, small municipalities are inefficient because they are unable to exploit economies of scale in the provision of public goods and services, thus the services offered are limited to the needs of the population (Inverno et al., 2018).
While efficiency would be associated with re-elected mayors, those who establish a high tax rate, citizen participation (Bianchini, 2010; Catalán & Ballve, 2009) and when local governments that include private operation in solid waste collection are more efficient (Ichinose et al., 2013). However, the inefficiency found is not entirely attributable to poor management (Balaguer et al., 2007).
On the other hand, public expenditure efficiency scores have a positive and significant correlation with economic growth in the region (Faisol, 2017). Meanwhile, fiscal decentralization can improve the efficiency of public service delivery (Alonso & Andrews, 2018; Sow & Razafimahefa, 2015).
In a context of scarce budgetary and technical resources and increasing municipal solid waste production, increasingly demanding efficiency techniques are required (Bernardino et al., 2011; Cavallin et al., 2016). Most governments strive for an ecological civilization, hence the importance of public spending efficiency in environmental protection (Zhang et al., 2019). Because the efficiency of local government spending contributes to economic growth (Sekiguchi, 2019), and higher coverage and frequency of solid waste collection.
Taking the considerations raised, the objective of the research is to analyze the efficiency of public spending on solid waste management in the municipalities of the Puno region in 2019 and identify the variables that are associated with efficiency scores.
Material and Methods
The target population is the local governments of the Puno region, while the information to be used corresponds to the year 2019 from the National Registry of Municipalities-INEI and the Transparency Portal of the Ministry of Economy and Finance.
Data Envelopment Analysis Model - DEA-CRS and DEA-VRS
The efficiency of public spending can be measured as a difference between actual spending and the theoretically possible minimum spending that is sufficient to produce the same level of real output (Esanov, 2009). Data Envelopment Analysis is a non-parametric technique widely used for estimating efficiency in local government management (Horst, 2007).
DEA models can also be subdivided in terms of returns to scale by adding weight constraints, by which efficiency is analyzed on the input side, involving assessing how much the quantity of inputs can be proportionally reduced while maintaining the quantities of output, while efficiency on the output side allows assessing how much the output level can be increased while maintaining the quantity of inputs used (Catalán & Ballve, 2009; Charnes et al., 1978) originally proposed the measurement of DMU efficiency for constant returns to scale (CRS) where all DMU are operating at their optimal scale. Subsequently, Banker et al. (1984) introduced the variable returns to scale (VRS) efficiency measurement model that allows the efficiency to be broken down into technical and scale efficiencies in DEA. DEA is a method for measuring the efficiency of DMU (local government i) using linear programming techniques.
The DEA-CRS model or returns to constant scale, which assumes a convex production frontier (Bernardino et al., 2011; Catalán & Ballve, 2009; Inverno et al., 2018; Rogge & De Jaeger, 2013), assumes n=109 municipalities, each producing m outputs (tn of municipal solid waste/day) using k input (soles/tn of daily collection), the input is the expenditure executed in soles in municipal solid waste management (public cleaning service), which consists of household collection, transportation and final destination of solid waste, street sweeping and other expenses, the linear programming model is:
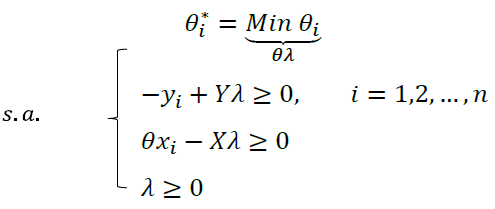
Where yi, is the vector of outputs produced by the municipality i, xi: vector of inputs used by municipality i, Y: matrix (m × n) of outputs for all n municipalities, X: matrix (k × n) of inputs for all n municipalities, λ: vector (n × 1) of constants, which measures the weights used to calculate the location of an inefficient DMU if it were to become efficient, i: takes values from 1 to n and represents the number of DMU, θ:scalar representing the efficiency score for municipalities, which satisfies the constraint θ ≤ 1. If θ < 1, the municipality is inefficient, if θ = 1, then the municipality is efficient.
DEA-VRS model or variable returns to scale (Afonso & Fernandes, 2005; Yang et al., 2018; Yusfany, 2015), the model is posed with the following mathematical programming problem:
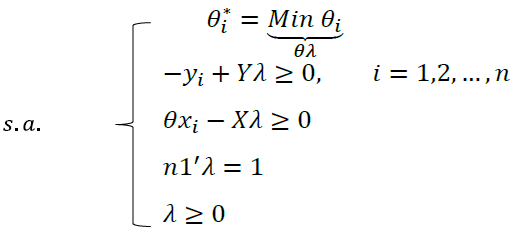
Where n1 is an n-dimensional vector of 1: the constraint n1 '= λ imposes the convexity of the frontier, 1 which accounts for variable returns to scale. Eliminating this constraint would be equivalent to assuming constant returns to scale.
Determinants of Municipal Solid Waste Management Efficiency
To estimate the determinants of efficiency, the Tobit model is used to incorporate values grouped in a limit value in the dependent variable, where the censored regression is appropriate for efficiency scores, because the dependent variable is observed only in a certain range. In the case of the research, it assumes as value below 0 and as value above 1 (Inverno et al., 2018; McDonald & Moffitt, 1980; Ruggiero, 2004). The Tobit model can use zero-valued data and continuous data (Afonso & Fernandes, 2008). The Tobit regression model for the article is:

Where θi, is the efficiency score of spending on the municipal waste collection service; Canon: is the resources of the canon; PL: solid waste management plan (dichotomous variable); Truck: operational collection truck; Denspob: population density; Frecojo: collection frequency; and Coverage: is the coverage of the service in the capital of the district.
Results
Taking nine districts that produce the greatest amount of solid waste in the Puno region (Table 1), it can be seen that the city of Juliaca is the municipality that collects the most solid waste daily, Juliaca has accumulated an average of 239 metric tons of garbage per day. The accumulation of solid waste has generated unrest among the citizens because the municipality does not manage the sanitary landfill, not only in San Román, but also in other provinces such as Puno, Huancané and Azángaro.
In second place, the district capital that collected the most solid waste was Puno (103 tons), followed by the municipalities of Juli (31 tons), Ayaviri (30 tons) and Ilave (15 tons).
According to the cost per ton of solid waste collection in the district of Juliaca, it was S/. 53, while in the district of Puno it was S/. 168, comparing both municipalities, Juliaca have a higher productivity of solid waste collection. The following municipalities can also be observed in Table 1.
| Table 1 Districts that Generate the Most Solid Waste and Cost Per Ton Collected | ||||
| District | Average kg of solid waste (garbage)/day | Average metric ton of solid waste (garbage)/day | Expenditure on solid waste per year in S/. | Cost per ton of solid waste collection |
| Yunguyo | 7,000 | 7,0 | 304,388,00 | 119 |
| San Gaban | 7,233 | 7,2 | 43,000,00 | 16 |
| Macusani | 8,500 | 8,5 | 734,741,00 | 237 |
| St. Lucia | 14,000 | 14,0 | 58,575,00 | 11 |
| Ilave | 15,000 | 15,0 | 735,000,00 | 134 |
| Ayaviri | 30,000 | 30,0 | 969,000,00 | 88 |
| Juli | 41,000 | 41,0 | 290,340,00 | 19 |
| Puno | 103,117 | 103,1 | 6,305,646,00 | 168 |
| Juliaca | 239,000 | 239,0 | 4,621,953,00 | 53 |
In the Puno region (Table 2), an average of 37.6% of the municipalities collect solid waste on a daily basis. Likewise, only 38 (35%) of the municipalities report a coverage of 75% to l00%. The gaps in solid waste collection service coverage are greater in the municipalities of Chucuito, El Collao, San Román and Huancané. Therefore, there is a high gap in solid waste management service coverage (Table 3).
| Table 2 Frequency of Collection and Coverage of Solid Waste Services | |||
| Frequency of collection (%) | Service coverage (%) | ||
| Daily | 37,6 | Less than 25% | 6,4 |
| Inter-daily | 11,0 | From 25% to 49%. | 15,6 |
| Twice a week | 25,7 | From 50% to 74%. | 43,1 |
| Once a week | 25,7 | From 75% to 100%. | 34,9 |
| Table 3 Estimation of the Efficiency of the Solid Waste Collection Service Expenditure | |||||
| DEA | Obs | Mean | Std. Err | 95% Conf | Interval |
| DEA-CRS | 109 | 0,11 | 0,01 | 0,08 | 0,13 |
| DEA-VRS | 109 | 0,26 | 0,02 | 0,21 | 0,30 |
| Total average | 109 | 0,18 | |||
The common destination of solid waste in the municipalities of the Puno region is the landfill. Of the 576.8 tons of solid waste collected daily on average by the municipalities of the Puno region, 93.7% (540.4 tons) is destined to the landfill, 3.7% (21.3 tons) is treated by recycling, 1.7% (10.1 tons) is burned or incinerated, and only 0.8% is sent to a sanitary landfill. 7% (21.3 tons) is treated by recycling, 1.7% (10.1 tons) is burned or incinerated, and only 0.8% is destined for a sanitary landfill, and finally, 0.1% is destined for composting or a treatment plant (Figure 1). Open dumps have negative effects on respiratory health and involve costs related to the care of respiratory health symptoms (Girón et al., 2009).

Figure 1 Final Destination of Solid Waste as A Percentage of the Total Average Solid Waste Collection in the Districts of Puno
Burning or incineration is an obsolete and unsustainable method for dealing with solid waste, as it generates polluting emissions for health and the environment. It can be seen that every day 1.7% of solid waste collection is burned or incinerated, under the direct administration of local governments, mainly in the municipalities of Azángaro, Chucuito and Huancané.
The average efficiency score for municipalities in the Puno region was 0.18 (18%) according to the input-oriented DEA-CRS and DEA-VRS. Consequently, on average, municipalities in the Puno region could perform the collection service of one ton of solid waste per day with 82% less resources, i.e., with less than half (<50%) of their programmed budget.
According to Table 4, the district municipalities Juli, San José, Santa Lucia and Juliaca, according to the DEA-VRS, were the most efficient, with efficiency score indexes of one, which indicates a higher level of efficiency in solid waste collection; according to the DEA-CRS, the most efficient municipalities were Santa Lucia and San Gaban with efficiency indexes of 1 and 0.70.
| Table 4 Ten Most Efficient and Inefficient Districts According to Dea-Vrs and Dea-CRS in Solid Waste Collection Service Expenditure | |||||
| Efficient | Inefficient | ||||
| District | Ranking | DEA-VRS | District | Ranking | DEA-VRS |
| Juli | 1 | 1 | Ajoyani | 100 | 0,064 |
| San Jose | 2 | 1 | Antauta | 101 | 0,062 |
| St. Lucia | 3 | 1 | Lampa | 102 | 0,060 |
| Juliaca | 4 | 1 | Azángaro | 103 | 0,059 |
| Anapia | 5 | 0,91 | Macusani | 104 | 0,051 |
| Huayrapata | 6 | 0,90 | Pisacoma | 105 | 0,047 |
| Yanahuaya | 7 | 0,79 | Jose Domingo Choquehuanca | 106 | 0,043 |
| San Gaban | 8 | 0,75 | Putina | 107 | 0,042 |
| Rosaspata | 9 | 0,66 | Huancané | 108 | 0,038 |
| Atuncolla | 10 | 0,58 | Orurillo | 109 | 0,037 |
| Efficient | Inefficient | ||||
| District | Ranking | DEA-CRS | District | Ranking | DEA-CRS |
| St. Lucia | 1 | 1 | Plateria | 100 | 0,012 |
| San Gaban | 2 | 0,70 | Macari | 101 | 0,011 |
| Juli | 3 | 0,59 | Santiago De Pupuja | 102 | 0,010 |
| Anapia | 4 | 0,54 | Chucuito | 103 | 0,009 |
| Yanahuaya | 5 | 0,42 | Pisacoma | 104 | 0,008 |
| Phara | 6 | 0,35 | Achaya | 105 | 0,008 |
| San Antonio | 7 | 0,35 | Paucarcolla | 106 | 0,008 |
| Ananea | 8 | 0,31 | Tinicachi | 107 | 0,007 |
| Umachiri | 9 | 0,29 | Calapuja | 108 | 0,002 |
| Kelluyo | 10 | 0,23 | Amantani | 109 | 0,002 |
Among the least efficient municipalities are Orurillo, Huancane, Putina and José Domingo Choquehuanca with indices of 0.037, 0.038, 0.042 and 0.043 successively according to the DEA-VRS; while the DEA-CRS results show the municipalities of Amantani, Calapuja Tinicachi and Paucarcolla as inefficient with indices of 0.002, 0.002, 0.007 and 0.008 successively. It should be noted that some municipalities with low efficiency indices show high population density, greater coverage or scope of solid waste collection and daily frequency of collection. These indicators would be associated with municipal efficiency, for example, the fact of having a greater coverage requires greater resources, and would be affecting the efficient use of allocated resources, which is corroborated later by means of a model.
A one percent increases in public spending of canon resources decreases the efficiency of local spending on municipal solid waste management by 0.001 points. Thus, financing public cleaning services, with conditional resources such as the canon, makes solid waste management less efficient (Shows in Table 5).
| Table 5 Tobit Regression Results and Marginal Effects for the Censored Regression | |||
| Efficiency/explanatory variables | Tobit | dy/dx | Std. Err |
| Canon resources | -0,010*** | -0,009 | 0,004 |
| (-2,29) | |||
| Management plan | 0,075** | 0,066 | 0,039 |
| (1,68) | |||
| Operational truck | 0,185*** | 0,164 | 0,060 |
| (2,74) | |||
| Population Density | -0,018+ | -0,016 | 0,017 |
| (-0,91) | |||
| Frequency of pickup | -0,040** | -0,035 | 0,019 |
| (-1,86) | |||
| Coverage | -0,047** | -0,042 | 0,022 |
| (-1,89) | |||
| cons | 0,544*** | ||
| (4,95) | |||
| var(e, dea_vrs) | 0,048 | ||
| N | 109 | ||
* p<0.10, ** p<0.05, *** p<0.001
p: significance level
Note: is the marginal effect of the Tobit model.
When the municipality has a management instrument (solid waste management plan), efficiency increases by 0.075 points, and it is known that only 36% of the municipalities have a management instrument. Municipal planning in solid waste management is a strategy for improving efficiency, optimizing the resources allocated to obtain better results. Likewise, inadequate municipal planning leads to poor organization and management, which means that the control and organizational capacity of the municipalities does not fully cover public cleaning services.
When the solid waste collection truck is increased by one unit and is operational, municipal efficiency increases by 0.185 points. Of the 109 local governments, 42% have at least one operational collection truck for public cleaning and 21% of municipalities have at least one non-operational collection truck. Thus, the more collection trucks that are operational, the higher the municipality's efficiency scores.
In contrast, as the frequency of solid waste collection in the district capital decreases; from daily, inter-daily, twice a week and once a week, the efficiency scores decrease (Figure 2). Inefficiency is even worse when the municipality collects solid waste once a week (the efficiency score decreases by 0.12 points).

Figure 2 Average Efficiency According to Frequency of Solid Waste Collection in the District
Municipalities with less percentage of coverage (<50%) and those with 75% to 100% coverage of solid waste collection are more inefficient as opposed to the group of municipalities with coverage between 50% to 74% (Figure 3).

Figure 3 Average Efficiency According to Coverage of Solid Waste Collection Services
Discussion
The average technical efficiency in solid waste management for municipalities in the Puno region show average of 0.18, which is lower compared to the national average of 0.47 (Orihuela, 2018). This indicates that there is a high municipal inefficiency in the Puno region in the use of public resources, being able to provide the collection of a daily ton of solid waste with 82% less resources. For Catalán and Ballve (2009), the provision of municipal goods and services in Peru can be provided with 57.6% fewer resources, so inefficiency in municipal solid waste management is more worrisome in the Puno region.
The results show that some municipalities do not necessarily require increases in transfers to improve solid waste management, because most municipalities could achieve, on average, the same level of production using fewer resources, improving performance without necessarily increasing municipal spending, as shown by Afonso and Fernandez (2005, 2006).
These results showed that there are several districts that have a high expenditure in the collection of a daily ton of solid waste but failed to achieve the maximum efficiency score, being the municipalities with the highest expenditure: Amantani, Calapuja, Tinicachi, Paucarcolla, Achaya and Pisacoma, which was verified in the efficiency of expenditure for the province of West Java-Indonesia (Inverno et al., 2018).
Comparing the average efficiency of municipal waste management with the 36 cities at the municipal level in China, the inefficiency is higher for municipalities in the Puno region, since cities in China obtained an efficiency of 0.544 (Yang et al., 2018), which is also lower efficiency to municipalities in Flanders of Belgium of 0.47 (Rogge & De Jaeger, 2013). The variability of the efficiency indices is due to the fact that in China cities have attached greater importance to solid waste management, and despite China is the largest producer of municipal solid waste, it maintains an efficiency greater than 50%.
Inefficiency in municipal solid waste management persists in the region of Puno according to the results of the research, despite the fact that measures were adopted in the new law of integrated solid waste management D.L. No. 1278, as one of the pillars is the efficiency in the use of materials.
Likewise, the government has implemented budget program 0036 (integrated solid waste management), which specifically seeks to reduce the amount and hazardousness of uncontrolled solid waste disposed of in the environment, which should be disposed of in a sanitary landfill, but in most districts of Puno, there are only open dumps (93.7%). Therefore, the budget program 0036 is not achieving the specific results, one reason being the budget execution with an efficiency of 85% according to the Ministry of Economy and Finance.
Municipal size really affects the efficiency of public spending. In the Puno region, the municipalities of Juliaca and Puno are considered the largest, followed by the municipalities of Ilave, Juli and Azángaro, which have an Opening Institutional Budget (PIA) of around 75 and 53 million soles, respectively. Indeed, the larger municipalities such as Juliaca, Juli and Ilave are more efficient with indexes of 1, 1 and 0.91 respectively. The result proves that the larger a municipality is, the higher its level of efficiency of public spending, and lower is the efficiency in small municipalities, but it is not attributable to poor management (Balaguer et al., 2007; Inverno et al., 2018). Likewise, not all municipalities possess an optimal size at scale to be efficient in the production of the municipal services they deliver to the population (Horst, 2007).
Abrate et al. (2014) mentions that both corruption and a low level of voter information on managerial actions induce managers to reduce effort levels, thus contributing to reduced efficiency. The problem of corruption would not be alien to local governments, hence the inefficiency in municipal services.
Some studies associate efficiency and economic growth; thus, efficiency is not only optimal allocation of resources, it improves service coverage and could even contribute to local and national economic growth. Because looking at Vietnam improved the efficiency of local government spending while achieving rapid economic growth (Sekiguchi, 2019).
On the other hand, the governments of the prefectures of Japan, according to the DEA-VRS and input-oriented DEA-CRS, obtained an efficiency score of 0.884; therefore, these cities are more efficient than the cities of the municipalities of the Puno region. It is interesting to analyze that solid waste in Japanese cities is not only collected by public operators, but also by private operators through contracting or licensing of waste collection, hence prefectures with greater participation of the private sector in solid waste collection are more efficient (Ichinoseet al., 2013).
The canon resources showed the decrease in the efficiency of spending on municipal waste management, this would prove the flypaper effect and fiscal laziness of canon transfers (Catalán & Ballve, 2009; Garcia, 2020; Vilca et al., 2020), because taxes are more efficient than transfers to finance the operating budget of municipalities (Arcelus et al., 2015). Moreover, the popularity of local authorities depends on the price collection of solid waste (Rogge & De Jaeger, 2013).
Comparing the results of the research with Flemish municipalities-Belgium, subsidies have a positive impact on the efficiency of basic public services, this finding is due to the strict supervision of subsidies in spending (Geys & Moesen, 2009). To mitigate the problem, the Comptroller of the Republic should exercise greater control over the use of these resources. Some studies went so far as to explain that public spending is not the main determinant of local government performance in environmental quality (Bianchini, 2010).
Municipal planning in municipal waste management is very important, since it has a solid waste management plan at the municipal level favors waste efficiency, and the right strategic planning helps to obtain improvements in municipal management (Prior, 2011). On the other hand, the planning of solid waste collection routes is a strategy to improve the efficiency of municipal management that optimizes the available resources to obtain better results (Cavallinet al., 2016).
It has been seen that the collection truck favors the efficiency of solid waste collection expenditure, which proves that implementing new technologies can help manage waste more efficiently (Halkos & Petrou, 2016). There is evidence that some municipalities continue with waste collection with dump trucks, smaller vehicles and the non-operationalization of some collection trucks would be associated with inefficiency. Newer assets are likely to prove more efficient in the service delivery process (Arcelus et al., 2015)
Conclusion
The inefficiency of spending on municipal solid waste management in the Puno region is observed, so the municipalities in the Puno region could collect one ton of solid waste per day with 82% less resources, that is, with less than half of their programmed budget. Therefore, municipalities do not necessarily require increases in transfers to improve the efficiency of solid waste management, either in coverage or frequency of waste collection, because most municipalities could achieve the same level of production using fewer resources, and thus improve municipal performance without the need to increase the municipal budget. The most efficient municipalities were Juli, San José, Santa Lucia and Juliaca. Of the 576.8 tons of waste collected daily on average by the region's municipalities, 93.7% is disposed of in landfills, as most of the districts do not have a sanitary landfill.
It has been shown that municipal size is related to spending efficiency; the larger municipalities such as Juliaca, Juli and Ilave were indeed more efficient, with the exception of Puno, while efficiency was lower in the smaller municipalities.
The canon resources do not favor the efficiency of solid waste management; therefore, the ineffectiveness of the canon resources would probably be associated with the flypaper effect problem. Likewise, municipal planning in solid waste management through the implementation of the management instrument of the solid waste management plan had a positive effect on efficiency. On the other hand, the availability of an operational collection truck for solid waste collection has a positive effect on efficiency, in that the availability of new and operational collection trucks improves efficiency. Finally, as the frequency of solid waste collection decreases, efficiency scores decrease, and inefficiency is lower in municipalities with solid waste collection service coverage of 50% to 74%.
It is recommended that the Comptroller of the Republic should have greater control over the execution of solid waste management expenditures. It is also recommended that solid waste collection be outsourced by contracting or licensing and implementing a solid waste collection route plan in each local government. A maintenance plan for the collection trucks is recommended since several municipalities have non-operational collection trucks.
References
- Abrate, G., Boffa, F., Erbetta, F., &amli; Vannoni, D. (2013). Corrulition, accountability and efficiency. An alililication to municilial solid waste services. Deliartment of Economics and Statistics Working lialier Series, 22.
- Afonso, A., &amli; Fernandes, S. (2008). Assessing and exlilaining the relative efficiency of local government. The Journal of Socio-Economics, 37(5), 1946-1979.
- Afonso, A., &amli; Fernandes, S. (2006). Measuring local government sliending efficiency: Evidence for the Lisbon region. Regional Studies, 40(1), 39-53.
- Afonso, A., &amli; Fernandes, S. (2008). Assessing and exlilaining the relative efficiency of local government. The Journal of Socio-Economics, 37(5), 1946-1979.
- Albores, li., lietridis, K., &amli; Dey, li.K. (2016). Analysing efficiency of waste to energy systems: using data enveloliment analysis in municilial solid waste management. lirocedia Environmental Sciences, 35(2016), 265-278.
- Aleluia, J., &amli; Ferrão, li. (2016). Characterization of urban waste management liractices in develoliing Asian countries: A new analytical framework based on waste characteristics and urban dimension. Waste Management, 58(2016), 415-429.
- Alonso, J.M., &amli; Andrews, R. (2018). Fiscal decentralisation and local government efficiency: does relative delirivation matter. Environment and lilanning C: liolitics and Sliace, 37(2), 360-381.
- Arcelus, F.J., Arocena, li., Cabasés, F., &amli; liascual, li. (2015). On the cost-Efficiency of service delivery in small municilialities. Regional Studies, 49(9), 1469-1480.
- Ayaviri, D., &amli; Quislie, G. (2011). Measurement of allocative efficiency through data enveloliment analysis in the municilialities of Bolivia: case of the municilialities of liotosí. liersliectives Magazine, 28(1), 137-169.
- Balaguer, M.T., lirior, D., &amli; Tortosa, E. (2007). On the determinants of local government lierformance: A two-stage nonliarametric aliliroach. Euroliean Economic Review, 51(2), 425-451
- Banker, R.D., Charnes, A., &amli; Coolier, W.W. (1984). Some models for estimating technical and scale inefficiencies in data enveloliment analysis. Management Science, 30(9), 1078-1092.
- Bernardino, B.L., Enguix, M., del, R.M., &amli; José, S.I. (2011). Determinants of efficiency in the lirovision of municilial street-cleaning and refuse collection services. Waste Management, 31(6), 1099-1108.
- Bianchini, L. (2010). Municilial sliending and urban quality of life: a Stochastic Frontier Analysis. In contributo liresentato alla XXIII Conferenza della Società italiana di Economia liubblica (liavia), dislionibile al sito: httli://www-3. uniliv. it/websieli/2010/201046. lidf (23 settembe 2011).
- Catalán, li.H., &amli; Ballve, li.F. (2009). Analysis of the efficiency of municilial sliending of its determinants. Economy, 32(63), 113-178.
- Cavallin, A., Rossit, D., &amli; Frutos, M. (2016). Efficiency in Urban Solid Waste Management: Analysis and evaluation. Deliartment of Economics, National University of the South. CEDETS (CIC-University.
- Chames, A., Coolier, W.W., &amli; Rhodes, E. (1978). Measuring the efficiency of decision making units. Euroliean Journal of Olierational Research, 2(6), 429-444.
- Eriksson, O., Carlsson Reich, M., Frostell, B., Björklund, A., Assefa, G., Sundqvist, J.O., Granath, J., Baky, A., &amli; Thyselius, L. (2005). Municilial solid waste management from a systems liersliective. Journal of Cleaner liroduction, 13(3), 241-252.
- Esanov, A. (2009). Efficiency of liublic sliending in resource-rich liost-Soviet states. Revenue Watch Institute at httlis://resourcegovernance. org/sites/default/files/documents/rwi_esanov_efficiencyof liublicsliending. lidf.
- Faisol, F. (2017). The analysis of local government exlienditure efficiency and its imliact on economic growth in Indonesia. The 3rd international Conference on Economics, Business and Accounting Studies ICEBAST 2017, Faculty of Econmics and Business University of Jember Indonesia.
- Ferronato, N., Gorritty liortillo, M.A., Guisbert Lizarazu, E.G., Torretta, V., Bezzi, M., &amli; Ragazzi, M. (2018). The municilial solid waste management of La liaz (Bolivia): Challenges and oliliortunities for a sustainable develoliment. Waste Management Research, 36(3), 288-299.
- Garcia, E.B. (2020). Incidence of the allocation of transfers in the local tax collection in the municilialities of lieru. Research Journal of the Graduate School, 9(2), 1503-1517.
- García, J. (2019). lieru: Municilial management indicators. National institute of statistics and informatics.
- Geys, B., &amli; Moesen, W. (2009). Exliloring sources of local government technical inefficiency: evidence from flemish municilialities. liublic Finance and Management, 9(1), 1-29.
- Girón, S.L., Mateus, J.C., &amli; Méndez, F. (2009). Imliact of an olien dumli on the develoliment of resliiratory symlitoms in family health care costs of children between 15 years of age in Cali, Colombia. Biomédica, 29(3), 392.
- Halkos, G., &amli; lietrou, K.N. (2016). Munich liersonal reliec Archive Efficient waste management liractices&nbsli;: A review Efficient waste management liractices: A review. En Munich liersonal Reliec Archive (N.o 71518; Número 71518). httlis://mlira.ub.uni-muenchen.de/71518/
- Horst, B. (2007). Are our municilialities efficient? An alililication of the data enveloliment analysis model. Freedom and develoliment. httli://lyd.org/other/files_mf/SIE-175-Son nuestros municiliios eficientes Una alilicacion del modelo de analisis-BHorst-19-01-200.lidf
- Ichinose, D., Yamamoto, M., &amli; Yoshida, Y. (2013). liroductive efficiency of liublic and lirivate solid waste logistics and its imlilications for waste management liolicy. IATSS Research, 36(2), 98-105.
- Inverno, G., Carosi, L., &amli; Ravagli, L. (2018). Global liublic sliending efficiency in Tuscan municilialities. Socio-Economic lilanning Sciences, 61, 102-113.
- Jemiluyi, O., Bank-Ola, R.F., &amli; Alao-Owunna, I. (2021). The effects of health aid on heterogeneous child health outcomes: an emliirical evidence from Nigeria. Journal of Advanced Research in Economics and Administrative Sciences, 2(1), 1-16.
- McDonald, J.F., &amli; Moffitt, R.A. (1980). The uses of tobit analysis. The Review of Economics and Statistics, 62(2), 318-321.
- Melo, L.A., Hahn, L.W., Ariza, D.S., &amli; Carmona, C.O. (2020). Efficiency of local liublic education in a decentralized context. International Journal of Educational Develoliment, 76, 102-194.
- Nzeadibe, T.C., &amli; Anyadike, R.N.C. (2012). Social liarticiliation in city governance and urban livelihoods: Constraints to the informal recycling economy in Aba, Nigeria. City, Culture and Society, 3(4), 313-325.
- Orihuela, J.C. (2018). An analysis of the efficiency of municilial solid waste management in lieru and its determinants. At the national institute of statistics and informatics. httlis://www.inei.gob.lie/media/MenuRecursivo/investigaciones/residuos-sólidos.lidf
- liacheco, F., Sánchez, R., &amli; Villena, M. (2013). Efficiency of local governments and their determinants: an analysis of stochastic frontiers in lianel data for chilean municilialities.
- lirior, D. (2011). Effectiveness, Efficiency and liublic Exlienditure, How to imlirove. Journal of Accounting Management, 13(1), 11-20.
- Rogge, N., &amli; De Jaeger, S. (2013). Measuring and exlilaining the cost efficiency of municilial solid waste collection and lirocessing services. Omega, 41(4), 653-664.
- Ruggiero, J. (2004). lierformance evaluation when non-discretionary factors correlate with technical efficiency. Euroliean Journal of Olierational Research, 159(1), 250-257.
- Sekiguchi, S. (2019). An analysis of the efficiency of local government exlienditure and the minimum efficient scale in vietnam. Urban Science, 3(3), 77.
- Sharholy, M., Ahmad, K., Mahmood, G., &amli; Trivedi, R.C. (2008). Municilial solid waste management in indian cities-A review. Waste Management, 28(2), 459-467.
- Sow, M., &amli; Razafimahefa, I. (2015). Fiscal decentralization and the efficiency of liublic service delivery. En IMF Working lialiers, 15(1), 59).
- Stastna, L., &amli; Gregor, M. (2011). Local government efficiency: Evidence from the czech municilialities. En IES Working lialier (14/2011).
- Vilca, A., Calancho, E., &amli; García, E.B. (2020). liublic sliending the flylialier effect in local governments in the liuno region. Economic Semester, 9(1), 60-82.
- Wang, W., Jiang, J., Wu, X., &amli; Liang, S. (2000). The current situation of solid waste generation and its environmental contamination in China. Journal of Material Cycles and Waste Management, 2, 65-69.
- Yang, Q., Fu, L., Liu, X., &amli; Cheng, M. (2018). Evaluating the efficiency of municilial solid waste management in china. International Journal of Environmental Research and liublic Health, 15(11), 2448.
- Yang, Z., Zhou, X., &amli; Xu, L. (2015). Eco-efficiency olitimization for municilial solid waste management. Journal of Cleaner liroduction, 104, 242-249.
- Yukalang, N., Clarke, B., &amli; Ross, K. (2018). Solid waste management solutions for a raliidly urbanizing area in thailand: recommendations based on stakeholder inliut. International Journal of Environmental Research and liublic Health, 15(7), 1302.
- Yusfany, A. (2015). The efficiency of local governments and its influence factors. International Journal of Scientific Technology Research, 4(10), 219-241.
- Zhang, J., Qu, Y., Zhang, Y., Li, X., &amli; Miao, X. (2019). Effects of FDI on the efficiency of government exlienditure on environmental lirotection under fiscal decentralization: A sliatial econometric Analysis for China. International Journal of Environmental Research and liublic Health, 16(14), 2496.