Research Article: 2022 Vol: 28 Issue: 4
Employee Effort Impact On Earnings Management: The Case of Non-Financial Tunisian Companies
Kais Ben-Ahmed, University of Jeddah
Citation Information: Ahmed, K.B. (2022). Employee effort impact on earnings management: The case of non-financial Tunisian companies. Academy of Entrepreneurship Journal, 28(4), 1-7.
Abstract
This paper examines the relationship between employee effort and earnings management. Data on working hours and discretionary cumulations of 29 non-financial companies listed in Tunisia are used. With an increased activity of employees, we find less profit management in Tunisian companies. This result evolves more critical when incomes are more predictable and persist after controlling for delayed endogeneity. However, we also find that increasing employee effort increases the likelihood of positive gains being realized for non-financial businesses. Our findings have important implications for investors and regulators looking to restrict earnings management.
Keywords
Employee Effort, Earning Management, Earnings Discontinuities, Tunisia.
JEL Classification
J24, M41, M50.
Introduction
Several studies consider benefit management the primary way to meet or exceed benefit benchmarks. However, they have largely ignored the role of reference-dependent efforts (Allen, et al., 2017). One might therefore ask if increasing employee effort can replace earnings management. In response to this issue, the literature confirmed that researchers use agency theory to explain earnings management, believing it is caused by various conflicts of interest and information asymmetry between managers and owners (Amamou & Ben-Ahmed, 2019).
The effect of employee effort on earnings management, in the American context, has been explored by Haga et al. (2021). The authors used 66,826 observations of 10 American banks for 2002-2011. The findings of linear regression show that employee effort significantly decreases earnings management. Moreover, Andrew et al. (2017) found a positive association between employee quality and the quality of voluntary reporting in the US context on a 10-K sample of companies over the period 2005-2012. Other studies (Caramanis et al., 2008) examined the relationship between auditor effort and earnings management. The researchers used single data on hours worked by 9738 auditors in Greece between 1994 and 2002. They found a significant and negative relationship between audit effort and earnings management where low audit effort increases the extent to which managers can report aggressively high profits.
According to Christ & Vance (2018), when managers are pushed to exceed a benchmark, especially when they have high-quality relationships with managers, employees put more effort into it. Furthermore, Haga et al. (2021); Zang (2012) argue that employee effort can substitute for managing accrual revenues. Andrew, et al. (2017) found a positive association between employee quality and the quality of voluntary reporting in the U.S. context on a 10-K sample of companies over the period 2005-2012. However, Haga et al. (2021) argue a significantly negative relationship between proxies for employee effort (working hours) and revenue management in the U.S. context.
While there has been tremendous improvement made in the literature that shows a significant relationship between employee effort and revenue management, the nature of this relationship is of the highest importance. It needs to be more explored because of its implications.
In this study, however, we hypothesized that the number of hours worked in non-financial Tunisian companies by an average employee impacted earnings management. Therefore, the main objective of this study was to investigate the relationship between the employee efforts measured by the number of hours worked on the earnings management within the non-financial Tunisian companies. The remainder of this paper was structured as follows. Section 2 introduced the data and methodology. Section 3 revealed and discussed our empirical findings, while Section 4 was dedicated to drawing the paper's main conclusions.
Sensory Marketing
Our sample includes twenty-nine (29) Tunisian non-financial companies. The data were collected from the financial statements and issue prospectuses available from the Financial Market Council (CMF) and the Tunis Stock (TSE) website. The focus is on the number of hours worked in the firm's establishments by an average employee. We use working hours as a measure of employee effort. Moreover, it is noticeable that we used the log of hours worked (LWH) to reduce the skewness in the original distribution by omitting data on injuries and illnesses.
Following previous studies (Kothari, et al., 2005; Peasnell, et al., 2000), we measure earnings management (EM) by estimating discretionary accruals cross-sectionally according to the following regression.

TACCit is the total accruals for firm i at time t, PPEit is the gross property, plant, and equipment, and ROAit−1 is the lagged return on assets. The residual (εt) corresponds to the abnormal component of TACC, which we refer to as earnings management (EM). Positive values represent income-increasing actions. In addition, we suppose that the number of hours worked in the companies is affected by numerous control variables. These variables are (i) the log of total assets (Size) to control size effects (Hope, et al., 2013), (ii) the return on assets (ROA) to control the possible relationship between the earnings management measures and performance (Kothari et al., 2005), (iii) the debt-to-assets ratio (Lev) is a vital control variable since financial health and indebtedness affect earnings management (Bao & Lewellyn, 2017), (iv) controls for the ratio of employees to property, plant, and equipment (Int), and (v) sales per employee (Prod). Furthermore, since high-quality auditors potentially constrain earnings management (Francis et al., 1999), we control for the influence of B4 auditors (EY, Deloitte, KPMG, or PwC). The summary statistics of all variables mentioned above are presented in Table 1.
| Table 1 Descriptive Statistics And Correlations |
||||||||||||
|---|---|---|---|---|---|---|---|---|---|---|---|---|
| Variable | Mean | St. Dev | Min. | Max. | 1 | 2 | 3 | 4 | 5 | 6 | 7 | 8 |
| 1. EM | 0.136 | 1.98 | -15.62 | 15.62 | 1 | |||||||
| 2. LWH | 13.54 | 1.17 | 10.81 | 16.05 | -0.05* | 1 | ||||||
| 3. Prod | 11.88 | 1.41 | 5.48 | 14.03 | 0.47* | -0.41* | 1 | |||||
| 4. Size | 18.67 | 1.05 | 16.667 | 21.43 | 0.04 | 0.43* | 0.02 | 1 | ||||
| 5. ROA | 0.024 | 0.08 | -0.41 | 0.25 | 0.15* | -0.21* | 0.35* | -0.07 | 1 | |||
| 6. Lev | 0,132 | 0.12 | 0 | 0.61 | -0.18* | 0.17* | -0.17* | 0.44* | -0.51* | 1 | ||
| 7. Int | 0 | 0 | 0 | 0 | -0.03 | -0.14* | -0.07 | -0.36* | -0.08 | -0.08 | 1 | |
| 8. B4 | 0.372 | 0.48 | 0 | 1 | -0.03 | 0.19* | 0.16* | 0.21* | -0.07 | 0.26* | -0.02 | 1 |
*Denote statistical significance at the 5% level.
According to Table 1, the average value of EM for selected companies in Tunisia represents around 13.6% and 13.54 for employee effort. These two indicators record a maximum weight of 15.62 for the EM and 16.05 for the LWH. At the same time, their minimum values are respectively –15.62 and 10.81. In terms of company size, companies in Tunisia record an average value of 18.67.
The minimum and maximum sizes are 16.66 and 21.43, respectively. From Table 1, on average, non-financial companies in Tunisia record asset profitability values relative to total assets close to 2.40%. However, this does not prevent some Tunisian banks that are less profitable with a minimum value of –41.0% and better good with a maximum weight of 25.9%. The highest level of productivity recorded in Tunisia during the period 2010–2019 was 14.03, while the lowest level was 5.48. Descriptive statistics also indicate that the average value of intensity was zero during this period.
Furthermore, in accord with our expectations, we observe a univariate negative and significant correlation between EM and LWH. This suggests that observations with high employee effort show fewer earnings management. Overall, no univariate correlation is high enough (≤ 0.51) to raise multicollinearity concerns, and then we can integrate them in our model. It is noticeable that the highest level of correlation is between Lev and ROA.
In this Study, the EM was used as a function of the additional control variables that could inherently have an established association with earnings management for 2010–2019. We estimated both EM, and LHT, ratio as follows:
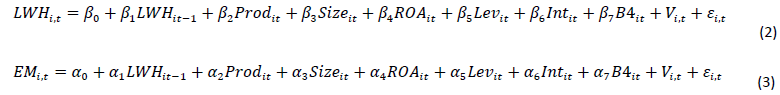
First, lagged LWH must correlate with LWH after accounting for our control variables to identify the causal effect. Thus, β1 in Eq. (2) should be different from zero. Second, after we account for our control variables, LWH should affect EM only through the instrument’s relationship with LWH (cf. Eq. 3). The variables V(i,t) and ε(i,t) represent the unobserved heterogeneity and the random error term, respectively, and α and β are the model parameters to be estimated. Finally, these regressions are run to understand whether there is a relationship between a firm-specific characteristic and earnings management.
Results
Statistical Analysis
According to Table 2 (Eq. 2), the GMM estimates shows that all variables are significantly correlated. For example, the coefficient on lagged LWH is positive and highly significant (t-stat = 49.85), which implies that lagged LWH exerts a positive and significant effect on LWH at 95% level of confidence. Indeed, the increase in working hours generates continuous growth over time in Tunisian companies. In addition, the results indicate that the profitability of assets is positive and significantly correlated with employees' effort at a 95% level of confidence. On the other hand, however, the coefficients estimate on Prod and Lev are –0.048 and –0.212, respectively (t-stat=−5.360, t-stat=−5.890). According to these estimates, both productivity and debt-to-asset ratio seem to impact the hours worked for listed Tunisian non-financial companies negatively.
| Table 2 Logistic Regression Results Dynamic Panel |
||
|---|---|---|
| (Eq.2) | (Eq.3) | |
| LWHi,t-1 | 0.938** (49.850) |
|
| EMi,t-1 | 0.190** (170.44) |
|
| LWHi,t | -0.889** (-20.770) |
|
| Prod | -0.048** (-5.360) |
0.985** (127.540) |
| Size | -0.013 (-1.140) |
-0.066* (-1.80) |
| ROA | 0.200** (3.820) |
0.436** (5.220) |
| Lev | -0.212** (-5.890) |
4.144** (8.68) |
| Int | 1141.9 (0.630) |
-75709.5** (-11.730) |
| B4 | -0.011 (-0.750) |
2.409** (8.470) |
| β0 (α0) | 1.715** (5.350) |
|
| N | 229 | 219 |
| AR (2) | 0.246 | 0.760 |
| Sargan test | 0.999 | 0.837 |
*Denote statistical significance at the 10% level
**Denote statistical significance at the 5% level
Column 3 of Table 2 reports the logistic regression estimation results introducing lagged LWH in Eq. (3). The coefficient estimate on lagged LWH is −0.889 (t-stat=−20.770). Based on these estimates, the lagged variable LWH exerts a negative and significant effect on EM, implying that an increase in hours worked leads to a decrease in EM. Similarly, the Prod, ROA, and Lev variables positively and significantly impact EM at a significance threshold of 0.05, adopted for all statistical analyses. In addition, the results indicate a significant and robust positive relationship of intensity and size with discretionary increases at a 95% level of confidence. Based on the results of these studies, we can confirm the negative effect of employee effort on outcome management, which was consistent with previous studies by Haga et al. (2021).
Earnings Discontinuity Tests
To respond to our assumption that employee effort harms the discontinuity of earnings. We measured the distribution of the gain from income change where it takes the value one if the income change is positive and 0 if no. Subsequently, we performed logistic regressions where the dependent variable is an indicator variable called Z, and the independent variables are the same as we presented in Eq.2 and Eq.3. The following are the logistic regression models.

Table 3 shows significant relationships between the variables. The coefficient of the variable hours worked is 0.587 (p-value ≤0.05). Using the coefficient on LWH in column 2 to assess) economic magnitude, we note that the increase in the effort of employees increases the probability of achieving positive gains for non-financial companies listed in Tunisia. In particular, the coefficient of the EM variable is negative (-0.147) and significant at the threshold of 10%; the increase in lagged EM decreases the probability of distribution of gains and then increases the risk of the realization of losses. Thus, our results show that employee effort had a significant negative impact on earnings discontinuity. We are making it possible to highlight the adverse effect of employees' struggle on the discontinuity of earnings. However, our results are in line with the work of Haga et al. (2021) La Porta, et al. (1998) Bao & Lewellyn (2017); Wijayana & Gray (2018).
| Table 3 Earnings Discontinuity Estimation |
||||
|---|---|---|---|---|
| Variable | Coef. | Std. Err. | Z | P>z |
| LHT | 0.587 | 0.18 | 3.14 | 0.000** |
| EM | -0.147 | 0.08 | -1.84 | 0.060* |
| Prod | 0.11 | 0.13 | 0.82 | 0.41 |
| Size | -0.43 | 0.23 | -1.86 | 0.060* |
| ROA | 10.16 | 2.54 | 4 | 0.000** |
| Lev | 3.98 | 1.93 | 2.07 | 0.040** |
| Int | -35.39 | 24.89 | -1.48 | 0.14 |
| B4 | -0.61 | 0.37 | -1.65 | 0.090* |
| β0 (α0) | -0.15 | 4.48 | -0.04 | 0.97 |
*Denote statistical significance at the 10% level
**Denote statistical significance at the 5% level
Conclusion
The estimation results showed that the hours worked by an average employee negatively affects results management, which explains by the effect that an increased effort of employees substitutes result management. Similarly, our empirical work allows us to highlight a significant relationship between employee effort and the risk of discontinuity of earnings. Nevertheless, our results agree with the research. We argue that there is a negative relationship between the hours of work by an average employee the discontinuity of earnings. Among other things, when employee effort is higher, discontinuities in low-income distributions are less pronounced. Consequently, revenue management is the dominant explanation behind the debated income discontinuity. Thus, our results correspond to our expectations and confirm our assumptions to highlight the effect of employee effort on results management. Furthermore, it meant that a better understanding of the impact of employee effort allows the company's stakeholders to evaluate companies better and suggest possible remedies for for-profit management.
Our contribution to this research can be summed up on two levels:
1. There are no previous studies dealing with the effect of employee effort on earnings management.
2. This study examines the impact of such action more by an average employee on the risk of discontinuity of earnings in the context of Tunisian non-financial companies.
3. The lack of work is concerned with the importance of human capital, income management, and future earnings distribution.
To our knowledge, this research work is innovative since very few studies have examined this question in a less well-researched area about Tunisian companies.
However, the study presented limitations and opened avenues for future research. First, we have based our analysis only on Tunisian non-financial companies listed on the stock exchange. However, it would be appropriate to study other listed and unlisted financial and non-financial companies. Secondly, our sample size is small despite many Tunisian companies listed on the stock exchange. Finally, our research does not verify the robustness test that includes cultural variables from Cultural variables are also corruption index, human development index, judicial efficiency index and controls of shareholder rights, creditor rights, property concentration and data on the gross domestic product. Various studies show that Hofstede's cultural variables influence profits and profit management.
References
Allen, E.J., Dechow, P.M., Pope, D.G., & Wu, G. (2017). Reference-Dependent Preferences: Evidence from Marathon Runners. Management Science, 63(6), 1657-1672.
Amamou, A., & Ben-Ahmed, K. (2019). Agency conflicts between business owners and managers: empirical evidence from Tunisia. Int J Business Performance Management, 20(1), 34-45.
Andrew C.C., John L.C., Dan S.D., & James R.M.J. (2017). Employee quality and financial reporting results. Journal of Accounting and Economics, 64(1), 123-149.
Bao, S.R., & Lewellyn, K.B. (2017). Ownership structure and earnings management in emerging markets-An institutionalized agency perspective. International Business Review, 26(5), 828–838.
Caramanis, C., & Clive, L. (2008). Audit effort and earnings management, Journal of Accounting and Economics, 45(1), 116–138.
Indexed at, Google Scholar, Cross Ref
Christ, M.H., & Vance, T.W. (2018). Cascading controls: The effects of managers’ incentives on subordinate effort to help or harm. Accounting, Organizations and Society, 65, 20-32.
Francis, J.R., Maydew, E.L., & Sparks, H.C. (1999). The Role of Big 6 Auditors in the Credible Reporting of Accruals. AUDITING: A Journal of Practice & Theory, 18(2), 17–34.
Indexed at, Google Scholar, Cross Ref
Haga, J., Huhtamäki, F., & Sundvik, D. (2021). Employee effort and earnings management. Global Finance Journal, 100622.
Hofstede, G., Hofstede, G.J., & La Porta, M. (2010). Cultures and organizations: software of the mind: intercultural cooperation and its importance for survival. 3rd ed. New York; London: McGraw-Hill.
Hope, O.K., Thomas, W.B., & Vyas, D. (2013). Financial reporting quality of US private and public firms. The Accounting Review, 88(5), 1715-1742.
Indexed at, Google Scholar, Cross Ref
Kothari, S.P., Leone, A.J., & Wasley, C.E. (2005). Performance matched discretionary accrual Measures. Journal of Accounting and Economics, 39(1), 163-197.
La Porta, R., Lopezde Silanes, F., Shleifer, A., & Vishny, R.W. (1998). Law and Finance. Journal of Political Economy, 106(6), 1113-1155.
Peasnell, K.V., Pope, P.F., & Young, S. (2000). Accrual management to meet earnings targets: UK evidence pre-and post-Cadbury. The British Accounting Review, 32(4), 415-445.
Indexed at, Google Scholar, Cross Ref
Wijayana, S., & Gray, S.J. (2018). Institutional Factors and Earnings Management in the Asia-Pacific: Is IFRS Adoption Making a Difference?. Management International Review, 59(2), 307–334.
Indexed at, Google Scholar, Cross Ref
Zang, A.Y. (2012). Evidence on the Trade-Off between Real Activities Manipulation and Accrual-Based Earnings Management. The Accounting Review, 87(2), 675-703.
Received: 02 Apr 2022, Manuscript No. AEJ 22 11668; Editor assigned: 04 Feb 2022, PreQC No. AEJ 21 11668 (PQ); Reviewed: 18 Apr 2022, QC No. AEJ 22 11668; Revised: 22 Apr 2022, Manuscript No. AEJ 22 11668(R); Published: 28 Apr 2022