Research Article: 2022 Vol: 28 Issue: 1
Environmental Management of Manufacturing Companies in Indonesia: Examining the Influence of Corporate Social Responsibility on Company Profitability
Desy Maryani, Universitas Dehasen Bengkulu
Citation Information: Maryani, D. (2021). Environmental management of manufacturing companies in Indonesia: examining the influence of corporate social responsibility on company profitability. Academy of Entrepreneurship Journal, 28(1), 1-15.
Abstract
This study aims to analyze (1) the effect of corporate social responsibility (CSR) disclosure on Return on Asset (ROA), (2) the effect of corporate social responsibility (CSR) disclosure on Return on Equity (ROE), (3) the effect of corporate social disclosure. Responsibility (CSR) to Earning Per Share (EPS) and (4) The effect of corporate social responsibility (CSR) disclosure on Net Profit Margin (NPM) in manufacturing companies listed on the Indonesia Stock Exchange for the period 2018-2019. Corporate Social Responsibility is measured using the CSR index based on the 4th generation Global Reporting Initiative (GRI) (G4). Profitability is measured by Return on Asset (ROA), Return on Equity (ROE), Earning Per Share (EPS) and Net Profit Margin (NPM). The population used in this study are all manufacturing companies listed on the Indonesia Stock Exchange in the 2018-2019 period. The research sample used is a manufacturing company that discloses CSR reports in 2018 and 2019 using a purposive sampling method. There were 78 companies in 2018 and 81 companies in 2019 that met the criteria as research samples. The analytical tool used to test the hypothesis is Partial Least Square (PLS). The results showed that Corporate Social Responsibility (CSR) had a positive and significant effect on profitability by using the proxies for Net Profit Margin (NPM), while using the proxies for Return on Asset (ROA), Return on Equity (ROE) and Earning Per Share (EPS), Corporate Social Responsibility (CSR) has no effect on profitability.
Keywords
Corporate Social Responsibility, Profitability, Return on Assets, Return on Equity, Earning Per Share, Net Profit Margin.
Introduction
Corporate Social Responsibility (CSR) practices carried out by companies have changed from time to time. According to Godfrey et al. (2009), the focus of companies is growing after the industrial revolution, many companies are not only focusing themselves as organizations that are only looking for profit. In Indonesia, many companies began to practice CSR in the late 1990s, which began with the issuance of laws. Law No. 40 of 2007 concerning environmental management article 41 paragraph (1), with the enactment of this law, it does not require companies to carry out CSR activities, but CSR activities carried out are still limited because they are voluntary. However, at least the law opens up hopes that in the future it can prevent companies from carrying out various kinds of business activities that can pollute the environment.
The government issued a new regulation on CSR, namely Law No. 40 of 2007. The law states that every company carrying out its business activities in the sector and / or related to natural resources is obliged to carry out social and environmental responsibility. Anyone who is a company that does not fulfill these obligations will be subject to sanctions in accordance with the provisions of the applicable laws. With the enactment of these regulations, every company that carries out business activities in the fields and / or related to the use of natural resources is obliged to carry out CSR activities. With the enactment of this new regulation, CSR activities are now no longer only voluntary, but have become an obligation for companies.
People today are smarter in choosing each product they will buy / consume. At this time, people tend to choose products that are produced or produced by companies that care about the environment and society, or companies that implement CSR. A survey conducted by the Booth-Harris Trust Monitor in 2001 in (Servaes & Tamayo, 2013) states that the majority of consumers will leave a product from a company that has a bad image or has a negative image in society. There are many benefits obtained by companies by implementing social responsibility or corporate social responsibility, among others, the products produced are increasingly in demand by consumers and companies are favored by investors. In addition, corporate social responsibility can be used as a marketing tool for a new model for companies if it is carried out in a long or sustainable manner (Peloza & Shang, 2011). To carry out various CSR activities means that the company has to spend a number of costs and costs will eventually become a burden that must be borne by the company so that it reduces revenue and causes the company's profit level to decrease. However, on the good side, by carrying out CSR activities, the company's image will be better in the eyes of consumers, so that consumer loyalty will be even higher (Hadi, 2009).
From the description, it can provide evidence that there is a relationship between the practice of CSR activities and the company's strategy in increasing profitability for the company. By implementing CSR practices, this indirectly becomes one of the promotional activities carried out by the company to the public and investors. The company will attract the hearts of consumers and investors with activities as a form of responsibility for the environment. In addition, the company's CSR activities can be recognized as a company's long-term investment in developing products or minimizing production costs.
Literature Review
Corporate Social Responsibility
The definition of CSR is very diverse. According to Susanto (2007) CSR is a commitment of business people to uphold business ethics in operating, contribute to sustainable development, and strive to support the improvement of living standards and welfare for workers, including improving the quality of life for the surrounding community. It can be said that CSR is an action taken by a company as a sense of corporate responsibility towards the social and surrounding environment where the company is located (Mardikanto, 2014). CSR is a phenomenon and a strategy that companies use for the needs and interests of their stakeholders. CSR began in an era where awareness of long-term corporate sustainability was more important than just company profitability. In running its business, companies must have a strategy and priorities. The company's main priority is the existence and profitability in the long term. Long-term profit can be obtained if the company's existence can be beneficial and supported by stakeholders.
According to Suparnyo (2010), the scope of corporate responsibility is in the triple bottom line model, namely people, planet, and profit. Based on this concept, sustainable development is closely related to CSR which includes 3 policies, namely economic development, social development, and environmental protection. The purpose of CSR is to make the company's business activities and business culture sustainable in the following 3 aspects. The first is economic aspects, including an understanding of the economic impacts caused by business activities. The economic scope of the sustainability agenda must pay more attention to the direct and indirect consequences caused by the company's business activities at the company's operating location and for its stakeholders. The second is social aspect, paying attention to the social aspect means being directly responsible for the social impacts resulting from the company's operations. The social aspects include employees, communists within the company, consumers and stakeholders. The third is environmental and ecological aspects, the impacts that occur on the environment for the company's operations are generally negative, for example the excessive exploitation of natural resources, sometimes even resulting in natural disasters, pollution, climate change, destruction of forest areas, and others.
Increasing environmental performance will have a positive impact on these companies, using materials that are not excessive during the production process can minimize excessive pollution, but also reduce operating costs and will be preferred by consumers because they care about the environment (Wibisono, 2007). Corporate social responsibility is disclosed in a report called Sustainability Reporting, which is a report on economic, environmental and social policies, organizational performance and products produced in the context of sustainable development.
Theoretical Framework and Hypothesis Formulation
The disclosure of corporate social responsibility (CSR) can be measured using the Global Reporting Initiative (GRI) index creating the 4th (G4) which can measure 91 performance indicators in 3 categories (economic, environmental and social). The greater the CSR disclosure index in a company, the higher the CSR disclosure made by the company. The calculation of the CSR index can be calculated based on the description of CSR disclosure in the annual report and / or sustainability report of each listed company, by providing a value for how many indicators are disclosed from 91 indicators of CSR disclosure.
Corporate Social Responsibility (CSR) is a concept that an organization, especially a company, has a responsibility to its stakeholders, namely consumers, employees, shareholders, communities and the environment in all aspects of company operations. Basically, the company is required to be able to be responsible for every activity carried out to its stakeholders. Corporate Social Responsibility (CSR) is a form of corporate business commitment to act ethically, in accordance with applicable regulations, and contribute to economic development, as well as improve the quality of life of workers and society in general (Lanis & Richardson, 2013).
The main objective of the company is to obtain high profits and increase company value. The company's value will be guaranteed to grow in a sustainable manner if the company pays attention to the economic, social and environmental dimensions because sustainability is a balance between economic, environmental and community interests (Haninun et al., 2018). This dimension is contained in the implementation of Corporate Social Responsibility by the company as a form of responsibility and concern for the environment around the company (Maryanti & Fithri, 2017).
Corporate social responsibility should not only be in the form of profit maximizing action for the benefit of shareholders (stakeholders), but more broadly that the welfare that can be created by a company is not limited to the interests of shareholders, but also for the interests of stakeholders, namely all related parties, or claims against the company (Clarissa & Rasmini, 2018). They are suppliers, customers, governments, local communities, investors, employees, political groups and trade associations. Like shareholders who have rights to the actions taken by company management, stakeholders also have rights to the company (Warren et al., 2014; Zaki et al., 2020; Andriansyah et al., 2021). Thus, the hypothesis can be formulated in this study is that corporate Social Responsibility (Heal, 2005; Lako, 2010) has a positive effect on company profitability (Chen et al., 2015).
Research Methods
Research Variable
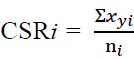
CSR disclosure is guided by the fourth generation Global Reporting Initiative (GRI) or called G4 with 91 CSR disclosure indexes. Information on Corporate Social Responsibility based on GRI consists of 3 focus disclosures, namely social, economic and environmental with the formula:
Information:
CSRi : Broad index of CSR disclosure.
 : Value 1 if the item is disclosed; value 0 if item y is not disclosed.
ni : Number of CSR Items ≤ 91.
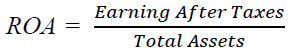
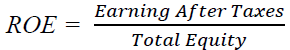
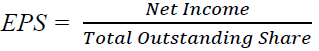
The dependent variable used is Return on Assets (ROA) with the formula (net income / total assets), Return on Equity (ROE) with the formula (net income / total equity), Earning Per Share (EPS) with the formula (net income / total outstanding shares), and Net Profit Margin (NPM) with the formula (net profit / net sales). In addition to the independent and dependent variables, this study uses control variables, where the control variable is a variable that can be controlled so that the influence of the independent variable on the dependent is not influenced by external factors that are not examined. The control variable used is company size by looking at total assets and leverage with the formula (total debt / total equity).
For profitability, in general, every company aims to make a profit or profit. The company management is required to be able to achieve the targets that have been planned. According to Kasmir (2012) the definition of the profitability ratio is a ratio to assess a company's ability to seek profit. This ratio also provides a measure of the level of management effectiveness of a company. This is indicated by the profit generated from sales and investment income. The point is that the use of this ratio shows the efficiency of the company. The higher the profitability of a company, the greater the company's ability to use its internal sources of funds in the form of profits from company operations.
In terms of Return on Asset (ROA), it shows the company's ability to use all its assets to generate profit after tax. This ratio is important for management to evaluate the effectiveness and efficiency of company management in managing all company assets. The greater the ROA, it means that the more efficient use of the company's assets or in other words, with the same number of assets, a greater profit can be generated, and vice versa. ROA can be calculated using the following formula:
Moreover, Return on Equity (ROE) shows the company's ability to generate profit after tax using the company's own capital. This ratio is important for shareholders to determine the effectiveness and efficiency of the company's own capital management. The higher this ratio, the more efficient the use of own capital is carried out by the company management. ROE can be calculated using the following formula:
The ratio per share (Earning Per Share) or also known as the ratio of book value, is a ratio to measure the success of management in achieving profits for shareholders. A low ratio means that management has not succeeded in satisfying shareholders, on the contrary, with a high ratio, the welfare of shareholders increases in another sense, that the rate of return is high. The formula is as follows:
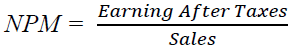
Furthermore, Net Profit Margin measures the company's ability to generate net income from sales made by the company. This ratio reflects the efficiency of all parts, namely production, personnel, marketing, and finance in the company. NPM can be calculated using the following formula:
Sample Determination
The sample selection in this study was carried out using purposive sampling method in order to obtain a representative sample according to the specified criteria. The criteria for selecting the sample to be studied are registered as a manufacturing company and publishing financial reports and annual reports during the 2018-2019 period and companies that publish complete data in 2018-2019 relating to company value variables, investment decisions, funding decisions and dividend policies.
Technique of Analysis
In this study, data analysis used the Partial Least Square (PLS) approach. PLS is a component or variant based Structural Equation Modeling (SEM) equation model. According to Ghozali (2008), PLS is an alternative approach that shifts from a covariance-based to variant-based SEM approach. The parameter estimates obtained by PLS can be categorized into three. First, is the weight estimate used to create the latent variable score. Second, it reflects the path estimate that connects latent variables and between latent variables and their indicators (loading). Third, it relates to the means and location parameters (regression constant values) for indicators and latent variables. To obtain these three estimates, PLS uses a 3-stage iteration process and each iteration stage produces an estimate. The first stage is producing a weight estimate, the second stage is producing an estimate for the inner model and outer model, and the third stage is producing an estimate of means and location (Ghozali, 2008).
Convergent model validity of the measurement model with the reflective indicator model is assessed based on the correlation between the item score / component score with the construct score calculated by PLS. Reflective measure is said to be high if it correlates more than 0.70 with the construct to be measured. However, for research in the early stages of developing a measurement scale the loading value of 0.5 to 0.60 is considered sufficient (Ghozali, 2008). Discriminant validity of the measurement model with reflective indicators is assessed based on the cross-loading measurement with the construct. If the construct correlation with the item of measure is greater than the measure of the other constructs, it will show that the latent construct predicts the size of the block better than the other block sizes.
The inner model (inner relation, structural model and substantive theory) describes the relationship between latent variables based on substantive theory. The structural model was evaluated using the R-square for the dependent construct, the Stone-Geisser Q-square test for predictive relevance and the t test and the significance of the structural path parameter coefficients. In assessing the model with PLS, it starts by looking at the R-square for each dependent latent variable. The interpretation is the same as the interpretation in regression. Changes in the R-square value can be used to assess the effect of certain independent latent variables on the dependent latent variable whether it has a substantive effect (Ghozali, 2011). Besides looking at the R-square value, the PLS model is also evaluated by looking at the predictive relevance Q-square for the constructive model. Q-square measures how well the observed value is generated by the model and also its parameter estimates.
Hypothesis testing in this study uses the Partial Least Square (PLS) method. PLS is an alternative method of analysis with variance-based Structural Equation Modeling (SEM). Hypothesis testing is used to explain the direction of the relationship between the independent variable and the dependent variable. This test is carried out by means of path analysis on the model that has been created. In general, explanatory research method is a method approach that uses PLS. This is because in this method there is a hypothesis testing. Testing the hypothesis can be seen from the t-statistic value and the probability value. To test the hypothesis using statistical values, for alpha 5% the t-statistic value used is 1.96. So that the criteria for acceptance / rejection of the hypothesis are that Ha is accepted and H0 is rejected when the t-statistic is> 1.96. To reject / accept the hypothesis using probability, Ha is accepted if the p value is <0.05.
Results
Descriptive Statistics
The sample selection in this study was determined using the purposive sampling method with several provisions, namely related to the availability of reports and completeness related to the variables tested in the 2018 and 2019 periods. From these criteria, a sample of 78 companies was obtained in 2018 and 81 companies in Indonesia in 2019.
In this section, the data for each variable that has been processed will be described from the minimum value, maximum value, average value (mean) and standard deviation of each variable.
From the descriptive statistical test of Table 1, it is known that the average value of the corporate social responsibility (CSR) variable is 0.0865 or 8.67% with a standard deviation value of 0.1521, which means that the data variation is very small. The lowest value of the CSR variable is 0.0201 (2.01%) and the highest value is 0.8096 (80.9%). The average value of 0.0865 indicates that the disclosure of CSR by manufacturing companies listed on the IDX is 8.65%.
| Table 1 Descriptive Statistics | |||||
| Variable | N | Minimum | Maximum | Mean | Std. Dev |
| CSR | 159 | 0.0201 | 0.8096 | 0.0865 | 0.1521 |
| ROA | 159 | 0.0002 | 0.1812 | 0.0198 | 0.5243 |
| ROE | 159 | 0.0003 | 0.2497 | 0.0384 | 0.0482 |
| EPS | 159 | 0.7 | 3770 | 62,011,348 | 16,665 |
| NPM | 159 | 0.0013 | 0.2582 | 0.0739 | 3.9101 |
| SIZE | 159 | 9.8671 | 14.412 | 12.3476 | 0.7621 |
| DER | 159 | 0.0557 | 8.0629 | 0.7128 | 1.1732 |
Discriminant Validity and Inner Model Evaluation
Discriminant validity is used to ensure that each concept of a latent variable is different from other variables. The model has good discriminant validity if each loading value of each indicator of a latent variable has the greatest loading value with other loading values against other latent variables. The results of discriminant validity testing were obtained as follows:
To be able to analyze discriminant validity, that is to see the loading value of latent constructs and the loading value of other constructs. From Table 2, it can be seen that the latent construct loading value of each indicator shows better than the loading value of other constructs, in other words all indicators meet discriminant validity.
| Table 2 Value Discriminant Validity (Cross Loading) | |||||||
| CSRI | ROA | ROE | EPS | NPM | DER | SIZE | |
| CSRI | 1 | 0,172 | 0,112 | 0,131 | 0,334 | -0,072 | 0,521 |
| ROA | 0,172 | 1 | 0,852 | 0,253 | 0,697 | -0,195 | 0,098 |
| ROE | 0,112 | 0,852 | 1 | 0,371 | 0,439 | 0,261 | 0,087 |
| EPS | 0,131 | 0,253 | 0,371 | 1 | 0,133 | 0,174 | 0,402 |
| NPM | 0,334 | 0,697 | 0,439 | 0,133 | 1 | -0,295 | 0,116 |
| DER | -0,072 | -0,195 | 0,261 | 0,174 | -0,295 | 1 | -0,029 |
| SIZE | 0,521 | 0,098 | 0,087 | 0,402 | 0,116 | -0,029 | 1 |
For Inner Model Evaluation, according to Ghozali (2011) the coefficient of determination essentially measures how far a model is capable of explaining the variation in the dependent variable. Below is presented the r-square value of the dependent variable, where this value shows how much the ability of the independent variable to explain the dependent variable.
Table 3 shows the value of 0.192 for the construct of earnings per share, which means that the CSRI variables, debt equity ratio, and company size are able to explain the variance of earnings per share by 19.2%. Likewise, the value of 0.159 obtained by the net profit margin construct means that the CSRI variable, debt equity ratio, and company size are able to explain the variance of the net profit margin by 15.9%. The value of 0.071 obtained by the return on assets construct shows that the CSRI variable, debt equity ratio, and company size are able to explain the variance of return on assets by 7.1%. Finally, 0.086 is the value obtained by the return on equity construct, which means that the CSRI variable, debt equity ratio, and company size are able to explain the variance of return on equity by 8.6%.
| Table 3 R Square | |
| Dependent Variable | R Square |
| Return on Assets | 0.071 |
| Return on Equity | 0.086 |
| Earnings Per Share | 0.192 |
| Net Profit Margin | 0.159 |
Hypothesis Testing
Hypothesis testing is done by looking at the probability value and t-statistic. For probability values, the p-value with an alpha of 5% is less than 0.05. The t-table value for 5% alpha is 1.96. So that the criterion for acceptance of the Hypothesis is when the t-statistic> t-table.
From the results of hypothesis testing that has been done, in Table 4 the original sample value of CSR for all proxies of profitability is positive, but only the proxies for net profit margin (NPM) have significant results, so it can be said that the hypothesis in this study is corporate social responsibility (CSR) has a positive effect on profitability. It can be accepted by measuring profitability using net profit margin (NPM).
| Table 4 Hypothesis Test Results Path Coefficients (Mean, Stdev, T-Values) | ||||||
| Variable | Original Sample (O) | Sample Mean (M) | Std. Deviation (STDEV) | T Statistics (O/STDEV) | ||
| CSRI | → | ROA | 0.151 | 0.172 | 0.101 | 1.509 |
| CSRI | → | ROE | 0.102 | 0.119 | 0.112 | 0.921 |
| CSRI | → | EPS | 0.071 | 0.075 | 0.091 | 0.072 |
| CSRI | → | NPM | 0.273 | 0.301 | 0.121 | 2.303 |
| SIZE | → | ROA | 0.015 | 0.002 | 0.101 | 0.134 |
| SIZE | → | ROE | 0.049 | 0.041 | 0.115 | 0.498 |
| SIZE | → | EPS | 0.373 | 0.359 | 0.092 | 4.409 |
| SIZE | → | NPM | -0.021 | -0.027 | 0.081 | 0.212 |
| DER | → | ROA | -0.182 | -0.179 | 0.061 | 3.332 |
| DER | → | ROE | 0.271 | 0.262 | 0.132 | 2.114 |
| DER | → | EPS | 0.178 | 0.162 | 0.132 | 1.419 |
| DER | → | NPM | -0.292 | -0.291 | 0.061 | 4.927 |
Discussion
The results of hypothesis testing have shown that the Corporate Social Responsibility (CSR) variable has a positive effect on profitability as measured by Return on Assets (ROA), Return on Equity (ROE), Earning per Share (EPS) and Net Profit Margin (NPM) on manufacturing companies listed on the IDX in 2018-2019. This result is in accordance with research conducted by Rosdwianti et al., (2016); Fatah & Haryanto (2016);Bhernadha et al., (2017) which state that the amount of disclosure of Corporate Social Responsibility (CSR) has a positive effect on profitability as measured using Return on Equity (ROE), and Earning per Share (EPS). This shows that the more companies that disclose their CSR in their annual reports, the more their profitability will increase. Based on the analysis that has been done in this study, it shows that the accountability activities carried out by the company will affect what will be produced by the company. The Corporate Social Responsibility (CSR) variable in this study shows how much the disclosure of the company's activities in carrying out its obligations to the social environment.
Conclusion
The Corporate Social Responsibility (CSR) variable has a positive relationship with company profitability, which is proxied by Return on Assets (ROA), Return on Equity (ROE), Earning per Share (EPS), and Net Profit Margin (NPM). But only with the proxy of Net Profit Margin (NPM), the Corporate Social Responsibility (CSR) variable can significantly influence the company's profitability. So, it can be concluded that the higher the CSR disclosure of a company will increase the profit obtained from the company's sales, because consumers prefer products produced by companies that carry out social responsibility, and have a good image in society. The variable company size as a control variable has a positive relationship with company profitability as proxied by Return on Assets (ROA), Return on Equity (ROE) and Earning per Share (EPS), but has a negative relationship with company profitability as proxied by Net Profit Margin (NPM). This means that the higher the assets of a company will have an impact on the high profits obtained. Leverage variable as a control variable has a positive relationship with company profitability as proxied by Return on Assets (ROA) and Net Profit Margin (NPM). However, it has a negative relationship with company profitability as proxied by Return on Equity (ROE) and Earning per Share (EPS).
This study has limitations that can be taken into consideration for future researchers in order to get even better results. In this study, there is an element of subjectivity in the assessment of the corporate social responsibility (CSR) disclosure index, the companies that are the research samples are only manufacturing companies, the CSR disclosure made by companies in Indonesia is still low and there are still few companies in Indonesia that disclose CSR in accordance with Global guidelines. Reporting Initiative (GRI).
References
Andriansyah, A., Sulastri, E., & Satispi, E. (2021). The role of government policies in environmental management. Research Horizon, 1(3), 86-93.
Bhernadha, Y.A., Topowijono, T., & Azizah, D.F. (2017). Pengaruh Corporate Social Responsibility Terhadap Kinerja Keuangan Perusahaan (Studi Pada Perusahaan Winner Of Sustainability Reporting Award (Sra) 2015 Yang Terdaftar Di Pt Bei Periode 2010-2014). Jurnal Administrasi Bisnis, 44(1), 134-143.
Clarissa, S.V., & Rasmini, N.K. (2018). The effect of sustainability report on financial performance with good corporate governance quality as a moderating variable, International Journal of Sciences: Basic and Applied Research, 10(1), 9-19.
Fatah, K.A., & Haryanto, M. (2016). The effect of corporate social responsibility disclosure on company profitability: An empirical study of manufacturing companies in the basic industry and chemical sector listed on the indonesia stock exchange. Economist Journal, 10(2), 1-20.
Ghozali, I. (2008). Structural Equation Modeling: Metode Alternatif Dengan Partial Least Square (pls). Badan Penerbit Universitas Diponegoro.
Ghozali, I. (2011). Aplikasi Multivariate Dengan Program IBM SPSS 19. Semarang: Badan Penerbit Universitas Diponegoro.
Hadi, N. (2009). Social Responsibility: Theoretical Framework Study, and Its Role in Research in Accounting. Access: Journal of Economics and Business, 4(8), 88-109.
Kasmir, D. (2012). Analysis of Financial Statements. Jakarta: Raja Grafindo Persada.
Lako, A. (2010). Corporate social and environmental responsibility: Motives, accounting treatment and empirical evidence. Indonesian Management & Entrepreneurs, 1(1), 1-12.
Mardikanto, T. (2014). CSR (Corporate Social Responsibility). Bandung: Alfabeta.
Maryanti, E., & Fithri, W.N. (2017). Corporate social responsibility, good corporate governance, environmental performance on financial performance and its influence on company value. Journal of Accounting Science, 1(1), 21-37.
Rosdwianti, M.K., Dzulkirom, A.R., & Zahroh, Z.A. (2016). The influence of Corporate Social Responsibility (CSR) on company profitability (study on the consumer goods industry sector listed on the Indonesian stock exchange for the period 2013-2014). Journal of Business Administration, 38(2), 16-22.
Suparnyo, S. (2010). Corporate social responsibility (Corporate Social Responsibility) and its implementation. Masalah-Masalah Hukum, 39(3), 213-220.
Susanto, A.B. (2007). Corporate Social Responsibility. Jakarta: The Jakarta Consulting Group.
Warren, C.S., Reeve, J.M., Duchac, J.E., Suhardianto, N., Kalanjati, D.S., Jusuf, A.A., & Djakman, C.D. (2014). Accounting indonesia adaption. Jakarta: Salemba Empat.
Wibisono, Y. (2007). Dissecting the Concept & Application of CSR: Corporate Social Responsibility. Fascho Pub.