Research Article: 2024 Vol: 28 Issue: 1
Evaluating Intellectual Capital through the VAIC: Myth or Reality?
Massimo Cecchi , University of florence, Italy
Citation Information: Cecchi, M. (2024). Evaluating intellectual capital through the vaic: myth or reality? Academy of Accounting and Financial Studies Journal, 28(1), 1-19
Abstract
In both scientific and natural evolution, the proposal of new models is as important as their selection. However, the VAIC model seems to have completely bypassed this second phase. From our original meta-analysis of the literature, it appears that scholars use VAIC as a measure of CI without prior theoretical validation, with often very contradictory empirical results. Subsequently, the study evaluates the coherence of the VAIC from an epistemological, mathematical and empirical point of view, through a large sample (10,950 observations) of listed European companies It is proved that the VAIC has nothing to do with the value of the IC. It is only a biased measure of efficiency and does not have the ability to estimate knowledge and, therefore, to relate market value to IC.
Keywords
Intellectual capital, IC, VAIC, MB, Tobin’s Q, ROA, European listed companies.
Introduction
Modern economies have progressively moved from an industrial phase to a knowledge-based phase; as a result, basic assets are no longer made up of natural resources, financial capital and labor but of knowledge. Knowledge is a strategic resource that is precious, rare, and not easily accessible or replaceable; therefore, it is capable of creating a competitive advantage from a resource-based perspective.
In the context of this new form of knowledge competition, intellectual capital (IC) is gaining prominence in academic research and management practice because it is a significant contributor to value creation.
However, despite this transition, financial statements do not seem sufficiently equipped to incorporate such evanescent assets that are only partially controllable and measurable. The extant reporting rules have therefore prohibited their inclusion thus far.
However, this does not mean that these assets have zero value as a resource. Indeed, this failure to recognize knowledge in financial statements may result in a growing difference between market value and book value, creating the impression that financial reporting does not provide an adequate picture of companies’ operating assets.
On the other hand, inserting these new elements into financial statements would imply a real paradigm shift that would call theories consolidated through hundreds of years of accounting history into question.
According to the well-known approach of Kuhn (1962), a scientific paradigm will change if sufficient anomalies appear in relation to its fundamental concepts, methodologies and research results. A growing awareness of problems with an old model leads to the proposition of different models based on new conceptualizations. Then, these new models are tested, and finally, the model deemed superior is supported while the others are discarded.
Undoubtedly, in the context of traditional models, there has been a struggle to find a verifiable and reliable model for knowledge evaluation and representation. A myriad of new models has therefore been generated; some of these are substantially different from one another, but others, whose differences seem to be emphasized for commercial and consultancy reasons, are more similar.
However, this vast and varied panorama of models is the result of widespread creation activity that has not been followed by equally careful selection activity.
Among these models, the value added of intellectual capital (VAIC) is undoubtedly one of the best known and most applied, both in scientific research and in practice (Pulic, 1998, 2000, 2008). If we do a simple survey on the diffusion of the model using the term "VAIC" as a search key we find that from 2019 to today over 220 articles cited on Scopus and over 5,000 on Google Scholar have referred to the VAIC as a model for estimating intellectual capital.
In fact, this method, with its undeniable simplicity and objectivity of application, has become the ideal model, and it has been valued by nearly everyone since its appearance.
However, these qualities seem to have made us forget a preliminary question: is the VAIC truly able to measure the value of IC as its name promises?
This article aims to give a firm answer to this question, presenting and organizing established and new criticisms under three profiles: epistemological, mathematical and empirical.
The remainder of the paper is organized as follows. In the next section, we present an overview of the VAIC model and a quali-quantitative meta-analysis of the relevant literature. Section 3 further explains the objectives of the research, formulates the hypotheses and explains the methodologies used. Sections 4, 5 and 6 verify the VAIC model from epistemological, mathematical and empirical points of view. Section 7 concludes.
The Vaic Model And A Qualitative Meta-Analysis Of The Relevant Literature
To understand the reasons for the success of the VAIC model, it is necessary to take a step back and, just as Pulic does, start with a model called the "Skandia Navigator" (Edvinsson and Malone, 1997).
This model was developed within the Swedish company bearing the same name, which was among the first to try to explicitly evaluate its IC by publishing the results it obtained (Skandia, 1995).
The philosophy behind the report was that traditional financial statements represent only past financial information. Additional information about intellectual capital is needed to understand both an organization’s current capabilities and its future capabilities.
Two types of capital determine the market value (MV) of a company: financial capital (FC), which is the subject of more traditional measurements, and intellectual capital (IC).
Thus, according to this scheme, IC is composed of two elements: human capital (HC) and structural capital (SC).
Human capital is defined as the combined knowledge, skill, innovativeness and ability of a company’s individual employees to perform a task at hand. It also includes the company’s values, culture and philosophy. Human capital cannot be owned by a company.
Structural capital comprises the hardware, software, databases, organizational structure, patents, trademarks and everything else related to organizational capability that supports employees’ productivity – in other words, “everything that gets left behind at the office when employees go home”. Unlike human capital, structural capital can be owned and thus traded.
To operationalize these concepts, 164 metrics are proposed (91 metrics based on intellect and 73 based on traditional finance), of which 113 are deemed indispensable. These metrics should cover all perspectives.
It is evident that if a system of this type is able to lead to an explicit and detailed reflection on its intangible heritage, its complexity is so great that it presents enormous application difficulties in terms of the information flows that must be managed, synthesized and compared.
Most likely due to these problems, the VAIC model has attracted great interest.
Following the Skandia model, its creator, Ante Public, argues that the difference between book value and market value depends on the company's IC, which can be estimated based on the indicator he conceived; this indicator is based only on company financial statement figures, i.e., financial indicators.
This seems to be an “egg of Columbus”: simple and effective.
Pulic's proposal is certainly innovative, from the perspective of both the content and the method, and his model has the clear merit of bridging between the research on IC and that on firm performance measurement. Thus, since its first appearance, it has been applauded for its ease of calculation, as it can be estimated from publicly available financial statements that can become even more reliable sources when audited. Moreover, the use of the VAIC does not require managers to adopt external benchmarks.
Pulic’s reasoning starts from the value-added relationship, which is fully derivable from book value:
VA= OUT- IN = OP + HC + D + A
Here, VA denotes added value; OUT indicates total sales; IN denotes the external cost of purchasing materials, components and services; OP indicates operating profit; HC stands for personnel costs; D represents depreciation; and A denotes the amortization of assets.
At this point, the measures of intellectual capital (IC) previously identified by the Skandia Navigator are displayed: human capital (HC) and structural capital (SC).
The value of HC is calculated as the sum of the company's total wages and salaries.
The value of SC, as the second component of IC, is calculated as the difference between value added (VA) and the value of HC.
The VAIC is the sum of three efficiency ratios, each of which is obtained through a combination of VA, HC, Pulic's definition of structural capital (SC= VA - HC) and capital employed (CE):
a) Human capital efficiency (HCE = VA/HC);
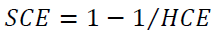
b) Structural capital efficiency (SCE = SC∕VA = (VA − HC) ∕VA).
c) Capital employed efficiency (CEE = VA∕CE).
In particular, efficiency in the use of intangible resources, or intellectual capital efficiency (ICE), is measured as HCE+SCE.
According to Pulic himself (Pulic, 2000, p. 39), "as the results of our empirical analysis [27 randomly selected FTSE 250 companies on the London Stock Exchange from 1992 to 1998/1999, addition by the authors] have been confirmed by a relevant statistical analysis, which showed a high degree of correlation between market value and the efficiency of resources, it seems logical to go a step further and conclude that this relationship could also function vice versa. This means that we should be able to calculate the approximate MV (market value, addition by the authors) of any company via the VAIC coefficient” (Ståhle et al., 2011).
Although, as we will see, some authors have contested this reasoning, repeatedly affirming that the model achieves its simplicity by losing any real link with IC, this issue does not seem to be of much interest to the literature.
The VAIC is considered an “a priori” measure of IC, but its ability to predict a firm's profitability and market-to-book value is also problematic.
As noted above, hundreds of studies are performed each year using the VAIC as a measure of IC; therefore, it is impossible to perform a comprehensive review. However, we believe that it is essential to implement some form of order and synthesis, as this can also help verify the effectiveness of the measure.
Therefore, to do this, we proposed a quali-quantitative meta-analysis as follows (Hansen et al. 2021).
The articles analyzed were collected from the Scopus database using the term "VAIC" as a search key. We then sorted the results by the number of citations and selected the first 100.
To collect a sample of sufficiently homogeneous and audited financial statements, first, we selected only research on listed companies, excluding 18 articles.
Second, to ensure the homogeneity of our sample for analysis, we then selected only the models that used a given statistic, namely, the static OLS, thus excluding another 26 articles.
Then, we selected models that predicted profitability or market value as a dependent variable and used the VAIC as an independent variable, that is, the following models:
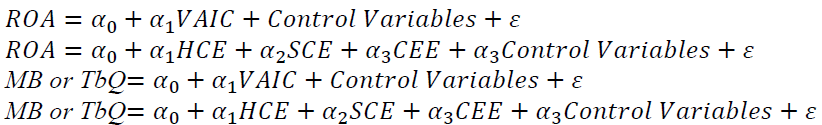
This led us to exclude another 31 articles. Moreover, excluding 2 articles that were not in English and 4 that were incomplete, we were left with a sample of 19 articles.
Then, adding another 15 articles that were not mentioned among the first 100 in Scopus but were repeatedly cited by the selected articles, we arrived at a final sample of 34 articles.
The results are shown in Table 1, where Scopus articles are marked with "S".
| Table 1 Profitability (ROA) | |||||||||||||||||||||||||||||||||||||||||
| Static OLS | HCE | SCE | CEE | VAIC | |||||||||||||||||||||||||||||||||||||
| Year | Author | Period | Country | Obs | Sect | C | H | P | Vctrl | * * * |
* * |
* | no | no | * | * * |
* * * |
* * * |
* * |
* | no | no | * | * * |
* * * |
* * * |
* * |
* | no | no | * | * * |
* * * |
* * * |
* * |
* | no | no | * | * * |
* * * |
| 2003 | Firer and Williams | 01-01 | S.Africa | 75 | 9 | n | n | n | adhq | ☐ | • | ☐ | |||||||||||||||||||||||||||||
| 2005 | Chen et al.S | 92-02 | Taiwan | 4254 | 1 | n | n | n | - | • | • | • | • | ||||||||||||||||||||||||||||
| 2008 | Kamath S | 96-06 | India | 250 | 3 | n | n | n | adh | ☐ | ☐ | ☐ | |||||||||||||||||||||||||||||
| 2008 | Gan and Saleh S | 04-05 | Malaysia | 178 | 8 | y | n | n | - | • | ☐ | • | ☐ | ||||||||||||||||||||||||||||
| 2009 | Chan S | 01-05 | HongKong | 156 | 13 | y | n | n | abo | ☐ | • | • | • | ||||||||||||||||||||||||||||
| 2009 | Ting and Lean S | 99-07 | Malaysia | 180 | 1 | y | y | n | - | • | ☐ | • | • | ||||||||||||||||||||||||||||
| 2011 | Chu et al. S | 01-09 | China | 333 | 1 | y | n | n | ad | • | • | • | ☐ | ||||||||||||||||||||||||||||
| 2011 | Chu et al. S | 01-05 | HongKong | 604 | 1 | y | n | n | ad | ☐ | • | • | ☐ | ||||||||||||||||||||||||||||
| 2011 | Razaf. and Anggreni S | 03-06 | Indonesia | 144 | 7 | n | n | n | - | ☐ | • | ☐ | |||||||||||||||||||||||||||||
| 2011 | Maditinos et al. | 06-08 | Greece | 288 | 16 | n | n | n | - | ☐ | ☐ | ☐ | ☐ | ||||||||||||||||||||||||||||
| 2012 | Pal and Soriya S | 01-10 | India | 1975 | 3,6 | y | n | y | blf | • | • | • | • | ||||||||||||||||||||||||||||
| 2013 | Joshi et al. S | 06-08 | Australia | 99 | 4 | y | y | n | - | ☐ | ☐ | • | • | ||||||||||||||||||||||||||||
| 2014 | Calenza and Rossi S | 03-08 | Italy | 184 | 1 | n | n | n | - | ☐ | ☐ | ☐ | ☐ | ||||||||||||||||||||||||||||
| 2014 | Al Musali and Ku Ismail | 08-10 | Arabia | 33 | 2 | y | n | n | cr | • | ☐ | • | • | ||||||||||||||||||||||||||||
| 2016 | Ahmad and Ahmed S | 08-13 | Pakistan | 464 | 4 | n | n | y | abo | ☐ | ☐ | • | • | ||||||||||||||||||||||||||||
| 2017 | Dzenopoljac et al. S | 11-15 | Arabia | 500 | 1 | n | y | n | - | ☐ | • | ☐ | |||||||||||||||||||||||||||||
| 2017 | Ozkan et al. S | 05-14 | Turkey | 528 | 2 | n | n | y | abp | ☐ | • | • | ☐ | ||||||||||||||||||||||||||||
| 2017 | Smriti and Das S | 05-16 | India | 1452 | 3 | n | n | n | aen | ☐ | ☐ | ☐ | |||||||||||||||||||||||||||||
| 2018 | Khan S | 06-16 | India | 561 | 3 | y | y | y | bon | • | ☐ | • | • | ||||||||||||||||||||||||||||
| 2018 | Chowdhury et al. S | 13-17 | Bang. | 170 | 6 | n | n | n | abo | ☐ | ☐ | ☐ | |||||||||||||||||||||||||||||
| 2018 | Tiwari and Vidyarthi S | 99-15 | India | 624 | 2 | y | n | y | ab | ☐ | ☐ | • | |||||||||||||||||||||||||||||
| 2018 | Hamdan | 14-16 | Arabia | 342 | 1 | n | y | y | coq | • | • | • | |||||||||||||||||||||||||||||
| 2018 | Hamdan | 14-16 | Bahrain | 54 | 1 | n | y | y | coq | ☐ | • | ☐ | |||||||||||||||||||||||||||||
| 2018 | Mohammad et al. | 11-15 | Malaysia | 205 | 10 | y | y | y | - | • | • | ☐ | • | ||||||||||||||||||||||||||||
| 2018 | Xu and Wang | 12-16 | Korea | 1950 | 4 | y | y | n | ab | • | ☐ | • | • | ||||||||||||||||||||||||||||
| 2019 | Bayraktaroglu et al. S | 03-13 | Turkey | 400 | 4 | y | n | n | - | • | • | ☐ | |||||||||||||||||||||||||||||
| 2019 | Xu and Wang | 12-16 | China | 195 | 5 | y | y | n | abm | • | ☐ | • | • | ||||||||||||||||||||||||||||
| 2020 | Bansal and Singh | 13-18 | India | 355 | 14 | n | n | y | - | ☐ | • | • | • | ||||||||||||||||||||||||||||
| 2020 | Kevser and Dorgan | 15-19 | Turkey | 110 | 1 | n | y | y | a | • | |||||||||||||||||||||||||||||||
| 2020 | Nassar | 12-18 | Palestine | 264 | 15 | y | n | y | ab | • | ☐ | • | • | ||||||||||||||||||||||||||||
| 2020 | Weqar and Haque | 09-18 | India | 430 | 1 | y | n | n | dm | • | • | • | • | ||||||||||||||||||||||||||||
| 2021 | Xu and Zhang | 13-19 | China | 206 | 5 | y | y | y | ablno | • | ☐ | • | • | ||||||||||||||||||||||||||||
| Percent from total observations (%) | 1 | 0 | 0 | 20 | 15 | 2 | 45 | 17 | 2 | 11 | 0 | 12 | 26 | 5 | 33 | 12 | 0 | 26 | 0 | 12 | 9 | 1 | 2 | 49 | 0 | 0 | 0 | 1 | 15 | 0 | 34 | 50 | |||||||||
| Mean significance (n. of stars) and Std.err. | Mean 1.40* | SE 0.57 | Mean 0.78* | SE 0.67 | Mean 0.99* | SE 1.38 | Mean 2.18* | SE 0.61 | |||||||||||||||||||||||||||||||||
We find that no article explicitly reflects on the actual ability of the VAIC to measure IC.
Table 1 presents the studies that use profitability, expressed by ROA, as a dependent variable (31 articles).
Table 2 presents the studies that use a comparison of market value and accounting value, expressed by the market-to-book ratio (MB) or Tobin's Q (TbQ), as a dependent variable.
| Table 2 MB-TbQ | ||||||||||||||||||||||||||||||||||||||||||
| Static OLS | HCE | SCE | CEE | VAIC | ||||||||||||||||||||||||||||||||||||||
| Year | Author | Period | Country | Obs | Sect | C | H | P | Vctrl | Vdip | * * * |
* * |
* | no | no | * | * * |
* * * |
* * * |
* * |
* | no | no | * | * * |
* * * |
* * * |
* * |
* | no | no | * | * * |
* * * |
* * * |
* * |
* | no | no | * | * * |
* * * |
| 2003 | Firer and Williams | 01-01 | S.Africa | 75 | 9 | n | n | n | adhq | mb | • | ☐ | • | |||||||||||||||||||||||||||||
| 2005 | Chen et al. S | 92-02 | Taiwan | 4254 | 1 | n | n | n | - | mb | • | • | • | • | ||||||||||||||||||||||||||||
| 2008 | Kamath S | 96-06 | India | 250 | 3 | n | n | n | adh | mb | ☐ | ☐ | ☐ | |||||||||||||||||||||||||||||
| 2008 | Gan and Saleh S | 04-05 | Malaysia | 178 | 8 | y | n | n | - | mb | • | ☐ | • | ☐ | ||||||||||||||||||||||||||||
| 2009 | Chan S | 01-05 | HongKong | 156 | 10 | y | n | n | abo | mb | • | ☐ | • | ☐ | ||||||||||||||||||||||||||||
| 2011 | Chu et al . S | 01-09 | China | 333 | 1 | y | n | n | ad | mb | ☐ | ☐ | • | ☐ | ||||||||||||||||||||||||||||
| 2011 | Chu et al. S | 01-05 | HongKong | 604 | 1 | y | n | n | ad | mb | • | • | • | ☐ | ||||||||||||||||||||||||||||
| 2011 | Maditinos et al. | 06-08 | Greece | 288 | 16 | n | n | n | - | mb | ☐ | ☐ | • | ☐ | ||||||||||||||||||||||||||||
| 2014 | Calenza and Rossi S | 03-08 | Italy | 184 | 1 | n | n | n | - | mb | ☐ | ☐ | ☐ | ☐ | ||||||||||||||||||||||||||||
| 2016 | Husna et al. | 06-13 | USA | 1328 | 12 | n | n | y | acnq | mb | ☐ | • | • | |||||||||||||||||||||||||||||
| 2017 | Smriti and Das S | 05-16 | India | 1452 | 3 | n | n | n | aeh | mb | ☐ | • | • | |||||||||||||||||||||||||||||
| 2018 | Khan S | 06-16 | India | 561 | 3 | y | y | y | bin | mb | • | • | ☐ | ☐ | ||||||||||||||||||||||||||||
| 2018 | Hamdan | 14-16 | Arabia | 342 | 1 | n | y | y | coq | tbq | ☐ | • | • | |||||||||||||||||||||||||||||
| 2018 | Hamdan | 14-16 | Bahrain | 54 | 1 | n | y | y | coq | tbq | • | ☐ | ☐ | |||||||||||||||||||||||||||||
| 2019 | Bayraktaroglu et al. S | 03-13 | Turkey | 400 | 4 | y | n | n | - | mb | ☐ | ☐ | • | |||||||||||||||||||||||||||||
| 2020 | Saleh et al. | 15-18 | Malaysia | 352 | 1 | y | y | y | ab | tbq | • | ☐ | • | • | ||||||||||||||||||||||||||||
| 2020 | Kevser and Dorgan | 15-19 | Turkey | 110 | 1 | n | y | y | a | tbq | • | |||||||||||||||||||||||||||||||
| 2020 | Weqar and Haque | 09-18 | India | 430 | 1 | y | n | n | dl | mb | • | ☐ | ☐ | • | ||||||||||||||||||||||||||||
| Percent from total observations (%) | 8 | 0 | 0 | 9 | 35 | 0 | 39 | 9 | 3 | 0 | 0 | 9 | 15 | 2 | 45 | 26 | 17 | 0 | 0 | 4 | 5 | 0 | 46 | 28 | 0 | 0 | 0 | 18 | 7 | 6 | 62 | 7 | ||||||||||
| Mean significance (n. of stars) and Std.err. | Mean 0.83* | SE 0.73 | Mean 1.59* | SE 0.57 | Mean 1.25* | SE 1.03 | Men 1.50* | SE 0.48 | ||||||||||||||||||||||||||||||||||
Each item-line therefore reports the corresponding document’s year of publication (Year), the name of the authors (Author), the study period of the research (Period), the observed nation (Country), and the number of observations included (Obs), which, when not explicitly reported, was calculated as the product of the number of years and the number of companies examined and reported in italics.
For reasons of space, the business sectors of the companies examined by the studies were coded with numbers, and a key is provided at the bottom of Table 2.
Sect (Sectors): 1) All listed; 2) Banks; 3) Pharma; 4) Financial; 5) Agricultural; 6) Textile; 7) Consumer goods; 8) Technology intensive; 9) Banking, Electric, IT, and Services; 10) Commerce, Industry, Finance, Properties, and Utilities; 11) Textile and Apparel; 12) Multinational R&D firms; 13) Construction; 14) Software; 15) All listed excluding Banks; 16) Industrial Goods and Services, Food and Beverage, and Personal and Household Goods
a) C (Collinearity test): Y (yes) if present; N (no) if not detected
b) H (Heteroskedasticity test): Y (yes) if present; N (no) if not detected
c) P (Regression for panel data): Y (yes) if used; N (no) if not detected
Vctrl (control variables): a) LEV (debt to total assets); b) LnTA (natural logarithm of total assets); c) TA (total assets); d) LnMC (natural logarithm of market capitalization); e) MC (market capitalization); h) ROE (return on equity); i) ATO (revenue to total assets); n) Year (year data); o) Age; l) PC (fixed assets to total assets); p) DP (deposits and participation);q) Ind (dummy variable for industry sector); g) Sales; r) Crisis (dummy variable for crisis status); m) GDP (gross domestic product); f) LnSales (natural logarithm of Sales).
Conceptual Framework, Hypotheses and Methodology
Various problems emerge from the above meta-analysis.
First, the examined articles use the VAIC as if it were an effective tool for measuring IC without prior validation.
Second, regressive models that verify the links among the VAIC, profitability (ROA) and unexpressed market values in financial statements (MB and TbQ) are very often presented concisely without specifying whether major potential biases, such as collinearity (C) and heteroskedasticity (H), have been controlled and whether regression models for panel data, maybe even robust ones, have been adopted.
In summary, three types of problems that we intend to investigate arose from the above analysis: epistemological, mathematical and empirical.
Hence, we will develop three research questions in the next paragraphs.
The first is a basic question that is expressed by the title of our article, namely, if there is a logical connection between the VAIC and IC,
a) Is the VAIC model coherent from an epistemological point of view? (par. 4)
b) The second question concerns whether, even if we intend the VAIC only as a measure of efficiency, its structure is mathematically correct or entails biases (mathematical verification):
c) Is the VAIC model correct from a mathematical point of view?
The third question is as follows: given the contradictory results that emerged from the meta-analysis, the lack of transparency of some statistical procedures and the characteristics of the utilized survey samples, is the association between the VAIC and profitability or market value also verifiable through avn extensive sample of observations of Western companies (empirical verification)? Thus, we ask the following:
1) Is the VAIC model valid from an empirical point of view?
A verification of hypotheses 1 and 2 (concerning the correctness of the VAIC model from epistemological and mathematical points of view) will be conducted in paragraphs 4 and 5 using a logical-deductive methodology.
A test of hypothesis 3 (concerning the empirical relationships between the VAIC model and profitability and the market-to-book value) will be performed in paragraph 6 using a panel regression model on a sample of over 10,000 observations of listed European firms.
Epistemological verification
Taking a step back, we can state in very general terms that a theory is a system of constructs and ideal objects linked through propositions and hypotheses (Nagel, 1961, Dubin, 1969).
Constructs gain coherence both internally through consistency between their definitions, scope conditions and semantic relationships and externally through their relationships with other constructs that are part of the same theory. Therefore, proper constructs are necessary for a good theory, but a good theory is necessary to arrive at proper constructs (Kaplan 1964).
Since constructs are conceptual abstractions, to observe, measure and empirically test a theory, an operationalization phase in which variables are identified is necessary (MacCorquodale and Meehl 1948). In summary, variables are the operational translations of constructs (Dubin 1969), and they are necessary to empirically verify a theory.
According to the most critical scholars (among others, Iazzolino and Laise, 2013), in summary, this is precisely the element that is lacking from the Pulic model.
Indeed, it is an empirical model that does not have a clear underlying theoretical construction; moreover, instead of making the theoretical construction operational, the three variables HCE, SCE and CEE play the opposite role, completing the construction.
It is true that predictions can be made with only an empirical model, since predictions require only correlation, but it is also true that "correlation is not causality" (Pearson, 1892). Logical explanations require causality, that is, an understanding of cause and effect relationships. It is plausible that a company with much unexpressed IC on its financial statement has a relatively high level of profitability and/or market value, but the opposite hypothesis is not always true, as there are countless reasons besides unexpressed IC for differences in profitability or market value for a given book value.
Apparently, the VAIC method works with the main constructs and variables of Skandia's intellectual capital, such as structural capital and human capital, but Pulic makes a “semantic shift” that radically modifies the meaning of the terms used in the Skandia Navigator (Edvinsson e Malone, 1997).
The term HC does not refer to the set of characteristics (stock entity) held by employees, such as skills and abilities (Skandia Navigator); rather, it denotes the annual expenses for wages, salaries, training, etc., incurred for all workers (flow entity), with no direct link to "knowledge" (Boujelbene and Affes, 2013).
The term SC is not a set of characteristics (stock entity) of intangible assets (Skandia Navigator) but the annual VA residual after HC expenses are deducted (flow entity) (Andriessen, 2004).
Consequently, nothing in the calculation gives a reason to specifically emphasize IC (Ståhle et al. 2011).
In fact, Pulic (1998) defines IC as the value added of a firm, and by replacing cause (intellectual capital) with effect (value creation), he operationalizes IC as monetary value, measuring value creation on a “value added” income statement. As Marzo (2021) states, it is a form of metonymy in which value added is both generated value and the value of IC itself.
Inevitably, this double identity of VA, like the value generated by IC and IC itself, generates a circular reference in the model that detriments the clarity of the construct. Moreover, the parameters are chiefly efficiency parameters that combine labor productivity and capital productivity to measure overall productivity.
According to Pulic, IC is not a set of intangible assets like it is in the Skandia Navigator; rather, as previously noted, it is the annual VA created by the workforce as a whole, both intellectual and otherwise (Andriessen, 2004).
As a result, even the indicators HCE, SCE, and the resulting ICE and VAIC are difficult to interpret in the context of the typical constructs used by studies on IC.
If we examine the three variables that make up the model, it is quite clear that HCE measures human capital efficiency as the ratio of a company’s value added to its human capital expenses. However, Pulic’s idea is to use this indicator to measure “intellectual work efficiency similar to what Taylor did with physical work” (Pulic, 2008, p. 3); indeed, the idea does not find any real confirmation. HCE does not distinguish between "intellectual" and "physical" work, and HCE would increase even in cases involving the heavy exploitation of low-skilled and underpaid workers; this is just the opposite of the concept of valuable human capital.
Furthermore, even if Pulic focuses on the meaning of the relationship only from the perspective of value generation, a reverse reading is also possible. In this sense, HCE can be interpreted as the amount of value added absorbed by the remuneration of employees without adding anything to the more traditional metrics also generally used in social reporting (Marzo, 2021). Therefore, an increase in HCE could be interpreted either as hypothesized by Pulic, namely, as an increase in the productivity of human capital (intellectual or otherwise); as the distribution of a smaller share of value added to the company's employees in the form of wages; or as a combination of both.
Since, as noted earlier, "real" SC is not included in the VAIC, the SCE indicator has nothing to do with measuring "the structures and processes that employees develop and implement to be productive, effective and innovative". As we will show later, SCE is just a mathematical counterweight to HCE.
Even CEE, which should express knowledge from market channels, customer and supplier relationships and governmental or industrial networks, is essentially a measure of the efficiency of invested capital.
Therefore, the analysis of the method leads us to the conclusion that the VAIC has nothing to do with intellectual capital. This factor simply indicates a company's operational efficiency differently and in addition to the financial metrics already in use.
However, even taking the VAIC as a measure of efficiency, we find that this indicator and the parameters that compose it present important logical-mathematical distortions that are useful to explain.
Mathematical Verification
The first mathematical problem we notice in the use of the VAIC as an efficiency measure is that VA depends on the productive structure of a firm. Therefore, it does not seem feasible to compare the value of different firms (even in the same sector) or the evolution of the value of the same firm over time when its production structure changes.
Since VA is in the numerator, two different companies with the same return (OP) and HC but with different production structures have different VA and therefore different HCE levels.
To clarify this question, let us return to the calculation of VA:
VA= OUT- IN = OP + HC + D + A
Now let us take two companies as a reference (Table 3). Companies “1” and “2” have the same operating profit (OP=20) and human capital cost (HC= 20); however, while company 1 owns its own equipment that depreciates (higher “D” and “A”), company 2 rents the same equipment externally (higher “IN”). Therefore, the first company has a higher VA than the second (100 vs. 60) and, on equal terms, a higher HCE (5 vs. 3).
| Table 3 Comparison | ||
| 1 | 2 | |
| OUT | 120 | 120 |
| IN | 20 | 60 |
| VA | 100 | 60 |
| HC | 20 | 20 |
| D | 20 | 10 |
| A | 40 | 10 |
| OP | 20 | 20 |
| HCE=VA/HC | 5 | 3 |
| SCE=SC/VA | 0.8 | 0.(6) |
| ICE=HCE+SCE | 5.8 | 3.(6) |
If we then leave the abstraction of two identical companies behind, it is evident that comparisons between the HCEs of companies with different production structures in the same sector or even in different sectors are devoid of any meaning.
Second, there is a temporal discrepancy in the measurement of the efficiency of the “cost of knowledge” (Andriessen, 2004). In fact, if a part of HC was supported via training during the "t" period, it is likely that this will lead to only a future increase in VA. We then arrive at the contradiction that an "increase in knowledge" would lead to a decrease in HCE in the "t" period.
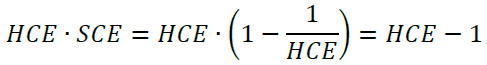
Another problem arises from the relationships between the variables that compose HCE and SCE. In fact, the formulas for structural capital (SCE) and human capital (HCE) entail perfect superimpositions and dependency stemming from their definitions, i.e., they are calculated derivatives of each other (Ståhle et al. 2011):
As we can see, the higher HCE is, the higher SCE.
When productivity workers’ HCE = 1 (when VA covers HC), then SCE = 0. This is the break-even value that marks the transition from the value destruction zone (SCE < 0) to the value creation zone (SCE>0).
However, if we consider ICE=HCE+SCE, we have:
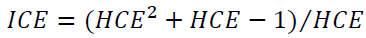
Thus, ICE is positive even when 0.618<HCE<1 (when VA cannot cover HCE) and when −1.618< HCE <0 (when VA is negative, since HC>0 by definition) (figure 1).

Figure 1 ICE
Furthermore, despite Pulic’s claims that the intellectual potential of each company includes the ability of its employees to create value by efficiently using corporate infrastructure (Pulic 1998, p. 7), these synergies are completely neglected (Andriessen 2004).
However, the existence of synergies is reasonable, and some scholars have tried to introduce interaction terms into their regression models (Silvestri and Veltri 2014; Bayraktaroglu et al. 2019). However, mathematically, the interaction term between HCE and SCE has the following effect:
Since SCE is a function of HCE, the interaction term disappears; therefore, the analysis cannot truly consider the role of the interaction between these two types of capital.
Empirical verification
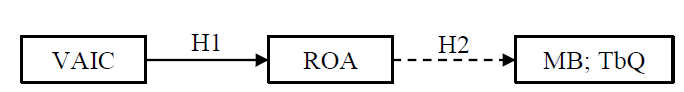
As discussed above, since the VAIC measures efficiency, albeit in a biased way, we expect that there could be a positive empirical relationship between the VAIC (or its components) and other more traditional measures of performance.
Additionally, as there is a clear relation between a company's performance and its market value, we expect that there could be an indirect relationship between the VAIC (or its components) and market value.
We therefore divide the third research question into two substatements:
H1: As a measurement of efficiency, the VAIC has a direct positive relation with return on assets (ROA);
H2: s a measurement of efficiency, the VAIC has a weak indirect or nonexistent relation with unexpressed market value in financial statements (the market-to-book ratio and Tobin’s Q).
Sample Selection
To compose the sample, we extract data from the Amadeus database by selecting only listed companies to obtain statements with high accounting standards and ensure consistency with the previously developed meta-analysis.
Unlike the samples of most of the previous related studies, this sample is very large and consists of European companies that are thus subject to homogeneous legislation and operating in highly developed economies: Austria (AT), Belgium (BE), Germany (DE), Spain (ES), France (FR), Great Britain (GB), Ireland (IE) and Italy (IT).
We have selected only medium to large companies with a minimum turnover of € 20 ml, total assets of at least € 10 ml and at least 100 employees.
We select companies that were listed as of May 2021 (1,807), and we observe them for 9 years during the prepandemic period, namely, from 2011 to 2019.
Not all the selected companies were listed during the selected period; moreover, after removing the outliers, we obtain 10,950 firm-year observations.
Table 4 presents the observations by sector and country. As we can see, the composition of the sample from both qualitative and quantitative points of view is clearly affected by theproductive structure of each country and the size of the stock market.
| Table 4 Countries | |||||||||
| NACE | AT | BE | DE | ES | FR | GB | IE | IT | Tot |
| n.i. | 10 | 9 | 9 | 307 | 335 | ||||
| 01-10 | 12 | 26 | 74 | 65 | 66 | 274 | 18 | 138 | 673 |
| 11-20 | 8 | 48 | 388 | 100 | 320 | 676 | 10 | 279 | 1,829 |
| 21-30 | 8 | 7 | 63 | 28 | 84 | 181 | 97 | 468 | |
| 31-40 | 27 | 42 | 124 | 106 | 211 | 899 | 20 | 127 | 1,556 |
| 41-50 | 16 | 15 | 48 | 35 | 167 | 323 | 27 | 82 | 713 |
| 51-60 | 45 | 58 | 329 | 264 | 688 | 740 | 18 | 166 | 2,308 |
| 61-70 | 101 | 23 | 608 | 91 | 824 | 548 | 78 | 221 | 2,494 |
| 71-80 | 4 | 31 | 8 | 69 | 258 | 32 | 9 | 411 | |
| 81-96 | 36 | 5 | 10 | 97 | 15 | 163 | |||
| Total | 217 | 223 | 1,711 | 711 | 2,448 | 4,303 | 203 | 1,134 | 10,950 |
Table 5 presents the observations by country and year. While a company must be listed in 2021 to be selected (1,807 companies), not all the companies listed during that year were also listed in previous years. Therefore, the sample decreases between 2019 (1,486) and 2011 (896).
| Table 5 Countries | |||||||||
| Year | AT | BE | DE | ES | FR | GB | IE | IT | Tot |
| 2011 | 21 | 21 | 49 | 72 | 246 | 389 | 15 | 83 | 896 |
| 2012 | 20 | 26 | 43 | 67 | 260 | 405 | 17 | 105 | 943 |
| 2013 | 21 | 27 | 39 | 64 | 257 | 414 | 20 | 108 | 950 |
| 2014 | 18 | 23 | 227 | 69 | 263 | 443 | 26 | 110 | 1,179 |
| 2015 | 18 | 25 | 242 | 79 | 263 | 474 | 26 | 120 | 1,247 |
| 2016 | 28 | 26 | 262 | 80 | 275 | 508 | 28 | 131 | 1,338 |
| 2017 | 30 | 28 | 271 | 91 | 284 | 546 | 26 | 151 | 1,427 |
| 2018 | 33 | 27 | 285 | 94 | 299 | 559 | 27 | 160 | 1,484 |
| 2019 | 28 | 20 | 293 | 95 | 301 | 565 | 18 | 166 | 1,486 |
| Total | 217 | 223 | 1,711 | 711 | 2,448 | 4,303 | 203 | 1,134 | 10,950 |
Definitions of variables and regression model
For each firm-year, we select the main variables observed in the previous studies (see table 1). Their labels and descriptions are shown in table 6.
| Table 6 Descriptions | ||
| Variables | Labels | Measurements |
| Dependent variables | ||
| Market-to-book ratio | MB | Ratio of the market value of equity to the book value of equity |
| Tobin’s Q | TbQ | Ratio of market value to the replacement value of assets, where: the market value of assets is the market value of equity + liabilities the replacement value of assets is the book value of equity + liabilities |
| Return on assets | ROA | Ratio of EBIT to total assets, where: EBIT is earnings before interest and taxes |
| Independent variables | ||
| Human capital efficiency | HCE | Ratio of value added to human capital, where: value added is operating profit + employee cost + depreciation human capital is total costs invested in employees |
| Structural capital efficiency | SCE | Ratio of structural capital to value added, where: structural capital is value added – human capital |
| Capital employed efficiency | CEE | Ratio of value added to capital employed, where: capital employed is equity + long term liabilities |
| Control variables | ||
| Profitability | ROE | Ratio of net income divided by equity |
| Size | LnTA | Natural logarithm of total assets |
| Capital structure | Lev | Ratio of total assets to equity |
| Industry | Ind | Dummy variable that identifies the nine NACE base codes |
| Country | Country | Dummy variable that identifies the eight countries observed |
To test hypothesis 1, namely, whether the VAIC, as a measurement of efficiency, has a direct positive relation with return on assets (ROA), we create two regression models. One has only control variables (model 1) and another introduces the VAIC variables (HCE, SCE, CEE) (model 2):


To test hypothesis 2, namely, whether the VAIC has a weak indirect or no relation with unexpressed market value on financial statements, we create two regression models for MB (3 and 4) and TbQ (5 and 6). As is done for hypothesis 1, for each market value indicator (MB and TbQ), first, we insert only control variables (models 3 and 5), and then we introduce the VAIC variables (HCE, SCE, CEE) (models 4 and 6):


Results and Discussion
Table 7 presents the descriptive statistics. From the MB and HCE indicators, we can see how cases with negative equity or value added are excluded.
| Table 7 Descriptive Statistics | |||||
| Variable | Obs | Mean | Std. Dev. | Min | Max |
| MB | 10,950 | 2.802 | 7.369 | .006 | 309.223 |
| TbQ | 10,950 | .549 | .19 | .005 | .997 |
| ROA | 10,950 | .063 | .105 | -1.94 | 2.517 |
| HCE | 10,950 | 2.102 | 2.97 | .007 | 104.601 |
| SCE | 10,950 | .272 | 1.86 | -135.682 | .99 |
| CEE | 10,939 | .533 | .431 | 0 | 5.31 |
| ROE | 10,950 | 7.593 | 45.451 | -911.326 | 932.973 |
| Size | 10,950 | 13.177 | 2.119 | 6.802 | 20.66 |
| Lev | 10,950 | 3.269 | 7.772 | 1.004 | 342.651 |
Pearson correlation coefficients were computed to examine the strength and direction of the relationships between all the variables in the study (Table 8).
| Table 8 Correlation Coefficients | |||||||||
| Variables | MB | TbQ | ROA | HCE | SCE | CEE | ROE | Size | Lev |
| MB | 1.000 | ||||||||
| TbQ | 0.125*** | 1.000 | |||||||
| ROA | 0.346*** | -0.147*** | 1 .000 | ||||||
| HCE | 0.004 | -0.021** | 0.128*** | 1.000 | |||||
| SCE | 0.000 | 0.015 | 0.153*** | 0.096*** | 1.000 | ||||
| CEE | 0.160*** | -0.043*** | 0.229*** | -0.153*** | 0.018* | 1.000 | |||
| ROE | 0.375*** | -0.052*** | 0.581*** | 0.067*** | 0.106*** | 0.116*** | 1.000 | ||
| Size | -0.033*** | 0.298*** | 0.056*** | 0.214*** | 0.076* | -0.238*** | 0.082*** | 1.000 | |
| Lev | 0.304*** | 0.324*** | -0.057*** | -0.008 | 0.000 | -0.043*** | 0.058*** | 0.103*** | 1.000 |
The Pearson's correlations show profound differences between the VAIC, market value (MB and TbQ) and profitability (ROA).
The market-to-book ratio (MB) is significantly correlated (p <0.001) with only CEE and Tobin's Q (TbQ) and more weakly (p <0.05) correlated with HCE. In contrast, ROA is significantly related to all the components of the VAIC (p <0.001).
We then proceed with the regression analysis.
For all the models, 1.12 ≥VIF ≥1.02 (mean 1.06) for each independent variable. This indicates that there are no multicollinearity problems.
We then perform the regressions using panel data analysis; moreover, to decide whether to use fixed or random effects, we perform a Hausman test, which indicates that the fixed effects model is preferable (p = 0.000 and χ2 = 108.74.
However, there are some problems. The modified Wald statistic reveals heteroskedasticity (p=0.00 and χ2 1664). Furthermore, Shapiro–Wilk and Shapiro-France tests indicate that the variables are not normally distributed. However, the limited number of years examined does not present serial correlation problems.
Therefore, we use a regression with cluster-robust standard errors; then, to choose between fixed or random effects, we use a robust version of the Hausman test that indicates that fixed effects are preferable (p< 0.05 and χ2= 12.74). The same results are given by the Sargan-Hansen statistic (p=0.00 and χ2= 44.061).
Unfortunately, in using a fixed effects model, we must forgo the dummy variables. The regression results are shown in table 9.
| Table 9 Regression | ||||||
| (1) | (2) | (3) | (4) | (5) | (6) | |
| ROA | ROA | MB | MB | TbQ | TbQ | |
| HCE | .004*** | -.007 | -.001 | |||
| (3.79) | (-0.37) | (-1.23) | ||||
| SCE | .003** | -.028 | -.001 | |||
| (2.10) | (-0.52) | (-1.13) | ||||
| CEE | .108*** | 1.097 | .000 | |||
| (7.17) | (1.16) | (-0.03) | ||||
| ROE | .001*** | .001*** | .021 | .021 | .000*** | .000*** |
| (7.39) | (6.93) | (1.43) | (1.39) | (-7.64) | (-7.53) | |
| Size | .007 | .012 | -1.126*** | -1.063*** | .025*** | .025*** |
| (0.90) | (1.61) | (-3.73) | (-3.60) | (4.43) | (4.41) | |
| Lev | -.001 | -.001 | .464*** | .464*** | .003*** | .003*** |
| (-1.42) | -1.36) | (3.14) | (3.15) | (3.70) | (3.70) | |
| Constant | -.028 | -.161* | 15.957*** | 14.568*** | .214*** | .215*** |
| (-0.29) | (-1.69) | (4.07) | (3.80) | (2.91) | (2.85) | |
| Number of obs | 10,950 | 10,939 | 10,950 | 10,939 | 10,950 | 10,939 |
| Mean dep var | 0.063 | 0.063 | 2.802 | 2.804 | 0.549 | 0.549 |
| SD dep var | 0.105 | 0.105 | 7.369 | 7.372 | 0.190 | 0.189 |
| R-squared | 0.228 | 0.300 | 0.253 | 0.254 | 0.097 | 0.097 |
| F-test | 22.134 | 34.193 | 6.807 | 3.875 | 28.040 | 14.880 |
| Prob > F | 0.000 | 0.000 | 0.001 | 0.002 | 0.000 | 0.000 |
Models 1 and 2 (ROA) show that while ROE has a significant influence on ROA, the "size" and "lev" variables are not significant. If we compare model 1 with model 2, we see that all the variables making up the VAIC (HCE, SCE, CEE) are significant and that the goodness of fit of the model (R-squared) increases from 22.8% to 30%.
Models 3 and 4 (MB) show that all the control variables (“ROE, "size" and "lev") are significantly related to MB. However, if we compare model 3 with model 4, we note that the variables making up the VAIC (HCE, SCE, CEE) are not significant and that the predictive precision of the model (R-square) increases negligibly from 25.3% to 25.4%.
Models 5 and 6 (TbQ) show a situation similar to the previous one. All the control variables ("ROE," “size”, and “lev") are significantly related to TbQ. However, if we compare model 5 with model 6, we note that none of the variables that make up the VAIC (HCE, SCE, CEE) are significant and that the explanatory capacity of the model (R-square) increases only to 9.7%.
In summary, hypothesis 1 (H1), which concerns positive relations between the VAIC and return on assets (ROA), is confirmed. The second hypothesis (H2), which concerns a weaker positive relation between the VAIC and market value (MB and TbQ), is strongly confirmed, as no statistical significance is found.
Conclusion
In both scientific evolution and natural evolution, the proposal of new models is as important as their selection. However, the VAIC model seems to have completely bypassed this second phase. In fact, from our original quali-quantitative meta-analysis of the relevant literature, we discovered that scholars use the VAIC as if it were an effective tool for measuring IC without prior validation. Moreover, they often present statistical analyses concisely without specifying whether major potential biases have been controlled. Finally, the results they find are very contradictory.
Therefore, we first investigated the coherence of the VAIC from an epistemological standpoint by verifying that the VAIC has nothing to do with IC and its measurement. However, we have also verified that even as a mere measure of efficiency, the VAIC entails serious mathematical issues. Finally, using a large sample (10,950 observations) of listed European companies, we empirically verify that the VAIC has no significant relation with unexpressed market value in financial statements (the market-to-book ratio and Tobin's Q) but only with profitability (ROA).
In summary, this research concludes that the VAIC has nothing to do with the value of IC. It is only a biased measure of efficiency, and it does not have any ability to estimate knowledge and, therefore, to relate market value to IC. Thus, we believe that it is necessary to rethink the use of the VAIC model, both as an IC indicator and as a measure of efficiency.
References
Al-Musali, M. A. K., & Ismail, K. N. I. K. (2014). Intellectual capital and its effect on financial performance of banks: Evidence from saudi arabia. Procedia-Social and Behavioral Sciences, 164, 201-207.
Indexed at, Google Scholar, Cross Ref
Andriessen, D. (2004). Making sense of intellectual capital: Designing a method for the valuation of intangibles. Routledge.
Ariff, A. H. M., Islam, A., & van Zijl, T. (2016). Intellectual capital and market performance: The case of multinational R&D firms in the US. The Journal of Developing Areas, 50(5), 487-495.
Indexed at, Google Scholar, Cross Ref
Bansal, D., & Singh, S. (2020). Impact of intellectual capital on financial performance of the Indian software sector. Asia-Pacific Management Accounting Journal (APMAJ), 15(1), 68-95.
Indexed at, Google Scholar, Cross Ref
Bayraktaroglu, A. E., Calisir, F., & Baskak, M. (2019). Intellectual capital and firm performance: An extended VAIC model. Journal of intellectual capital, 20(3), 406-425.
Indexed at, Google Scholar, Cross Ref
Bharathi Kamath, G. (2008). Intellectual capital and corporate performance in Indian pharmaceutical industry. Journal of Intellectual Capital, 9(4), 684-704.
Indexed at, Google Scholar, Cross Ref
Boujelbene, M. A., & Affes, H. (2013). The impact of intellectual capital disclosure on cost of equity capital: A case of French firms. Journal of Economics Finance and Administrative Science, 18(34), 45-53.
Indexed at, Google Scholar, Cross Ref
Celenza, D., & Rossi, F. (2014). Intellectual capital and performance of listed companies: Empirical evidence from Italy. Measuring Business Excellence, 18(1), 22-35.
Indexed at, Google Scholar, Cross Ref
Dogan, M., & Kevser, M. (2020). Analysis of the relationship between intellectual capital and firm performance: An empirical research on Borsa Istanbul. PressAcademia Procedia, 12(1), 21-26.
Indexed at, Google Scholar, Cross Ref
Dzenopoljac, V., Yaacoub, C., Elkanj, N., & Bontis, N. (2017). Impact of intellectual capital on corporate performance: evidence from the Arab region. Journal of intellectual capital, 18(4), 884-903.
Indexed at, Google Scholar, Cross Ref
Edvinsson, L., & Malone, M. S. (1997). Intellectual capital: Realizing your company's true value by finding its hidden roots.
Firer, S., & Williams, S. M. (2003). Intellectual capital and traditional measures of corporate performance. Journal of intellectual capital, 4(3), 348-360.
Indexed at, Google Scholar, Cross Ref
Gan, K., & Saleh, Z. (2008). Intellectual capital and corporate performance of technology-intensive companies: Malaysia evidence. Asian journal of business and Accounting, 1(1), 113-130.
Hamdan, A. (2018). Intellectual capital and firm performance: Differentiating between accounting-based and market-based performance. International Journal of Islamic and Middle Eastern Finance and Management, 11(1), 139-151.
Indexed at, Google Scholar, Cross Ref
Hansen, C., Steinmetz, H., & Block, J. (2022). How to conduct a meta-analysis in eight steps: A practical guide. Management Review Quarterly, 1-19.
Indexed at, Google Scholar, Cross Ref
Iazzolino, G., & Laise, D. (2013). Value added intellectual coefficient (VAIC) A methodological and critical review. Journal of Intellectual Capital, 14(4), 547-563.
Indexed at, Google Scholar, Cross Ref
Joshi, M., Cahill, D., Sidhu, J., & Kansal, M. (2013). Intellectual capital and financial performance: an evaluation of the Australian financial sector. Journal of intellectual capital, 14(2), 264-285.
Indexed at, Google Scholar, Cross Ref
Kai Wah Chu, S., Hang Chan, K., & Wu, W. W. (2011). Charting intellectual capital performance of the gateway to China. Journal of intellectual capital, 12(2), 249-276.
Indexed at, Google Scholar, Cross Ref
Kaplan, A. (1964), The Conduct of Inquiry, Harper & Row, New York, NY.
Indexed at, Google Scholar, Cross Ref
Khan, A. M. (2018). An empirical study of the impact of intellectual capital on the financial performance of the Indian IT sector. Corporate finance, 12(1), 7-19.
Indexed at, Google Scholar, Cross Ref
Kuhn, T. S. (1962). Historical Structure of Scientific Discovery: To the historian discovery is seldom a unit event attributable to some particular man, time, and place. Science, 136(3518), 760-764.
MacCorquodale, K., & Meehl, P. E. (1948). On a distinction between hypothetical constructs and intervening variables. Psychological review, 55(2), 95.
Indexed at, Google Scholar, Cross Ref
Maditinos, D., Chatzoudes, D., Tsairidis, C., & Theriou, G. (2011). The impact of intellectual capital on firms' market value and financial performance. Journal of intellectual capital, 12(1), 132-151.
Indexed at, Google Scholar, Cross Ref
Mahdi Saleh, H. (2020). The role of corporate governance on the relationship between intellectual capital performance and firm value: Pre and post of mccg 2017 in malaysia. International Journal of Psychosocial Rehabilitation, 24(6), 1617-1637.
Marzo, G. (2022). A theoretical analysis of the value added intellectual coefficient (VAIC). Journal of Management and Governance, 26(2), 551-577.
Indexed at, Google Scholar, Cross Ref
Mohammad, H. S., Bujang, I., & Hakim, T. A. (2018). The impact of intellectual capital on financial performance of Malaysian construction firms. International Journal of Academic Research in Business and Social Sciences, 8(5), 173-186.
Indexed at, Google Scholar, Cross Ref
Nadeem, M., Gan, C., & Nguyen, C. (2018). The importance of intellectual capital for firm performance: Evidence from Australia. Australian Accounting Review, 28(3), 334-344.
Indexed at, Google Scholar, Cross Ref
Nagel, E. (1961). The structure of science: Problems in the logic of scientific explanation. Brace and World, Harcourt, N.Y.
Nassar, S. (2020). Impact of intellectual capital on corporate performance. European Journal of Business and Management Research, 5(6).
Indexed at, Google Scholar, Cross Ref
Ousama, A. A., & Fatima, A. H. (2015). Intellectual capital and financial performance of Islamic banks. International Journal of Learning and Intellectual Capital, 12(1), 1-15.
Indexed at, Google Scholar, Cross Ref
Ozkan, N., Cakan, S., & Kayacan, M. (2017). Intellectual capital and financial performance: A study of the Turkish banking sector. Borsa Istanbul Review, 17(3), 190-198.
Indexed at, Google Scholar, Cross Ref
Pearson, K. (1892), The grammar of science, published in hardback, second edition and third published by Adam & Charles Black, London.
Pulic, A. (1998). Measuring the performance of intellectual potential in knowledge economy. In 2nd McMaster word congress on measuring and managing intellectual capital by the Austrian team for intellectual potential (pp. 1-20).
Pulic, A. (2000). VAIC™–an accounting tool for IC management. International journal of technology management, 20(5-8), 702-714.
Indexed at, Google Scholar, Cross Ref
Pulic, A. (2008). The principles of intellectual capital efficiency-A brief description. Croatian Intellectual Capital Center, Zagreb, 76.
Razafindrambinina, D., & Anggreni, T. (2011). Intellectual capital and corporate financial performance of selected listed companies in Indonesia. Malaysian Journal of Economic Studies, 48(1), 61-77.
Silvestri, A., & Veltri, S. (2014). Overcoming the additive property of value added intellectual capital (VAICTM) methodology. International Journal of Learning and Intellectual Capital, 11(3), 222-243.
Indexed at, Google Scholar, Cross Ref
Skandia, A. F. S. (1994). Visualizing intellectual capital in skandia (supplement to skandia’s annual report).
Smriti, N., & Das, N. (2018). The impact of intellectual capital on firm performance: A study of Indian firms listed in COSPI. Journal of Intellectual Capital, 19(5), 935-964.
Indexed at , Google Scholar, Cross Ref
Stahle, P., Stahle, S., & Aho, S. (2011). Value added intellectual coefficient (VAIC): A critical analysis. Journal of Intellectual Capital, 12(4), 531-551.
Indexed at, Google Scholar, Cross Ref
Weqar, F., & Haque, S. I. (2020). Intellectual capital and corporate financial performance in india's central public sector enterprises. International Journal of Learning and Intellectual Capital, 17(1), 77-97.
Indexed at, Google Scholar, Cross Ref
Xu, J., & Wang, B. (2018). Intellectual capital, financial performance and companies’ sustainable growth: Evidence from the Korean manufacturing industry. Sustainability, 10(12), 4651.
Indexed at, Google Scholar, Cross Ref
Xu, J., & Wang, B. (2019). Intellectual capital and financial performance of Chinese agricultural listed companies. Custos e Agronegocio On Line, 15(1), 273-290.
Indexed at, Google Scholar, Cross Ref
Xu, J., & Zhang, Y. (2021). Does intellectual capital measurement matter in financial performance? An investigation of Chinese agricultural listed companies. Agronomy, 11(9), 1872.
Indexed at, Google Scholar, Cross Ref
Zhang, L., Yu, Q., Jin, Z., & Xu, J. (2021). Do intellectual capital elements spur firm performance? Evidence from the textile and apparel industry in China. Mathematical Problems in Engineering, 2021, 1-12.
Indexed at, Google Scholar, Cross Ref
Received: 24-Nov-2023 Manuscript No. AAFSJ-23-14207; Editor assigned: 25-Nov-2023, PreQC No. AAFSJ-23-14207(PQ); Reviewed: 08-Dec-2023, QC No. AAFSJ-23-14207; Revised: 12-Dec-2023, Manuscript No. AAFSJ-23-14207(R); Published: 20-Dec - 2023