Research Article: 2021 Vol: 25 Issue: 5
Evaluating the Platinum and Natural Gas Relationship
Surendran Pillay, University of KwaZulu-Natal
Abstract
An exploratory study was conducted to investigate the relationship between the real platinum price and natural gas over 60 years in order to determine the nexus between both commodities. Both commodities have grown in economic importance over the last 50 years, both as investment and speculative assets. The study employed the GARCH and EGARCH models in determining the relationship between platinum and natural gas. The results of the testing revealed that a 10% increase in the natural gas price returns leads to a 0.17% increase in the platinum price. Furthermore, the overall volatility of platinum and natural gas price from January 1960 to October 2020 was increased.
Keywords
Platinum, Natural gas, Asymmetry, GARCH.
Introduction
There is an ever-increasing demand for alternative investment options, specifically commodity-like investment products such as platinum and natural gas. This is primarily so because these products are highly relevant and concomitant with global economic growth. For instance, both platinum and natural gas products are essential in several manufacturing processes as well as everyday consumables among a diverse market that cuts across geographical zones and borders (Gereffi, 2013). Apart from their essentiality in meeting broad and general multifaceted needs of organisations and individuals, platinum and natural gas products also serve as a veritable tool among financial institutions such as insurance companies, banks, asset management firms etc., for hedging and diversifying various types of risks embedded in portfolios and funds (Kumar et al., 2019). This is largely due to their perceived low correlation with classical financial investment products such as stocks, bonds and money market instruments.
Platinum
Unlike gold and silver, which have predominantly been used by humans to facilitate transactions before the advent of fiat money, the prominence of platinum within the financial sector has a relatively recent history and popularity. Kruse et al. (2017) noted that a plausible explanation for this could be the rarity of platinum, as it is estimated that platinum is about 15-20 times scarcer than gold. At present, South Africa is the largest platinum supplier in the world with a contribution of more than 75% of globally mined platinum. This is followed by Russia and Zimbabwe (Hamann, 2004).
Platinum-Group Metals (PGMs) include precious metals such as platinum, palladium, rhodium, iridium, ruthenium, and osmium. This group of precious metal elements belongs to the 5th and 6th periods in the periodic table that normally occur together in nature. Most PGMs are silvery white except for osmium and ruthenium, which are silvery grey (Bao, 2020). Also, these metals have exquisite and similar physical and chemical characteristics, such as resistance to corrosion, catalytic features and high melting points, which makes them essential to several manufacturing organisations and industries, such as automobiles, petroleum, chemicals, electronics, glass manufacturing and medical implants. Typically, platinum-group metals are mostly used in the production of catalytic converters, which aids in the reduction of carbon monoxide, hydrocarbon, and nitrous oxide emissions in automobile exhaust (Bao, 2020). Likewise, platinum, palladium, and rhodium in the form of coins, bars, stocks and exchange-traded funds are also used as alternative investments options, due to their high demand and wide-range applicability, tradability, and durability to store value over time (Zientek & Loferski, 2014).
Natural gas
Like oil and coal, natural gas is widely considered a pivotal commodity that drives the global economy. The usage of natural gas ranges from its domestic use such as in heating and cooking to its industrial use such as in electricity generation as well as being vital to the fertilizer and fabrics industry (Wang et al., 2019). The significant use of natural gas is a common trajectory consistent around the world, which has witnessed an increasing upward trend since the post financial crisis era. For instance, in the United States of America, the use of natural gas makes up to 30% of its annual energy requirements (Wiggins & Etienne, 2017). Similarly, the rise of emerging economies such as China, has further contributed to the increase in global gas consumption by 3% (Liang et al., 2012). Siddiqui (2019) suggests that the corresponding increase in global gas production could be attributed to advancements in technology, as well as the improved supply chain system via LNG (liquefied natural gas) ocean tankers.
In recent times, la Torre-Torres et al. (2020) asserted that natural gas has become a popular choice among energy futures, that are adopted for hedging commodity price risk, as well as considered for investing and speculation purposes. This is largely due to their close linkage with economic activity and general prices, as well as being an effective source for portfolio diversification. This research paper considers the interrelationship between platinum and natural gas prices over an extensive period of time. Subsequent sections of this paper include the literature review, research methodology, research analysis and the conclusion.
According to Eryi?it (2017), the relationship between platinum and natural gases can be understood from the perspective of inflation and exchange rate volatilities that affect corporate decisions as well as portfolio performance. While the inflationary pressures channel tends to be the standard empirical evidence that explains the interrelationship between energy and metals markets (Popp et al., 2018), the foreign exchange effects best reflect these pressures in corporate positions. For instance, when inflationary pressures are induced by increasing prices of natural gases, this could result in fluctuations in exchange rates, input costs and unstable profits. Aruga & Kannan (2020) suggested that in order to stabilise profits and these fluctuations, investing in precious metals such as platinum could be a viable strategic choice to hedge against these risks.
Study Problems
Historically, precious metals have acted as “safe havens” for long-term investors and platinum has been found to act as a safe haven for investors when gold does not act as a safe haven (Lucy & Li, 2015). Similarly, natural gas has been seen as an increasing viable alternative to oil given the cost saving relative to oil (Mkinsey, 2021). Accordingly, natural gas is being seen as the preferred fossil fuel of the future. There is a strong relationship between natural gas and platinum since hydrogen fuel cells (a natural gas product which can be used to power mines and cars) requires platinum as a key component (Anglo, 2021) and on the reverse side, electricity generated from the burning of natural gas is a significant input cost in the mining of metals (including platinum) (Anon, 2021). This is in addition to the relationship that exists from the perspective of inflation and exchange rate volatility noted by Erygit (2017). Despite their strong interrelationship, the pricing nexus between both commodities remains unknown.
Study Significance
Given the increasing demand for platinum and natural gas over the last 50 years, as well as the fact that both commodities may be considered as “safe haven” investments by long-term investors, the interrelationship between both commodities could prove useful for both long-term and short-term investors who wish to invest in either commodity.
Study Objectives
The primary objective of the study was to determine the pricing nexus between platinum and natural gas prices over a sustained period of time.
Literature Review
In a study by Eryi?it (2017), the nexus between prices of precious metals such as gold, platinum, silver, and palladium were considered vis-à-vis the prices of natural gases. This study considered both the short-term and long-term interrelationships that exist among these alternative financial investments. Using the vector autoregression (la Torre-Torres et al.) and the vector error correction models, the researcher divided the variables into two groups of precious metals and energy, and further performed both the unit root and cointegration tests. Findings from the analysis suggest that there is no long-term correlation between natural gases and precious metals.
Bhatia et al. (2018) studied the dynamic relationship between crude oil and precious metals (platinum, silver, palladium and gold) using the dynamic conditional correlation-generalized autoregressive conditional heteroscedasticity (DCC-GARCH) as well as the asymmetric DCC. The research inquiry, which considered a dataset from January 2000 to March 2017, sought to develop optimal hedge ratios and portfolio weights that are applicable to the dataset. Among the findings of the study was evidence of the existence of a dynamic conditional correlation between crude oil and precious metals. Also, it was observed that this dynamic correlation increased during the period of the financial crisis. Furthermore, it was noted that the precious metals behaved as a single asset class during times of uncertainty. Lastly, the study concluded that silver and palladium evidence better hedging capability than gold.
Kumar et al. (2019) concluded that there is no long-run cointegration between crude oil, natural gases and stock prices in India. This conclusion was based on the empirical findings using a multivariate generalised autoregressive conditional heteroscedasticity (MGARCH) model. While considering different types of time-varying GARCH models, the study noted that the VARMA-DCC-GARCH model offers greater efficiency than the CCC model with asymmetry in estimating time-varying correlations.
Naeem et al. (2019) investigated the existence of regime changes in precious metals such as platinum, silver, palladium and gold by applying Markov Switching GARCH (MSGARCH) models for modelling volatility. The researchers fitted over 72 MSGARCH models with different regimes and utilised the Akaike information criteria (AIC) as the basis for selecting the best model. Upon fitting and analysis, the study found that the regime switching GARCH models outperformed the single-regime GARCH models for prediction of value-at-risk cases.
Aruga & Kannan (2020) sought to decipher if gold and platinum prices are linked with crude oil markets in the post 2008 global financial crisis. To do this, the researchers utilised cointegration methods to evaluate the linkage between gold prices and oil market volatility in the long run. Likewise, the linkage between platinum prices and oil market volatility in the long run was also analysed. Findings from the analyses suggest that although there is an observable linkage between the platinum market and the crude oil market in the long run, no linkage was found between the gold market and crude oil market in the long run period of the post 2008 global financial crisis.
Meher et al. (2020) examined the impact of COVID-19 on price volatility of crude oil and natural gas listed on the multi-commodity exchange of India. The study which utilised a dataset from May 01, 2017 to April 30, 2020 made interesting and novel findings about the effects of Covid-19 on price volatility of crude oil and natural gases. A notable finding of the research investigation was the presence of the leverage effect of COVID-19 on the price volatility of crude oil in the given period. Conversely, there was no finding of leverage effect on price volatility of natural gases in the given period.
Xiao (2020) considered forecasting extreme risks using regime switching GARCH models for both developed and emerging crude oil markets. The research study inquired about the application of regime-switching and single-regime GARCH models for extreme risk predictions in the global crude oil market. The results of the research analysis found that unlike the single-regime, the regime-switching GARCH type models are more suitable for the developed and emerging crude oil markets as they effectively capture the dynamic structures of extreme risks in different markets. Hence, it was concluded that the regime-switching GARCH model outperforms the single-regime GARCH model in predicting extreme risks in both emerging and advanced crude oil markets.
Carpinteyro et al. (2021) sought to develop a stochastic volatility model that can help to provide more understanding of the dynamics of returns of gold, silver, and platinum over the period 1994-2019. In order to achieve this, the researchers utilised both the Jump-GARCH and Markov regime switching models. Upon analysis, the empirical findings of the analysis were that all precious metals exhibited low levels of volatility over an extended period of time and past returns affect both current and future returns. It was also noted that silver and platinum explicated the largest jump sizes whilst gold evidenced the least level of volatility as measured by its percentage of jump size in comparison to other precious metals.
In a comparative study, Fa?dzi?ski et al. (2021) compared GARCH type models with machine learning techniques such as the support vector regression (SVR) model to best predict volatility of energy commodities such as natural gases, crude oil, heating gas, and gasoline. While it was depicted that the GARCH models were more accurate when applied based on the Parkinson estimator, the SVR model proved more superior when determined by hyperparameters. Thus, the study concludes that the accuracy of volatility predictions is significantly influenced by the applied proxy for measuring volatility.
Data and Methodology
Data Description
The endogenous (response) variables for this study were the monthly price returns of natural gas and platinum in the South Africa market. In order to examine the relation between natural gas and platinum, the researcher measured natural gas and platinum price in dollar. The data was obtained from the International Monetary Fund data base. The data was collected on monthly basis over the period from 1960 January to 2020 October. The choice of sample period was due to the availability of data. In order to check for the causal nexus between natural gas and platinum, return on natural gas and return on platinum were used and employed the GARCH and EGARCH models.
Methods
Autoregressive conditional heteroscedasticity models
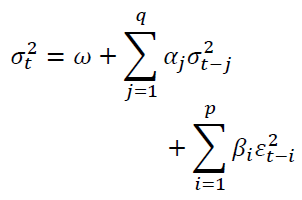
The classical econometric models keep the variance of the disturbance term constant over time, but most of the economic and financial time series exhibit volatility clustering, i.e. in some periods, an unusually high volatility is followed by more tranquil periods of low volatility. So in such cases, it is better not to examine the unconditional variance and rather to examine the conditional variance. The ARCH models were introduced by Engle (Engle, 1982) and they are specifically designed to model and forecast conditional variances. The GARCH (general autoregressive conditional heteroscedastic) model is an extension of the ARCH model that recognises the difference between unconditional and conditional variance allowing for the conditional variance to change over time as a function of past errors (Taylor, 1987; Bollerslev, 1986). According to Brooks (2019), GARCH models tend to be more parsimonious, meaning that they accomplish a better prediction with less variables, and avoid overfitting. These models also allow both for a more flexible lag structure and a longer memory. The GARCH model is a non-linear model.
Basic procedures for GARCH family model building
The framework used to investigate the pattern of monthly price returns of natural gas and platinum volatility follows the following Box and Jenkins approaches: test for the presence stationarity of the data, test for ARCH effect, GARCH family order selection (p, q), model adequacy checking and forecasting.
Modelling conditional volatility of natural gas and platinum price
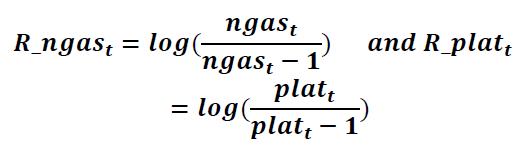
Estimation of volatility is arguably one of the most important topics in economic and financial time series data. The volatility of financial assets is a key feature for measuring risk underlying many investment decisions in financial practice (Gaunersdorfer and Hommes, 2007). In this study, the monthly returns of each series could be calculated as
 (1)
(1)
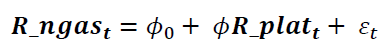
Where, ngas is monthly natural gas price and R_ngas is the return on natural gas price, plat is the monthly platinum price and R_plat is the return on platinum price. The researcher tested the relationship between platinum and natural gas using the EGARCH and GARCH models. One of the major advantages of these models is that they jointly estimate a conditional mean and variance.
The GARCH (q,p) model can be given as
 (2)
(2)
 (3)
(3)
Where ω is a constant term,  is the ARCH term (i.e. the lag of the squared residual from the mean equation), and
  is the GARCH term (i.e. last period's forecast variance). Equation (2) is written as a function of exogenous variables (in this study it is only R_platt) with an error term. That is
 (4)
(4)
Equation (4) represents predetermined or exogenous variables that are included in the mean equation. If the study included the conditional standard deviation or variance into the mean equation, the GARCH-M model would be obtained which was introduced by Engle (1982):
 (5)
(5)
Moreover, the study also used the exponential GARCH model, which was introduced by Nelson (1991), ) and can be written as follows:
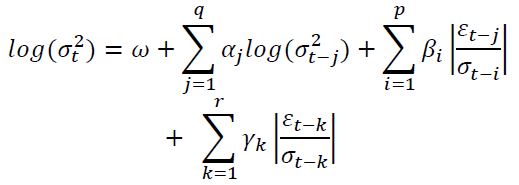 (6)
(6)
Further, the also used IGARCH and asymmetric IGARCH models to see the robustness of the results. Diagnostic checking (the last step) involves assessing the validity of the fitted and identified model(s) through the possible statistically significant test on the residuals to ascertain their consistency with the white noise, e.g. the Box Ljung Q statistics (Ljung and Box, 1978). Finally, the best fitting model would be selected according to either the BIC, AICc, or AIC value (Akaike, 1974; Schwarz, 1978), i.e. the model that results in the lowest value of the criteria. The parameters of the selected model were chosen with the help of maximum likelihood estimation and forecast was made using the model of best fit. The AIC and BIC are based on the likelihood function as well as including a different penalty term, and expressed as follows:

Where n is the number of observations, k is the number of estimated parameters and  maximises the value of the likelihood function.
Empirical Results and Discussion
Exploratory Analysis
Table 1 depicts a summary of the statistics of natural gas and platinum price. The minimum and maximum natural gas prices were 3.62 and 222.21 (in dollar) respectively, whereas the minimum and maximum platinum prices were 78.50 and 2052.40 (in dollar) respectively. Thus, the overall average natural gas price (49.21) was greater than the platinum price (557.70). There was also high volatility of the platinum price (459.7) compared to the volatility of the natural gas price (41.42).
| Table 1Summary Statistics of Natural Gas and Platinum | ||
| Statistics | Natural gas | Platinum |
| Minimum | 3.62 | 78.50 |
| Maximum | 222.15 | 2052.40 |
| Mean | 49.21 | 557.70 |
| Median | 41.62 | 413.60 |
| Standard deviation | 41.42 | 459.7 |
| Skewness | 1.09 | 1.13 |
| Kurtosis | 1.15 | 0.50 |
| Normality test Kolmogorov Smirnov |
0.136*(<0.010) | c0.158*(<0.010) |
| Randomness test Wald-Wolfowitz Runs test |
-5.75*(0.01) | -4.33*(0.01) |
| Bartels test | -6.35*(0.001) | -5.22*(0.001) |
| Unit root test Augmented Dickey-Fuller (ADF) test |
-2.4976 (0.3677) | -2.3182 (0.4436) |
| Philipps-Perron (Popp et al.) test | -25.006 (0.02425) | -17.181 (0.1513) |
The results reported in Table 1 also show normality, randomness and stationarity test of both natural gas and platinum. The normality test was computed using the Kolmogorov Smirnov test and it states that the normality assumption failed to satisfy (p-value<0.05). As the randomness test of the data needs to be checked before applying time series, the randomness test of natural gas and platinum price was determined using Wald-Wolfowitz Runs and Bartels test statistic. Through both of these test statistics, there was no any evidence to accept the null hypothesis (p-value<0.05). This indicates that natural gas and platinum price over time were non-random. The stationarity test under unit root test was tested using the ADF and PP test of statistic. The researcher performed both tests to check the property of the data series. At the 5% level of significance, the null hypothesis could not be rejected. Thus, both natural gas and platinum price series are not stationary in the level form. This is also evident from time series plot in Figure 1.

Figure 1 Time Series Plot of Natural Gas (Left) and Platinum (Right)
The time series plot of monthly data of natural gas and platinum price from January 1960 (1960MO1) to October 2020 (2020M10) is illustrated in Figure 1. This indicates that the Figure returns the trends of prices of the two commodities over the last 60 years. For both commodities, the price looks like an increasing trend but not nowadays. In early 1960, the natural gas and platinum prices were static and increased at the end of 1970. After 1970, the prices of both commodities became highly volatile and decreased after June 2002. In the meantime, the trends of natural gas and platinum prices over 60 years appear closer.
The time series plot of return series of both natural gas and platinum, which is presented in Figure 2, looks stationary. The figure shows the monthly return on natural gas and platinum. From Figure 2 one can understand that the return on platinum is highly volatile, while the return on natural gas shows less volatility. The return on platinum shows that during the period of financial crisis (1978-2020) the platinum was more volatile than during other periods.

Figure 2 Return Time Series Plot of Natural Gas (Left) And Platinum (Right)
In order to compare the shapes of probability distribution of the two commodities, a price probability plot was employed (see Figure 3). When comparing the two distributions, if the points in the probability plot lie approximately on the line y=x, then both distributions have a similar pattern. If the probability plot lies exactly on a line, then the distributions are linearly related. The probability plots results revealed in Figure 3 suggest that the natural gas and platinum prices do not share common and similar distributions.

Figure 3 Probability Plot or Return Natural Gas (Black) and Platinum (Red)
Several models might be proposed for a single time series data. The model specification can generally be determined using the autocorrelation function (ACF) and/or partial-autocorrelation function (PACF). In this study, the PACF was used. This PACF was used to detect the appropriate order of previous data and shocks that significantly related to the current data. The PACF in Figure 3 reveal that the estimated partial correlation at first lag is quite out from the horizontal bar for both platinum and natural gas prices. This indicates that current platinum and natural gas prices are significantly interrelated with previous platinum and natural gas prices respectively in Figure 4.

Figure 4 Return time series plot on natural gas (right) and platinum (left)
Parameter-estimation
Fitting GARCH models is usually trivial using modern software such as the rugarch package for R. However, checking whether the fitted model is any good is less trivial since a range of diagnostic tests must be applied and, most importantly, understood to ensure that the model captures the intended behaviour. The goodness of fit test of the models in Table 2 was checked using log-likelihood, Ljung-Box statistics for serial correlation (Q(1) and Q(5)), LjungBox statistics for serial correlation (Q2(1) and Q2(5)), sign bias test and Nybolm stability test. At the first step, using the Ljung-Box Q-statistics and Ljung-Box Q2-statistics for 1 and 5 lags, the study tested the presence of serial correlation. The results of the Ljung-Box Q-statistics and Ljung-Box Q2-statistics show the presence of serial correlation in the data. In the next step, GARCH(1,1), EGARCH(1,1), GARCH-M(1,1), and IGARCH(1,1) were conducted, using the maximum likelihood method (see Table 2). However, the significant effects of natural gas price on platinum price are revealed in the mean equation of EGARCH(1,1).
| Table 2Estimation Result of the Model (Platinum on Natural Gas) | ||||
| GARCH (1,1) | EGARCH (1,1) | GARCH-M (1,1) | IGARCH-M (1,1) | |
| Mean Equationφ0 | 0.0007(0.0005) | -0.0001 (0.0018) | 0.0000 (0.0001) | 0.0000 (0.0005) |
| φ1 | 0.0379(0.0276) | 0.0172 (0.0026)** | 0.0000 (0.0002) | 0.0009 (0.0038) |
| δ(GARCH term) | -0.1253(4.2531) | |||
| Variance Equationω | 0.0012 (0.0000)*** | 0.0037(0.0023) | 0.0000 (0.0001) | 0.0000 (0.0000) |
| α | 0.1911 (0.0728) | -0.2358(0.0180)* | 0.7088 (0.1088)* | 0.6939 (0.0310)*** |
| β | 0.8079 (0.0524)** | 1.0000 (0.0002)** | 0.2839 (0.0925)* | 0.3061 (0.0149) |
| γ | 0.1731 (0.0335) | |||
| Shape | 2.1000 (0.0187)*** | 2.9182 (0.1755) | 2.9017 (0.0869)** | |
| Model fitness Q(1) |
23.1300*** | 7.1990* | 0.0013 | 0.0282 |
| Q(5) | 25.0300** | 9.9190** | 0.0039 | 0.0352 |
| Q2(1) | 0.0013* | 0.0007** | 0.0014 | 0.0275 |
| Q2(5) | 2.8215* | 0.0267** | 0.0042* | 0.0834 |
| AIC | -5.0852 | -5.9745 | -5.6421 | -5.5886 |
| BIC | -5.0537 | -5.9368 | -5.5981 | -5.5571 |
| Adjusted Pearson test | 597.9*** | 554.6*** | 821.2*** | 865.6*** |
| Nyblom stability test | 3.385** | 72.0913*** | 90.4553*** | 37.1138*** |
The mean equation of EGARCH (1,1) shows that an increase in natural gas price has a positive effect on platinum. A 10% increase in the natural gas price returns leads to a 0.17% increase of platinum. This result is significant at the 5% level of significance. Coming to the variance equation, the coefficient γ, which measures the asymmetry, is found to be insignificant at the 5% level. This implies that shocks to the natural gas price do not have an asymmetric effect, which means positive and negative shocks have a similar effect on the natural gas price in terms of magnitude. Besides, the study found that there is residual serial autocorrelation. The result form GARCH-M (1,1) as shown in the fifth column of Table 2, is that the coefficient φ is found to be insignificant which implies that platinum price volatility has no impact on the natural gas price itself. Both Q statistics tests suggest that the residual is free from autocorrelation. Information criteria make it possible to avoid unnecessarily choosing a very complex model. Everything should be made as simple as possible but not simpler. Hence, when there are several GARCH models, it is possible to make use of information criteria to choose the best fit model. A model which has the lowest information criteria is the best fit model of the data. As a result, EGARCH(1,1) is the preferred model. However, the adjusted Pearson goodness of fit test (p-value less 0.05) suggests that there is scope if the model is improved. High values of the Nyblom stability test statistics for all models supported instability of the data.
Key: An asterisk (***, **, and *) indicates significance at the 1%, 5%, and 10% level respectively. Q (1), and Q(5) are the Ljung-Box statistics for serial correlation in the model residuals computed with 10 and 20 lags, respectively. Q2(1), and Q2(5) are the LjungBox statistics for serial correlation in the model squared residuals computed with 1 and 5 lags, respectively.
Forecasting the Volatility
Based on the best fitted model, the volatility for ten months ahead was predicted. Table 3 reveals the volatility increases with an increasing rate in the next 10 months as well. For both commodities, the price had an increasing trend till the end of 1970 while both commodities displayed a decreasing trend for the past five decades (after 1970).
| Table 2Estimation Result of the Model (Platinum on Natural Gas) | ||||
| GARCH (1,1) | EGARCH (1,1) | GARCH-M (1,1) | IGARCH-M (1,1) | |
| Mean Equationφ0 | 0.0007(0.0005) | -0.0001 (0.0018) | 0.0000 (0.0001) | 0.0000 (0.0005) |
| φ1 | 0.0379(0.0276) | 0.0172 (0.0026)** | 0.0000 (0.0002) | 0.0009 (0.0038) |
| δ(GARCH term) | -0.1253(4.2531) | |||
| Variance Equationω | 0.0012 (0.0000)*** | 0.0037(0.0023) | 0.0000 (0.0001) | 0.0000 (0.0000) |
| α | 0.1911 (0.0728) | -0.2358(0.0180)* | 0.7088 (0.1088)* | 0.6939 (0.0310)*** |
| β | 0.8079 (0.0524)** | 1.0000 (0.0002)** | 0.2839 (0.0925)* | 0.3061 (0.0149) |
| γ | 0.1731 (0.0335) | |||
| Shape | 2.1000 (0.0187)*** | 2.9182 (0.1755) | 2.9017 (0.0869)** | |
| Model fitness Q(1) |
23.1300*** | 7.1990* | 0.0013 | 0.0282 |
| Q(5) | 25.0300** | 9.9190** | 0.0039 | 0.0352 |
| Q2(1) | 0.0013* | 0.0007** | 0.0014 | 0.0275 |
| Q2(5) | 2.8215* | 0.0267** | 0.0042* | 0.0834 |
| AIC | -5.0852 | -5.9745 | -5.6421 | -5.5886 |
| BIC | -5.0537 | -5.9368 | -5.5981 | -5.5571 |
| Adjusted Pearson test | 597.9*** | 554.6*** | 821.2*** | 865.6*** |
| Nyblom stability test | 3.385** | 72.0913*** | 90.4553*** | 37.1138*** |
Conclusion and Recommendations
The primary objective of the study was to determine the pricing nexus between platinum and natural gas. It was observed that the overall volatility of the platinum and natural gas prices from January 1960 to October 2020 was increased. For both commodities, the price had an increasing trend till the end of 1970 while both commodities displayed a decreasing trend for the past five decades (after 1970). The partial autocorrelation functions suggested that previous platinum and natural gas prices significantly associated with the current platinum and natural gas prices respectively. The empirical results thus confirm that the two commodities are positively correlated.
In order to check for the impact of natural gas on platinum, return on platinum and return on natural gas are used in several GARCH models. The results suggest that an increase in the natural gas price has positive effects on platinum. A 10% increase in the natural gas price returns leads to 0.17% increase of platinum and shocks to natural gas price have a symmetric effect, which means positive and negative shocks have a similar effect on the platinum price in terms of magnitude. Although platinum is regarded as a “safe haven” investment, gold is still widely considered to be the optimal safe haven investment. A future research recommendation would thus be to investigate the pricing nexus between gold and natural gas, or gold and crude oil.
References
- Akaike, H. (1974) A new look at the statistical model identification. IEEE transactions on automatic control 19(6), 716-723.
- Anglo. (2021) Anglo American Platinum Limited pioneers fuel cell technology in underground mining.
- Anon (2021) Minerals Council publishes Facts and Figures Pocketbook.
- Aruga, K., & Kannan, S. (2020) Effects of the 2008 financial crisis on the linkages among the oil, gold, and platinum markets. Cogent Economics & Finance, 8(1), 1807684.
- Bao, D. (2020) Dynamics and correlation of platinum-group metals spot prices. Resources Policy, 68, 101772.
- Bhatia, V., Das, S., & Mitra, S.K. (2018). Crude Oil Hedging with Precious Metals: A Dcc-Garch Approach. Academy of Accounting and Financial Studies Journal, 22(1), 1-8.
- Bollerslev, T. (1986). Generalized autoregressive conditional heteroskedasticity. Journal of Econometrics, 31(3), 307-327.
- Brooks, C. (2019). Introductory econometrics for finance. Cambridge university press.
- Carpinteyro, M., Venegas-Martínez, F., & Aali-Bujari, A. (2021) Modeling precious metal returns through fractional jump-diffusion processes combined with markov regime-switching stochastic volatility. Mathematics, 9(4), 407.
- Engle, R.F. (1982). Autoregressive conditional heteroscedasticity with estimates of the variance of United Kingdom inflation. Econometrica: Journal of the Econometric Society, 987-1007.
- Eryi?it, M. (2017) Short-term and long-term relationships between gold prices and precious metal (palladium, silver and platinum) and energy (crude oil and gasoline) prices. Economic Research-Ekonomska istra?ivanja, 30(1), 499-510.
- Fa?dzi?ski, M., Fiszeder, P., & Orzeszko, W. (2021) Forecasting Volatility of Energy Commodities: Comparison of GARCH Models with Support Vector Regression. Energies, 14(1), 6.
- Gaunersdorfer, A., & Hommes, C. (2007). A nonlinear structural model for volatility clustering. Long memory in Economics. Springer, 265-288.
- Gereffi, G. (2013). A global value chain perspective on industrial policy and development in emerging markets. Duke J. Comp. & Int'l L. 24, 433.
- Hamann, R. (2004). Corporate social responsibility, partnerships, and institutional change: The case of mining companies in South Africa. Natural resources forum. Wiley Online Library, 278-290.
- Kruse, S., Tischer, T., & Wittig, T. (2017). A new empirical investigation of the platinum spot returns. Journal of Smart Economic Growth, 2(2), 141-148.
- Kumar, S., Pradhan, A.K., Tiwari, A.K., et al. (2019). Correlations and volatility spillovers between oil, natural gas, and stock prices in India. Resources Policy, 62, 282-291.
- la Torre-Torres, D., Oscar, V., Galeana-Figueroa, E., et al. (2020) A test of using markov-switching garch models in oil and natural gas trading. Energies, 13(1), 129.
- Liang, F.Y., Ryvak, M., Sayeed, S., et al. (2012) The role of natural gas as a primary fuel in the near future, including comparisons of acquisition, transmission and waste handling costs of as with competitive alternatives. Chemistry Central Journal, 6(1), 1-24.
- Ljung, G.M., & Box, G.E. (1978). On a measure of lack of fit in time series models. Biometrika, 65(2), 297-303.
- Meher, B.K., Hawaldar, I.T., Mohapatra, L., et al. (2020) The impact of COVID-19 on price volatility of crude oil and natural gas listed on multi commodity exchange of India. International Journal of Energy Economics and Policy, 10(5), 422-431.
- Naeem, M., Tiwari, A.K., Mubashra, S., et al. (2019) Modeling volatility of precious metals markets by using regime-switching GARCH models. Resources Policy, 64, 101497.
- Nelson, D.B. (1991). Conditional heteroskedasticity in asset returns: A new approach. Econometrica: Journal of the Econometric Society, 347-370.
- Popp. J., Oláh, J., Farkas, Fekete, M., et al. (2018) The relationship between prices of various metals, oil and scarcity. Energies, 11(9), 2392.
- Schwarz, G. (1978). Estimating the dimension of a model The Annals of Statistics, 6(2), 461–464. URL: http://dx. doi. org/10.1214/aos/1176344136.
- Siddiqui, A.W. (2019). Predicting natural gas spot prices using artificial neural network. 2019 2nd International Conference on Computer Applications & Information Security (ICCAIS). IEEE, 1-6.
- Taylor, S.J. (1987) Forecasting the volatility of currency exchange rates. International Journal of Forecasting, 3(1), 159-170.
- Wang. T., Zhang, D., & Broadstock, D.C. (2019). Financialization, fundamentals, and the time-varying determinants of US natural gas prices. Energy Economics, 80, 707-719.
- Wiggins, S., & Etienne, X.L. (2017). Turbulent times: Uncovering the origins of US natural gas price fluctuations since deregulation. Energy Economics, 64, 196-205.
- Xiao, Y. (2020). Forecasting extreme risk using regime-switching GARCH models: a case from an energy commodity. International Journal of Emerging Markets.
- Zientek, M.L., & Loferski, P.J. (2014). Platinum-Group Elements–So Many Excellent Properties. US Geological Survey Fact Sheet, 3064.