Research Article: 2022 Vol: 28 Issue: 1S
Exchange Rate Volatility and its Impact On the Stock Market in Different Structural Break Periods: The Context of Sri Lanka
Ahamed Lebbe Mohamed Jameel, Management & Science University
Kevin Low Lock Teng, Management & Science University
Citation Information: Mohamed Jameel, A.L., & Lock Teng, K.L. (2022). Exchange rate volatility and its impact on the stock market in different structural break periods: the context of Sri Lanka. Academy of Entrepreneurship Journal, 28(1), 1-12.
Abstract
This study aims to examine the effect of exchange rate volatility on the stock market return volatility of the Colombo Stock Exchange, focusing on the structural break in the US Dollar (USD) exchange rates in terms of Sri Lankan Rupee (LKR). The structural break periods (SBPs) were detected based on structural break dates measured by using the Bai-Perron structural break test. The volatility of the USD exchange rate is used as an independent variable, whereas the All Share Price Index (ASPI) returns of the Colombo Stock Exchange (CSE) is used as a dependent variable in this analysis. The study utilised weekly data from 1997 to 2017. Moreover, we employed the Generalised Auto-Regressive Conditional Heteroscedasticity (GARCH) model to estimate the exchange rate volatility of USD and to explore ER volatility effect on the stock market returns volatility. The study found that (i) the volatility shocks are persistent in the USD exchange rate and ASPI in an extended period and different SBPs. (ii) Sri Lankan stock market is affected by the currency market volatility, but the effect is no homogeneous throughout the extended period of the data, instead, it varies in different SBPs. Freely open ER policy actively contributes to currency market volatility on the Sri Lankan stock market volatility than managed floating ER policy. The study recommends that the findings give necessary implications for the investors, portfolio managers, stockbrokers, and multinational corporations to make significant investment decisions and predict market behavior and take practical preventive actions in the case of volatility and the occurrence of structural breaks in both markets. Further, these findings help policymakers and regulatory authorities design appropriate and strategically policies concerning the currency market in Sri Lanka.
Keywords
Kevin Low Lock Teng, Management & Science University
Introduction
The stock market is one of the primary drivers of economic growth in a country by creating a chance for resources to flow to the most productive investments. The currency market has developed into one of the most important markets in the world, supporting the global movement of a diverse variety of products and services (Aimer, 2019). These two markets are crucial economic progress. Numerous local and worldwide crises have prompted researchers to examine the relationship between the foreign currency market and the stock market worldwide (Tarazi & Hasan, 2015). The scholars have developed models concerning the relationship between foreign ER and stock price (SP)s.
The mainstream economic view emphasizes two perspectives: the flow-oriented model and the stock-oriented approach. Dornbushch and Fischer (1980) emphasize that ER fluctuations affect a firm's SPs because they affect the firm's worldwide competitiveness and, as a result, the economy's real income and production, which in turn affect SPs. In contrast, the stock-oriented model (Frankel, 1983;Branson, 1993) has a contradictory link in that SP increases through changing aggregate demand for money due to wealth and liquidity impacts. This leads to higher interest rates affecting the flow of capital and eventually changes in the ER.
Based on these perspectives, in recent years, a growing interest has emerged in examining the volatility effect between the ER/forign exchange market and the stock market (e.g.,Palakkod, 2012; Araghi & Pak, 2013;Hussain & Bashir, 2013; Md-Yusuf & Abd-Rahman, 2013 ; Bonga-Bonga, 2013; Karunanayake, 2014 ; Aimer, 2019; Mechri et al., 2019). However, none of the studies is concerned about the structural changes or structural break (SB)s in the data series, which is of considerable importance in analysing macro-economic variables. Also, In the long run, structural changes in economic data series are possible for a variety of causes, including financial crises, institutional changes, policy changes, and regime transformations (Ndirangu et al., 2014). However, there have recently been numerous studies examining volatility effect on SPs based on the different sample periods which was constructed for analysis of well-known structural volatility changes due to 2007/2008 GFC globally(e.g., Stefanescu & Dumitru, 2013; Kang & Yoon, 2013 ; Mozumder et al., 2015). To our knowledge, no study has studied the volatility effect of the exchange market on the stock market using any mechanism for detecting unknown SBs in the ER or SPs.Therefore, research in this area needs to be extended, which is one factor that motivates this research.
In Sri Lanka, the stock market has experienced a rising trend until the first quarter of 2010, immediately following the end of the war in Sri Lanka in May 2009. Since then, there has been considerable volatility experienced in the stock market prices, with a negative tendency from time to time. On the other hand, the Sri Lankan rupee (LKR) currency has frequently been devalued by the country's central bank. At the end of 2011, the central bank depreciated the LKR by 13.5% against the USD (Weerasinghe, 2018). As a consequence, the value of the LKR in terms of USD dropped from Rs. 110 to Rs. 130 in 2012. However, the value LKR gradually declined and reported to Rs.141 in 2014 and an average of Rs.190 in July 2021. Because Sri Lanka's economy is heavily reliant on export and import activities, and the rising trend in the ER has resulted in an increase in domestic price levels across the board. In the last twenty years, the Sri Lankan currency market has met various structural breaks in the Sri Lankan rupee against foreign currencies, mainly USD, because of the various policy changes.
The primary purpose of this study is to analyze the influence of exchange rate vololatility on the Sri Lankan stock market, with a particular emphasis on the structural break in USD. The remainder of this paper is organized as follows. The second section summarizes the literature, the third section describes the methods used in the study, and the fourth section gives the data analysis and discusses the findings. Section five contains the study's conclusion.
Literature Review
A substantial and rising body of literature has examined the correlation between currency market/exchange rate volatility and stock market volatility utilizing Generalized Auto-Regressive Conditional Heteroscedasticity model (GARCH) based family models (e.g., Palakkod, 2012; Araghi & Pak, 2013;Hussain & Bashir, 2013; Md-Yusuf & Abd-Rahman, 2013 ; Bonga-Bonga, 2013 ; Karunanayake, 2014 ; Sichoongwe, 2016; Aimer, 2019; Mechri et al., 2019).
Palakkod (2012)examines the volatility integration among the currency market, stock market, and commodity market in the Indian economy over the daily data (2005-2015). This study examined the ER volatility spillover to the stock market using the Auto-Regressive (AR) (1)-GARCH (1,1) model. Araghi and Pak (2013) examined the dynamic link between ER volatility and stock market volatility in Iran over a five-year period (March 2004 to March 2010) using the GARCH (1,1) model and discovered unidirectional causality going from ER volatility to stock market price volatility. For Pakistan, India, and China economies over the daily data (2007-2012), Hussain & Bashir (2013)found unidirectional volatility running from the ER to the stock market only for Pakistan using the GARCH family model.
Md-Yusuf and Abd-Rahman (2013) use the GARCH (1,1) model to investigate the impact of ER volatility on stock market performance, with a particular focus on the Malaysian stock market. They find that the effect of ER volatility on stock market performance is significant. According to the findings of the study, the Malaysian stock market is influenced by ER volatility. As an intensive analysis, Bonga-Bonga (2013) examined the transmission of volatility shocks between the foreign exchange market and the stock market in South Africa by employing GARCH family models over weekly data from the former (1995-2010). According to the findings of this study, the conditional volatility of the currency market has a positive relationship with the conditional volatility of the equities market.
In the context of the Australian economy, Karunanayake (2014) investigated the influence of ER volatility of seven currencies on the Australian stock market using the GARCH model over daily data (2003-2013). ER volatility was found to have an impact on the volatility of the Australian stock market in two out of the seven currencies studied.Perera (2016) examined the relationship between the exchange rate volatility of the USD, the British pound (GBP), and the EURO (in terms of the Sri Lankan rupee) on the stock market volatility for the period 2010-2015, using the GARCH (1,1) model. He discovered that the ER volatility of the EURO has a positive impact on the stock market return volatility, whereas the ER volatility of the USD and (GBP) has a negative impact.
Using the data from 2000 to 2015, Sichoongwe (2016)examined the effect of ER volatility on the Zambian stock market using the GARCH (1,1) model and found a negative association between ER and stock market volatility. Mechri et al. (2019) investigated the ER volatility spillover effect in MENA countries, specifically Tunisia and Turkey. The GARCH (1.1) model was used to estimate ER volatility across a 15-year period of data (2002–2017). The study discovered that ER volatility has a considerable impact on Tunisia and Turkey's stock market volatility.
Employing the GARCH (1,1) model over the period from Jan 2004 to Apr 2018, Aimer (2019) found unidirectional causality from ER volatility to Dubai stock market, unidirectional causality running from SP volatility to ER volatility and no volatility effect for Egypt. Wong (2019) examined the volatility spill over the currency market and various sectors in the Malaysian stock market using the GARCH (1,1) model over monthly data (2000-2017) and found the exchange rate volatility have affected the technology, infrastructure, consumer, industrial, and trading/service sectors.
There have been numerous studies examining volatility effect on SPs based on the different sample periods constructed for analysis of well-known SBs due to 2007/2008 GFC globally (e.g., Stefanescu & Dumitru, 2013; Kang & Yoon, 2013; Mozumder et al. 2015). Stefanescu & Dumitru (2013) investigated the volatility effect between the currency market and the stock market for the Romanian economy during the GFC and tranquil period. The study also investigated the correlations between two series volatilities by using the GARCH (1,1) model. The study found that the conditional volatility of EXRs influence the stock market volatility tranquil period but not in the GFC period.
Mozumder et al. (2015) investigated the volatility spillover effects between SPs and ER in three industrialized and three emerging nations. The study discovered significant asymmetric volatility spillover effects between ER and SPs, particularly in developed and emerging economies during the GFC era.Tule et al. (2018) examined the volatility spillovers between stock returns and the ER using a GARCH model. They found that shock volatility transfer is more strongly unidirectional, without considering structural breaks. A bidirectional spillover trend has been seen when examining breakpoints in both markets.
Methodology
Data and Data Source
This study uses the ASPI of the CSE as the dependent variable, and this index was transformed into natural logarithm (Ln) values. The stock market return (RASPI) was measured by using the equation (1)
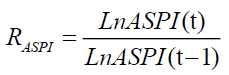 (1)
(1)
Moreover, we used USD ERs as the independent variable. The closing month-end and week-end spot nominal bilateral ERs of USD were transformed into Ln form. ER return (RUSD) was measured by using equation two (2).
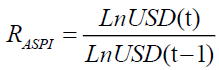 (2)
(2)
The study used weekly data starting from 1st July to 1997 to 30th June 2017. The USD ERs was collected from the ONDA.com database, while the ASPI was collected from the yahoo finance database.
Structural Break Model
The Bai & Perron (1998, 2003) model, represented as the Bai-Perron SB model, considers a multiple linear regression with m breaks and allows endogenously that can be carried out for the existence of multiple structural changes. Bajo-Rubio et al. (2008) indicate that the Bai-Perron model has established four advantages over previous SB testing method: (i) less restrictive assumptions, (ii) confidence intervals can be determined for the date of breaks, (iii) Data and errors can be used in various segment distributions. (iii) A sequential method employed for the application of Bai-Perron can provide serial correlation in mistakes and heterogeneous variances across sectors. The general form of the Bai-Perron model is as given in equation three (3)
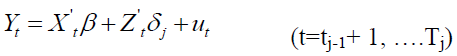 (3)
(3)
for j=1 ….m+1, with T0=0 and TM+1 =T, where yt is the dependent variable at a time; t, x't and z't are vectors of covariates; β and δj are the corresponding coefficients' vector; ut is the error term; m is the number of breaks. Only δ changes with time, and β is constant in this equation. We employed the Bai-Perron SB test to identify SBs in the USD exchange data series. There have been several recent attempts to use the Bai-Perron SB test to determine the SB dates in their works (Beckmann et al., 2011 ; Sharma & Setia, 2015; Abdennadher & Hellara, 2018; Jameel & Teng 2020; Jiranyakul, 2012).
GARCH (1,1) Model
This study use the GARCH (1,1) model to examine the volatility effect of ER on the Sri Lankan stock market volatility. The GARCH model is a dynamic volatility mechanism. It allows the conditional variance to be a dependent variable on its previous lags, thus allowing the GARCH (p, q) model to be represented in its general terms equation four (4).
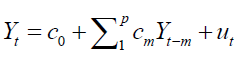 (4)
(4)
ut /It-1 ⁓ N(0,σ2); yt is a time series of an asset return at time t;, given the information set It-1 at the time t-1; ut is the innovation and assumed that ut is an innovation and assumes the distribution of ut as a conditional variance (σ2) with zero mean and time. The proposed ARCH model of Engle (1982) is shown in equation five (5):
 (5)
(5)
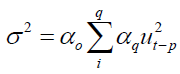
q is a high order parameter to capture the volatility process. The GARCH (p,q) model proposed by Bollerslev (1986) expresses the variance at time t, σ2 as shown in equation six (6)
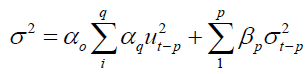 (6)
(6)
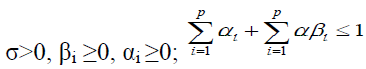 ; where p denotes the autoregressive lag and q denotes the moving average lag. When βi =0, i=1,2. The non-negative parameter requirements meant that the variance is not negative. The condition that the sum of βi and αi is necessary to steady for wide sense. Volatility shocks quite persistently if the αi and βi's total are nearer to one. To discover the effect of volatility on stock market volatility, we integrated the conditional variance of ER returns produced from the univariate GARCH (1, 1) model using equation (6) into the GARCH (1,1) model. In particular, a general specification of the model incorporated into equation six (6) can be written, as shown in equation seven (7):
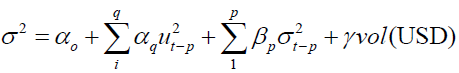 (7)
(7)
σ2 is the conditional volatility of the stock market. α is the coefficient of the lagged squared innovations (u_(t-p)^2 ) and β is the coefficient of the lagged variance (σ_(t-p)^2). The α and β parameters are always positive and significant from zero, giving an insight into the nature and degree of persistence of ASPI's volatility. The vol(USD) is the conditional variance of USD exchange rates. The parameter γ captures the nature and degree of volatility transmission from the exchange rate/currency market to the stock market. A positive and significant value of the estimated coefficient (γ) of conditional volatility for ER indicates a situation that the exchange rate volatility transmits/spillover to the stock market. It means that the volatility in the currency market transmits. If coefficient (γ) of conditional volatility is negative and substantially different from zero, then the results demonstrate that currency market volatility has a negative effect on the stock market. This means that increased currency volatility will reduce stock-market volatility and the decline in currency volatility will enhance stockmarket volatility.
Empirical Results
Structural Break Periods
We employed the Bai-Perron SB test on the USD ER over the weekly data period from 02.07.21997 to 28.06.2017 with the break type of L+1 vs L sequentially determined breaks, Trimming 0.15, and allowing a maximum of two (2) breaks. The Bai-Perron SB test detected three SBPs over the Full Sample Period (FSP) of this study. Table 1 shows the results of the Bai- Perron SB test. Accordingly, the first SB period (SBP-1) covered the data from 02.07.1997 to 10.01.2001, the second SB period (SBP-2) covered from 17.01.2001 to 15.02.2012 and the third SB period (SBP-3) include from 22.02.2012 to 28.06.2017 (Table 1).
| Table 1 Bai-Perron SB Periods In USD/LKR Exchange Rates | ||||||
| Break Range | SBPs | Coefficient | Std. Error | t-Statistic | Prob. | No of Obs. |
| 02.07.1997-28.06.2017 | FSP | 1045 | ||||
| 02.07.1997-10.01.2001 | SBP-1 | 4.236 | 0.015 | 281.670 | 0.000 | 185 |
| 17.01.2001-15.02.2012 | SBP-2 | 4.644 | 0.008 | 588.345 | 0.000 | 579 |
| 22.02.2012-28.06.2017 | SBP-3 | 4.912 | 0.009 | 562.394 | 0.000 | 281 |
Figure 1 shows the structural breaks in the USD exchange rates during the period between 02.07.21997 to 28.06.2017. Therefore, research in this area needs to be extended, which is another factor that motivates this research.

Figure 1 Structural Breaks in USD Exchange Rates
Descriptive Statistics
Descriptive statistics of ASPI and the ER series of USD in different sample periods are shown in Table 2. The mean of weekly ASPI is the highest in the SBP-3 and the lowest in the SBP-1. As a measure of volatility, the standard deviation is highest for ASPI for FSP reporting highest in SBP-2 out of the three SBPs. The standard deviation is observed as the highest in FSP while reporting the highest in SBP-1. At the same time, the ASPI and USD ERs for both series exhibit negative skewness in FSP and SBP-2. Both negative and positive skewness in SBP-1 and SBP-3 are leptokurtic and violate normality, as Jarque-Bera (JB) statistics indicated.
| Table 2 Descriptive Statistic | ||||||||
| FSP | SBP-1 | SBP-2 | SBP-3 | |||||
| ASPI | USD | ASPI | USD | ASPI | USD | ASPI | USD | |
| Mean | 7.652 | 4.643 | 6.361 | 4.236 | 7.535 | 4.643 | 8.744 | 4.912 |
| Median | 7.777 | 4.681 | 6.318 | 4.242 | 7.671 | 4.644 | 8.744 | 4.884 |
| Std. Dev. | 0.986 | 0.234 | 0.169 | 0.093 | 0.783 | 0.078 | 0.106 | 0.061 |
| Skewness | -0.211 | -0.617 | 0.686 | -0.065 | -0.155 | -0.428 | -0.376 | 0.601 |
| Kurtosis | 1.581 | 2.794 | 2.521 | 2.096 | 2.402 | 2.186 | 2.649 | 1.993 |
| JB | 95.477 | 68.157 | 16.292 | 6.433 | 10.95 | 33.609 | 8.071 | 28.786 |
| (0.000) | (0.000) | (0.000) | (0.040) | (0.004) | (0.000) | (0.018) | (0.000) | |
| Obs. | 1045 | 1045 | 185 | 185 | 579 | 579 | 281 | 281 |
| The P-value is in parentheses for the estimated coefficients. | ||||||||
Unit Root Test
We examined the variables' stationarity using the commonly used Augmented Dickey and Fuller (ADF) and Phillips and Perron (PP) tests. The null hypothesis is that the series is nonstationary, i.e., that it has a unit root, and the alternative hypothesis is that the series is stationary. The ADF and PP test results for the ASPI and USD in various sample periods are shown in Table 3. The null hypothesis of the unit root test is accepted at the level in both ADF and PP tests, whereas the alternative hypothesis is accepted at the first difference for all variables in all sample periods. The results indicate that at the integrated level, the USD exchange rates and ASPI series are unit roots. At the initial difference in FSP and all structural break periods, the variables become stationary.
| Table 3 Unit Root Test Results | |||||||||
| FSP | SBP-1 | SBP-2 | SBP-3 | ||||||
| ASPI | USD | ASPI | USD | ASPI | USD | ASPI | USD | ||
| ADF | I(0) | -0.252 | -2.270 | -1.837 | -0.12 | -1.344 | -2.310 | -2.285 | -1.303 |
| I(1) | -30.324* | -34.015* | -9.706* | -15.004* | -11.567* | -25.675* | -14.862* | -16.845* | |
| PP | I(0) | -0.374 | -2.338 | -1.512 | 0.720 | -1.317 | -2.323 | -2.138 | -1.319 |
| I(1) | -30.697* | -34.033* | -9.548* | -15.581* | -24.304* | -25.688* | -14.994* | -16.857* | |
| * indicates a significant level at 1% | |||||||||
Residual Test (Cluster Test)
The study tested the presence of the ARCH effect in USD and ASPI using the Lagrange multiplier (LM) test and the presence of autocorrelation using the Ljung-Box Q Squared (Q2) statistics test. Table 4 exhibits the results of these two tests for the variables in the different sample periods. The LM test verifies the ARCH effect, whereas the Ljung-Box Q Squared (Q2) test confirms the presence of serial correlation in the FSP, SBP-2, and SBP-3 for USD and ASPI. However, no ARCH effect or serial correlation concerns were observed in the USD data set during the SBP-1. As a result, we removed the SBP-1 from our estimation of the volatility effect and focused on the FSP, the FSP and SBP-2, and SBP-3.
| Table 4 Result of Residual Test | ||||||||
| Variable | FSP | SBP-1 | SBP-2 | SBP-3 | ||||
| Q2(10) | LM test | Q2(10) | LM test | Q2(10) | LM test | Q2(10) | LM test | |
| ASPI | 210.830 | 73.889 | 28.898 | 4.784 | 80.289 | 26.304 | 14.588 | 16.306 |
| (0.000) | (0.000) | (0.001) | (0.009) | (0.000) | (0.000) | (0.000) | (0.000) | |
| USD | 103.150 | 53.448 | 0.731 | 0.015 | 68.675 | 45.943 | 115.250 | 22.988 |
| (0.000) | (0.000) | 1.000 | 0.903 | (0.000) | (0.000) | (0.000) | (0.000) | |
| P-value is in parentheses for the estimated coefficients. | ||||||||
Results of Volatility Effect
The results of the GARCH (1,1) model produced from equation (7) are shown in Table 5 The coefficients of lagged squared innovations and lagged variance in the FSP, SSP-2, and SSP-3 are all positive and statistically significant at the 1% level. As a result, the GARCH (1, 1) model appears to perform reasonably well for regressions in all sample periods. The effect of ER volatility on the stock market volatility for the FSP, which is a long period of monthly (20 years) data, the coefficients of conditional volatility is negative and significant at 1% level. The results imply that the USD ER volatility negatively impacts the Sri Lankan stock market during the FSP. The meaning is that the higher volatility in the ER lowers the volatility in the stock market, and the lower volatility in the ER higher volatility in the stock market for a more extended period that was not considered the SBs in the data (Table 5).
| Table 5 Results of the Garch (1,1) Model | |||||||
| Period | C | α | β | γ | Q2(10) | LM Test | Wald Test (X2) |
| FSP | 3.20E-05 | 0.192* | 0.796* | -0.088* | 8.783 | 0.138 | 1.492 |
| (0.000) | (0.000) | (0.000) | (0.001) | (0.553) | (0.711) | (0.222) | |
| SBP-2 | 6.18E-05 | 0.191 | 0.786 | -0.063 | 7.167 | 0.007 | 2.419 |
| (0.000) | (0.000) | (0.000) | (0.002) | (0.710) | (0.932) | (0.120) | |
| SBP-3 | 1.88E-06 | 0.152 | 0.786 | 0.068 | 8.737 | 1.575 | 21.633 |
| (0.000) | (0.000) | (0.000) | (0.008) | (0.557) | (0.210) | (0.000) | |
P-value is in parentheses for the estimated coefficients; 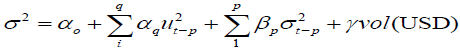 |
|||||||
This result is consistent with Sichoongwe (2016), who discovered a negative link between ER volatility and stock market returns in Zambia over a 15-year period. Additionally, this finding is consistent with Perera (2016)'s observation that the ER volatility of the USD and GBP has a negative effect on the stock market return volatility in Sri Lanka. This finding, however, contradicts the findings ofMechri et al. (2019), who discovered a positive spillover from the currency market to the stock market in Tunisia and Turkey using a lengthy period of data (15 years). In the instance of SB analysis of the effect of ER volatility on the Sri Lankan stock market, the conditional volatility coefficient is notably negative in the SBP-2, indicating that increased ER volatility reduces stock market volatility and vice versa during SBP-2. This outcome is consistent with Sichoongwe (2016) and Perera (2016).
During the SBP-3, the volatility coefficient of USD is positive and significant at 1% level, indicating that the volatility of the ER transmits/spillovers to the stock market during the SBP-3. This finding concurs with the finding of Araghi and Pak (2013)found unidirectional causality running from ER volatility to stock market volatility for the Iranian economy over the six years of data, and also consistent with the finding of Hussain & Bashir (2013), who found unidirectional volatility running from the ER to the stock market for Pakistan, India, and China economies over five years of data. Moreover, it should be noted that the SBP-1 was not considered to the volatility effect analysis because in the period the USD ER has not reported the ARCH effect, which is a primary condition to employ the GARCH (1,1) model. However, the study finds three results during the 20 years of data in SB analysis (Pesaran et al., 2001).
1 First, the USD has no significant conditional volatility in the data series during the SBP-1, indicating no volatility effect between the stock and currency markets.
2 Secondly, the ER volatility negatively affects the Sri Lankan stock market volatility during the SBP-2, indicating that the higher ER volatility lowers the stock market volatility and vice versa.
3 Thirdly, the ER volatility positively impacts the Sri Lankan stock market volatility during the SBP-3, indicating that volatility in the currency market spillover to the stock market. This finding shows a spillover effect of the currency market on the stock market.
The effect of ER volatility/currency market volatility on the stock market volatility for an extended period of data is not a similar pattern throughout the long period of data, and it says the volatility effect of ER on the stock market volatility in different SBPs are divergent in the Sri Lankan stock market. This finding is consistent with the finding of Stefanescu & Dumitru (2013), who found that the foreign exchange market volatility differently spillover to the stock market in different sample periods. This finding is also compatible with Tule et al. (2018) finding that shock volatility transfer is more strongly unidirectional, without considering structural breaks. A bidirectional spillover trend has been seen when examining breakpoints in both markets.
In addition, we tested the model fitness of the GARCH (1,1) model whether the results suffer from the ARCH effect and serial correlation problem. Table 5 show the results of the residual test. Accordingly, all the R squared values of the LM test are positive with a nominal p-value at 1% level in the FSP and also SBPs. These results indicate that the GARCH (1,1) model is free from the heteroscedasticity problem. On the other hand, we tested whether the model suffers from the serial correlation problem using the Ljung-Box Q2 statistics test. The results show the model free from the serial correlation problem. In addition, we performed the Walt test to discover the integral GARCH procedure and estimated Walt test X2 values in the FSP and SBP-2; however, none at 1 or 5 per cent are significant. The results show that integral GARCH (1,1) models are present. On the other hand, Walt test findings in SBP-3 are positive and meaningful at a level of 1%. This finding shows that the IGARCH model is not present (1, 1).
Conclusion
The objective was to investigate the volatility effect of the exchange rate/ currency market on the stock market volatility in the different SBPs. We applied the Bai-Perron SB model on the USD ER over the weekly data from 2. 07.1997 to 28.06. 2017 and identified three SBs with two break dates in the data series. To investigate the volatility effect of the currency market on the Sri Lankan stock market, we employed the GARCH (1,1) model.
Based on our analysis, our conclusion can be summarised as a whole, considering the facts discussed above as followings:
1 The volatility shocks are persistent in the currency and stock markets after Sri Lanka implemented an independent ER policy from a managed floating ER policy from 23.01.2001.
2 In the Sri Lankan stock market, having higher volatility in the currency market lowers the volatility in the stock market. On the other hand, having the lower volatility in the currency market makes higher volatility in the stock market for an extended period that was not considered the SB.
3 The currency market volatility explains the Sri Lankan stock market volatility, However, the direction of the volatility effect is not homogeneous over the extended period, but it is divergent with the structural periods.
4 The volatility spillover effect occurs during the free open foreign exchange policy: The currency market volatility negatively impacts the stock market volatility during the open managed exchange policy and positively impacts the free open ER policy.
These findings could lead to the ineffectiveness of information transmission between the two market assets over a long period. The case of SBP-3, which represents the last SB period of stock market prices, show an efficient impact of currency market volatility on the stock market volatility, indicating that after the war ended in Sri Lanka, it has strengthened the relationship between these two markets. Further, the finding indicates that freely opened the ER policy has also improved the link between the two markets.
Our findings have significant consequences for investment decisions for investors, shareholders, portfolio managers and multinationals. In particular, policymakers can use this information to predict market behaviour and take effective preventive actions before the problem spreads. This study on the stock market impact of ER volatility provides a helpful insight into how the currency market information is transmitted to the stock market of Sri Lanka.
References
Araghi, K.M., & Pak, M.M. (2013). Assessing the Exchange Rates Fluctuation on Tehrans Stock Market Price: A Garch Application, International Journal of Management and Business Research, 2(2), 95-107.
Bai, J., & Perron, P. (2003). Computation and Analysis of Multiple Structural Change Models, Journal of Applied Econometrics, 18(1), 1-22.
Beckmann, J., Belke, A., & Kühl, M. (2011). The Dollar-Euro Exchange rate and Macroeconomic Fundamentals: A Time-Varying Coefficient Approach, Review of World Economics 147(1), 11-40.
Branson, W.H. (1983). Macroeconomic determinants of real exchange risk. In Managing Foreign Exchange Risk, Herring R J (ed.), Cambridge: Cambridge University Press.
Dornbusch, R., & Fischer, S. (1980). Exchange rates and the current account. The American Economic Review, 70(5), 960-971.
Hussain, M., & Bashir, U. (2013). Dynamic linkages of exchange rate and stock return volatility evidence from Pakistan, India, and China (Pic). International Review of Management and Business Research, 2(2), 345.
Jameel, A.L.M., & Teng, K.L.L. (2020). The exchange rates and Stock Prices: Evidence from Colombo Stock Exchange, Test Engineering & Management, (83), 14766-14775.
Jiranyakul, K. (2012). Linkages between Thai stock and foreign exchange markets under the floating regime. Journal of Financial Economic Policy, 4(4), 305-319.
Kang, S.H., & Yoon, S.M. (2013). Revisited return and volatility spillover effect in Korea, Korea and the World Economy, 14(1), 121-145.
Md-Yusuf, M., & Abd-Rahman, H. A. (2013). Granger causality relationship between Malaysia equity market and exchange rate volatility. International Journal of Trade, Economics and Finance, 4(1), 19-24.
Mozumder, N., De Vita, G., Kyaw, S., & Larkin, C. (2015). Volatility Spillover between stock prices and exchange rate: New evidence across the recent financial crisis period. Economic Issues, 20(1), 43-64.
Palakkod, S. (2012). Integration of capital, commodity and currency markets: A study on volatility spillover. Romanian economic Journal, 18(44), 87-99.
Perera, H. (2016). Effects of exchange rate volatility on stock market return volatility: Evidence from an Emerging Market. International Journal of Science & Research, 5(1), 1750-1755.
Pesaran, M.H., Shin, Y., & Smith, R.J. (2001). Bounds testing approaches to the analysis of level relationships. Journal of Applied Econometrics, 16(3), 289-326.
Sharma, C., & Setia, R. (2015). Macroeconomic fundamentals and dynamics of the Indian rupee-dollar exchange rate. Journal of Financial Economic Policy, 7(4), 301-326.
Sichoongwe, K. (2016). Effects of exchange rate volatility on the stock market: The Zambian experience. Journal of Economics and Sustainable Development, 7(4).
Tarazi, R., & Hasan, M.Z. (2015). Financial crisis and dynamic the dependency between six international currencies volatility with sectors volatility: Evidence from six Australian sectors. Proceedings of 4th Global Business and Finance Research Conference, 25-27.
Weerasinghe, P.N. (2018). Evolution of monetary and exchange rate policy in Sri Lanka and the Way Forward, Staff Studies, 48(1).
Wong, H.T. (2019). Volatility spill overs between real exchange rate returns and real stock price returns in Malaysia, International Journal of Finance & Economics, 24(1), 131-149.