Research Article: 2018 Vol: 22 Issue: 2
Expectation Gap in Applying the IAS 2 [Inventories]: Evidence from Palestine
Zahran Daraghma, Arab American University-Palestine
Keywords
Inventories, IFRS, IAS 2, disclosure requirements, inventory polices.
Introduction
It's worth mentioning that before 2005 the Palestinian corporations applied the U.S. GAAP and relied on the statements of financial accounting standards that issued by the Financial Accounting Standards Board (FASB). Then, in 2005 Palestine moved to another stage by adopting the international accounting standards [IAS]. Thus, the listed corporations in the Palestine Exchange must adopt both the International Accounting Standards (IAS) and the International Financial Reporting Standards (IFRS). However, despite the conversion to the IAS and IFRS; many Palestinian accountants continue to use the U.S. GAAP model. This misuse refers to the accountants’ unfamiliarity of IFRS. This misuse of the application of IFRS standards is related to the IAS and IFRS in total, for instance, the IAS 2 “inventories”. Meanwhile, the Palestinian companies' misuse of the inventory standards leads to a shortcoming value relevance of published information. For example, the study of (Chen, and Zheng, 2012; Needles and Powers, 2012) shows that the inconsistency of inventory valuation techniques has different effects on the ending inventory value, cost of goods sold, enterprise’s financial position and income statement numbers. The study of (Emmanuel and Abdullahi, 2015) also states that inventory represents the largest portion of assets in manufacturing and commercial companies that make up an important part of the balance sheet. Likewise, the paper of (Gray and Ehoff, 2014) illustrates that the U.S. GAAP allows different ways to measure the cost of inventory like (retail method, First-In, First-Out [FIFO], Last-In, First-Out [LIFO], and Weighted Average [WA]); Wherein IFRS allows FIFO, and WA. Further, a study by (Emmanuel and Abdullahi, 2015) demonstrates that the FIFO method gives more realistic cost of ending inventory as such more superior to the WA method. In consequence, the International Financial Reporting Standards [IFRS] states that inventories must be measured at the lower of cost or net realizable value [NRV]. The NRV represents the expected selling price for an inventory item, less the estimated costs of completion and the estimated costs necessary to make the sale (IAS 2, Inventory). However, the paper of (Gray and Ehoff, 2014) also shows that convergenceof U.S. GAAP to IFRS will continue. As well, over time differences between U.S. GAAP and IFRS will likely diminish. One of the most important findings of (Obaidat and Al-Hajaia, 2013) also illustrates the existence of insufficient understanding in applying the IAS and the IFRS in the approved manner by the Jordanian accountants and auditors. As a result, the paper encouraged other authors to explore all the IAS and the IFRS. The aforementioned realities show that Palestine suffers from a great lack of empirical studies that investigate the commitment level of the commercial and manufacturing companies in applying the IAS 2 (inventories). As well, this paper comes to explore this outstanding issue from the reality of the Palestinian commercial and industrial companies.
Hence, the findings of this paper, on the first hand, are expected to be prominent as they will be used as live evidence on the commitment level of the commercial and manufacturing Palestinian companies in applying the IAS 2 in accordance with the IFRS. On the second hand, it explains the shortcomings places in applying the IAS 2 which will enable the policymakers and decision-takers to redeem these deficiencies. The methodology and statistical techniques of this manuscript followed previous studies such as (Sunder, 1975; Hughes and Schwartz, 1988; Al-Daoor, 2008; Shusheng, 2014; Monea, 2011; Siyanbola, 2012; Obaidat and Al-Hajaia, 2013; Asiri, 2014; Kral, 2014; Onyekwelu, 2014; Emmanuel and Abdullahi, 2015; Honkova, 2015; Mia and Qamruzzaman, 2016).
This paper consists of eight sections. These sections are: section (1) an introduction, section (2) addresses the theoretical background, section (3) describes literatures review, section (4) describes the hypotheses of the study, section (5) addresses data and methodology, section (6) presents the results, section (7) reports the discussion of the results, and section (8) presents conclusion suggestion for future research.
Theoretical Background
This section comes to explain the theoretical side of this paper that related to inventories and in accordance with the IAS 2 "inventories"; as well as comparing the IAS 2 with the U.S. GAAP.
Inventory Valuation under the U.S GAAP
The United States of America measures the inventory at the lower of cost or market [LCM] (Needles and Powers, 2012; PWC, 2015; Kieso, 2016). This method requires computing the fair market value of inventory and the cost of inventory (Kieso, 2016). For instance, (Hughes and Schwartz, 1988; Gray and Ehoff, 2014; Kieso, 2016) show that the U.S. GAAP offers various methods to measure inventory at cost. The cost is the purchase value of inventory calculated using one of the historical cost-based approach (specific identification, FIFO, LIFO, or WA (Kieso, 2016). Additionally, the authors (Spicel and, Sepe, and Nelson, 2012; PWC, 2015; Kieso, 2016) show that according to the U.S. GAAP the designated market value is the number that falls in the middle of the following three possibilities (replacement cost [RC], net realizable value [NRV]/ceiling/ the upper limit, and the NRV less a normal profit margin [NRV-NP]/ floor/ lower limit). The expression [NRV] refers to the net amount that a business expects to realize from the sale of goods. Specifically, net realizable value is the estimated selling price in the ordinary course of business, less reasonably predictable costs of completion, disposal, and transportation (Kieso, 2016). The RC, in particular, means the cost replaces the item when purchased or manufactured (Needles and Powers, 2012). Figure 1 shows a graphical illustration that represents the process of applying LCM approach in accordance with the U.S. GAAP by following two stages.
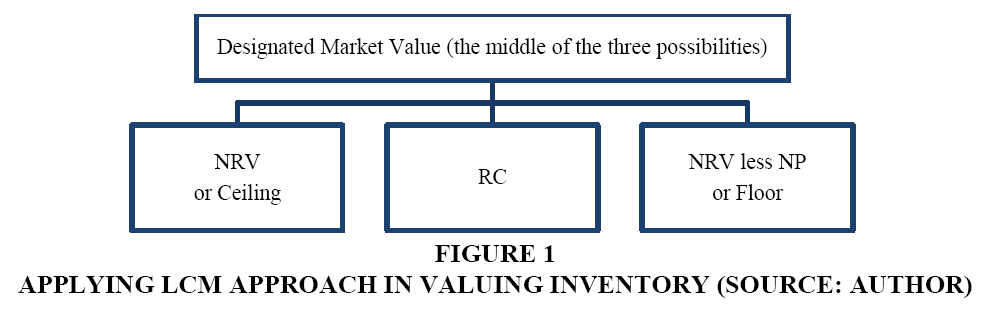
Figure 1: Applying Lcm Approach In Valuing Inventory (Source: Author)
| Description 1 Figure 1: Lower Of Cost Or Market [Lcm] |
||
| Designated Market (from stage one) | Or | Cost |
Stage 1: Determining designated market value of inventory
Stage 2: Comparing designated market with cost
Inventory Valuation under IFRS and IAS
The international accounting standard 2 states that the cost of inventories includes all costs of purchase, costs of conversion, and allocation of production overheads (Emmanuel and Abdullahi, 2015; Honkova, 2015). The IAS measures the inventory at the lower of cost or net realizable value [LCNRV] (Asiri, 2014; Kral, 2014; Onyekwelu, 2014; Emmanuel and Abdullahi, 2015). This method requires computing the fair market value of inventory and the cost of inventory. For instance, (Al-Daoor, 2008; Shusheng, 2014; Monea, 2011; Siyanbola, 2012; Obaidat and Al-Hajaia, 2013; Asiri, 2014; Kral, 2014; Onyekwelu, 2014) show that the IAS offers various methods to measure inventory at cost. The cost is the purchase value of inventory calculated using one of the historical cost-based approach (specific identification, FIFO, or WA). Additionally, the authors (Shusheng, 2014; Monea, 2011; Siyanbola, 2012; Obaidat and Al-Hajaia, 2013; Honkova, 2015; Mia and Qamruzzaman, 2016) show that according to the IAS the designated market value is equal the NRV.The IAS 2 provides that the following items should be excluded from the cost of inventory. These items are: 1) Abnormal waste or spoilage, 2) Factory Idle time, 3) Storage costs – except when necessary in the production process, 4) General administration overheads, 5) Marketing and other sales costs. Figure 2 shows a graphical illustration that represents the process of applying the lower of cost or net realizable value [LCNRV] approach in accordance with the IAS by following two stages, (IAS 2, Inventories).
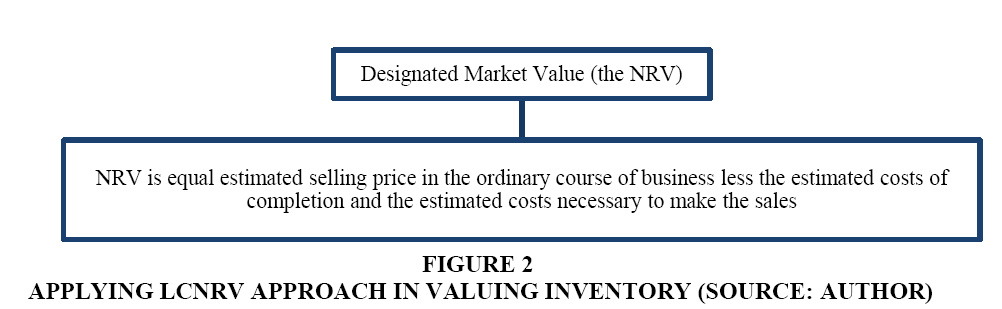
Figure 2: Applying Lcnrv Approach In Valuing Inventory (Source: Author)
| Description 2 Figure 2: Lower Of Cost Or Net Realizable Value [Lcnrv] |
||
| Designated Market (from stage one) | Or | Cost |
Stage One: Determining the designated market value of inventory.
Stage Two: Comparing designated market with cost.
The IAS 2 allows capitalization of interest (Doupnik, and Perera, 2015; IAS 2, Inventories). Furthermore, IAS 2 requires that inventory must be reported on the balance sheet at the lower of cost or net realizable value on an item by item basis (Doupnik, and Perera, 2015; Honkova, 2015; Mia and Qamruzzaman, 2016). The required disclosures under IAS 2 are: 1- Accounting policies, 2- Carrying amount, generally classified as merchandise, supplies, materials, work in progress, and finished goods, 3- Carrying amount of any inventories carried at fair value less costs to sell, 4- Amount of any write-down of inventories that are recognized as an expense in the period, 5- Amount of any reversal of a write-down to NRV and the circumstances that led to such reversal, 6- Carrying amount of inventories pledged as security for liabilities, 7- Cost of inventories recognized as an expense (cost of goods sold).
However, (Foley and Comm, 2015) state that the inventory in accordance with IAS is measured at the lower of cost or net realizable value (LCNRV). The authors provide an explanation of applying this rule in accordance with IFRS as explained in tables 1 and 2. Assume that X company has four items of inventories on hand at the year-end. Their costs and NRVs are illustrated as follows:
| Table 1 Incorrect Way Of Applying The Lower Of Cost Or Nrv |
||
| Item | Cost | NRV |
| 1 | $50 | $45 |
| 2 | 40 | 42 |
| 3 | 55 | 62 |
| 4 | 100 | 80 |
| Total | 245 | 229 |
| Table 2 Correct Way Of Applying The Lower Of Cost Or Nrv |
|||
| Item | Cost | NRV | Lower of Cost or NRV |
| 1 | $50 | $45 | $45 |
| 2 | 40 | 42 | 40 |
| 3 | 55 | 62 | 55 |
| 4 | 100 | 80 | 80 |
| Total | 245 | 229 | 220 |
It would be false to compare the total cost of $245 with total NRV of $229 and state inventories at $229. The comparison should be made for each item of inventory and thus a value of $220 would be attributed to inventories as explained in table 2.
U.S. GAAP Versus IAS of Inventory
Table 3 displays a brief comparison between the treatment of inventory under U.S. GAAP and IFRS (Sunder, 1975; Hughes and Schwartz, 1988; Al-Daoor, 2008; Shusheng, 2014; Monea, 2011; Siyanbola, 2012; Obaidat and Al-Hajaia, 2013; Asiri, 2014; Kral, 2014; Onyekwelu, 2014; Emmanuel and Abdullahi, 2015; Honkova, 2015; Mia and Qamruzzaman, 2016).
| Table 3 Comparison between the treatment of inventory under u.s. Gaap and ifrs |
||
| US GAAP | IFRS | |
| Inventory valuation at cost | Retail method, First-In, First-Out (FIFO), Last-In, First-Out (LIFO), and Weighted Average (WA). | FIFO and Weighted Average. LIFO didn't permit. |
| Inventory valuation at the Fair Market Value (FMV) | Designated Market value (the middle of the three possibilities NRV [Ceiling] or RC [Replacement Cost] or NRV less NP [Floor]. | Net realizable value. |
| Inventory value | Lower of cost or fair market value. | Lower of cost or net realizable value. |
| Conservative | US GAAP inventory rules are more conservative than IFRS. | IFRS inventory rules are less conservative than US GAAP. |
| Reversal of inventory write–down (Loss reversal). | Not permitted to reverse a former write-down before the inventory is either sold or written off (write – down of Inventory cannot be reversed). | Permitted to reverse a former write-down before the inventory is either sold or written off (Previously recognized inventory write-downs are reversed up to the amount of the original loss). |
Source: Previous Literatures
Inventory Write-Down (IFRS and U.S. GAAP)
The IAS 2 indicates that inventories are written-down when the cost is greater than NRV (IAS 2, Inventories). The NRV may be lower due to: 1- Damaged inventory, 2- Obsolete, 3- Change in market demand, and 4- Physical deterioration (Monea, 2011; Doupnik, and Perera, 2015). Hence, the evaluation of the NRV is prepared at each accounting period (Siyanbola, 2012; Kral, 2014; Honkova, 2015). When there is clear indication of an increase of the NRV, the amount of the write-down is reversed even if the inventories remain unsold (Monea, 2011; Foley and Comm, 2015). The IAS 2 states that these reversals must be recognized in the period they occur and when they are limited to the amount of the original write-down (IAS 2, Inventories). The IAS 2 also states that losses associated with write-down are an expense in the period of the write-down (IAS 2, Inventories). Further, any reversal should be recognized in the income statement in the period the reversal occurs (IAS 2, Inventories).
Likewise, the U.S. GAAP, Accounting Research Bulletin No. 43 [Restatement and Revision of Accounting Research Bulletins] states that following a write-down "such reduced amount is to be considered the cost for subsequent accounting purposes," and it is therefore not permitted to reverse a former write-down before the inventory is either sold or written off. This means the GAAP prohibits reversals altogether.
Illustration: X Company sells refrigerators. At December 31, X had 10 units on hand with a cost of 1,000 each. On December 31, the net realizable value was $900 each. According to the IAS 2, the accountant must write-down [10 units * $100] because the NRV is less than the cost (IAS 2, Inventories). The accounting entry should be:
| Description 3 Accounting Entry |
|||
| Date | Journal Entry | Dr. | Cr. |
| 31- Dec. - 2017 | Loss on Write-Down of Inventory Inventory |
1000 | 1000 |
Literatures Review
There are various literatures that discuss corporation's commitment with the IAS 2 adoption and its impact on the performance of a firm and the accuracy of adoption as well. Vast of previous studies on the accounting for inventories compare the U.S. GAAP and IFRS. Many papers show that the adoption of the IAS increases the value relevance of accounting numbers and the performance of a firm. For instance, the paper of, (Barth, Landsman and Lang, 2006), tested a sample of corporations that includes different countries. The study concludes that the company's value relevance of earnings is more when the IAS is applied. Also, the paper of (Athanasios, Kanellos and Konstantinos, 2007) states that when the Greek corporations switched to the IAS; the value relevance of accounting numbers were increased. Moreover, the paper of (Mutai, 2014) shows that there is a positive impact of adoption the IAS by Greek corporations on the quality of financial statements. In addition, in Nigeria, (Siyanbola, 2012) indicates that the adoption of IAS 2 has positive influence on the quality of accounting information.
Many previous studies provide concrete justification that explains why the International Accounting Standards Board [IASB] eliminated the LIFO method of inventory valuation. For instance, in the United States, (Hughes and Schwartz, 1988), show that FIFO method provides useful information greater than LIFO method. This finding justifies the decision of the IASB to eliminate the LIFO method from the scope of the IAS 2. Another paper in the United States (Sunder, 1975) states that during the inflationary period, changes to the LIFO method of inventory valuation generally result in the reduction of reported earnings. This finding also justifies why LIFO method is prohibited under the International Financial Reporting Standards Board from IAS 2. Moreover, the study of (Emmanuel and Abdullahi, 2015) in Nigeria also proves that FIFO method gives more realistic cost of closing stock.
Many papers examine the commitment of applying the IAS 2 in the emerging economics. For instance, in Palestine (Al-Daoor, 2008) indicates that Palestinian firms are using the W.A, FIFO, and LIFO methods for measuring inventory at cost. This proves that there is an incorrect application of the IAS 2 in Palestine. Also, in Saudi Arabia, (Asiri, 2014) concludes that there is a lack of harmonization between the IAS and Saudi Arabia accounting standards. The paper shows that there is inconsistency between Saudi Arabia inventory standard and the IAS 2 "inventories”. Further, the paper of (Onyekwelu, 2014) shows that the Nigerian corporation apply the IAS 2 incorrectly. The paper concludes that the Nigerian firms should embark on intensive training for their accounting staff to get them to become IFRS compliant. Also, in Bangladesh, the study of (Nisha, 2015) shows that the listed corporations measure the value of inventory as explained in the IAS 2. Also, (Mia and Qamruzzaman, 2016) examines the current situation of inventory valuation and the compliance with IAS 2 in Bangladeshi manufacturing industries that listed on the Dhaka Stock Exchange. The findings indicate that the companies are fully compliant with the IAS2 in relation to the valuation of inventory. Moreover, a study by (Kral, 2014) shows that the IAS 2 is respected and applied in the Czech accounting legislation. A related study in the Czech Republic, (Honkova, 2015) finds out that Czech companies submit their financial statements in accordance with IAS/ IFRS. Thefinancial statements of these companies reported all mandatory information that is relevant to stakeholders. In china, the paper of (Shusheng, 2014), explores the value relevance resulting from the selections of inventory valuation techniques. It concludes that the IFRSs provide useful information more than the Chinese GAAP. However, in Romania, the paper of (Monea, 2011) shows that the difficulty of accounting for inventories arises from several factors such as: the high volume of activity, the various cost flow alternatives that are acceptable, and the classification of inventories. The paper of (Obaidat and Al-Hajaia, 2013) explores the reality of applying IAS in Jordanian industrial corporations. The study reveals that the listed corporations were committed to implement the IAS and to provide its related disclosures.
The analysis of the previous literatures shows that there are shortcomings in applying the IAS in emerging economics. These short comings refer to many reasons such as: lack of trained accountants, inefficiency of capital markets, and applying the U.S GAAP instead of applying the IAS.
The Hypotheses
This paper aims at examining the commitment of the commercial and manufacturing Palestinian companies in applying IAS 2 (inventories). Presented below are the four null hypotheses of the study.
H1: The Palestinian commercial and manufacturing companies do not apply the IAS 2 in accordance with the IFRS.
H2: The Palestinian commercial and manufacturing companies do not match disclosure requirements that are related to inventories in accordance with IFRS.
H3: There are no statistically significant differences in the commitment of the commercial and manufacturing Palestinian companies in applying the IAS 2 (inventories). As well, the compliance with disclosure requirements refers to the legal form of business (privately held corporation and publicly held corporation).
H4: There are no statistically significant differences in the commitment of the commercial and manufacturing Palestinian companies in applying the IAS 2 (inventories). Also, the compliance with disclosure requirements refers to the business activity (commercial and industrial firms).
Data and Methodology
The study population is made up of the employed financial managers, accountants, and internal auditors at the operated listed industrial and commercial (privately held and publicly held) in the Palestine Exchange [PEX]. Methodically, the study sample has been selected by taking into account the following two conditions:
A- A company should be privately or publicly held.
B- The corporation head quarter is located in West Bank.
Thus the study is made up of 120 distributed questionnaires; notwithstanding 97 forms were given back. Accordingly, table 4 illustrates the study sample distribution of the academic rank, job title, work experience, number of workplace employees, and legal form of business, business activity, and firm adoption of IFRS.
| Table 4 Descriptive Statistics Of Respondents Characteristics |
|||
| Variable Name | Variable Dimensions | Number of Observations | % |
| Academic Rank | Diploma | 19 | 19.6 |
| Bachelor | 56 | 57.7 | |
| Master | 22 | 22.7 | |
| PhD. | 0 | 0.00 | |
| Total | 97 | 100 | |
| Job Title | Financial Manager | 32 | 33.0 |
| Internal Auditor | 23 | 23.7 | |
| Accountant | 42 | 43.3 | |
| Total | 97 | 100 | |
| Work Experience | Less than 6 years | 0 | 0.00 |
| 6 - 10 years | 22 | 22.7 | |
| 11 - 15 years | 46 | 47.4 | |
| 16 - 20 years | 19 | 19.6 | |
| More than 20 years | 10 | 10.3 | |
| Total | 97 | 100 | |
| Number of Workplace Employees | Less than 20 employees | 0 | 0.00 |
| 20 – 39 employees | 0 | 0.00 | |
| 40 – 59 employees | 13 | 13.4 | |
| 60 – 79 employees | 19 | 19.6 | |
| 80 – 99 employees | 33 | 34.0 | |
| 100 or more | 32 | 33.0 | |
| Total | 97 | 100 | |
| Legal Form of Business | Privately held corporation | 64 | 66.0 |
| Publicly held corporation | 33 | 34.0 | |
| Total | 97 | 100 | |
| Business Activity | Commercial. | 32 | 33.0 |
| Industrial. | 65 | 67.0 | |
| Total | 97 | 100 | |
| Your Firm Adopted | U.S. GAAP | 0 | 0 |
| IFRS | 97 | 100 | |
| Total | 97 | 100 | |
Table 4 also shows that 19.6% of the respondents are diploma holders. 57.7% hold bachelor degree. 22.7% hold a master degree. The survey, on the first hand, reveals that 33% of respondents are financial managers. 23.7% are internal auditors, and 43.4% are accountants. The outcomes, on the second hand, show that 22.7% of the respondents have 6-10 years of experience; whereas 47.4% has 11-15 years of experience. Further, 19.6% have 16-20 years of experience, and 10.3% of the respondents have more than 20 years of experience. As well, 13.4% of the respondents work in companies that employ 40-50 employees. Further, 19.6% of the respondents work in companies that employ 60-79 employees; 34% of the respondents work in companies that employ 80-99 employees. 33% of the respondents work in companies that employ 100 employees or more. Moreover, the survey reveals that 66% of the respondents work at privately held corporation, and 34% of them work at a publicly held corporation. It also reveals that 33% of the respondents work at commercial companies, and 67% of them work at industrial companies. Finally, 100% of the respondents work at firms that adopt the IFRS.
As a consequence, the aforementioned results confirm that the selected sample is relevant to generalizing the results of this manuscript.
To test the internal reliability of the measurement scales; this paper used Cronbach’s Alpha. Table 5 shows that the Cronbach’s Alpha is sufficiently high to ensure reliable results.
| Table 5 The Outcomes Of Cronbach’s Alpha Test |
||
| Variable Name | Number of Items | Cronbach's Alpha |
| The Palestinian commercial and manufacturing companies do apply the IAS 2 in accordance with the IFRS | 10 | 83.4% |
| The Palestinian commercial and manufacturing companies do match disclosure requirements that related to inventories in accordance to IFRS | 10 | 95.3% |
The Results
This section comes to examine the four hypotheses of this paper. Presented below are the results of the hypotheses.
Examining Hypothesis Number One
Hypothesis number 1 states that "The Palestinian commercial and manufacturing companies do not apply the IAS 2 in accordance with the IFRS". Relatively, table 6 reveals 10 statements that violate the IAS 2. The calculated T value of one sample T test is equal to -0.24 and Sig. is greater than 0.05. This result proves that the Palestinian corporations do not apply the IAS 2 in adherence to the IFRS". What is more, the statistical results show that the precise application of the IAS 2 is incomplete. The shortcoming is very clear regarding the following misuse of IAS 2 application:
| Table 6 Applying Inventory Accounting Policies And Methods Correctly |
||||||||||
| # | Question | Strongly Agree | Agree | Neutral | Disagree | Disagree Strongly | Mean | T Value |
Sig. | Result |
| 1 | Using LIFO in valuing the inventories at cost. | 10 10.3% |
0 0.0% |
0 0.0% |
46 47.4% |
41 42.3% |
1.89 | -9.43 | 0.00 | C |
| 2 | Applying the lower of cost or fair market value approach. | 13 13.4% |
55 56.7% |
10 10.3% |
0 0.0% |
19 19.6% |
3.44 | 3.34 | 0.001 | I |
| 3 | The fair market value of inventory is computed by using the replacement cost. | 9 9.3% |
43 44.3% |
0 0.0% |
26 26.8% |
19 19.6% |
2.97 | -0.22 | 0.83 | M |
| 4 | The fair market value of inventory is computed by using the discounted models. | 10 10.3% |
23 23.7% |
10 10.3% |
45 46.4% |
9 9.3% |
2.79 | -1.68 | 0.10 | M |
| 5 | The biological asset inventory is evaluated according to the IAS2. | 10 10.3% |
20 20.6% |
26 26.8% |
32 33% |
9 9.3% |
2.90 | -0.88 | 0.38 | M |
| 6 | Inventories aren't written-down if the cost is greater than NRV. | 10 10.3% |
23 23.7% |
0 0.0% |
45 46.4% |
19 19.6% |
2.59 | -3.07 | 0.003 | C |
| 7 | The construction assets inventory is evaluated according to the IAS2. | 10 10.3% |
23 23.7% |
19 19.6% |
36 37.1% |
9 9.3% |
2.89 | -0.95 | 0.35 | M |
| 8 | The net realizable value [NRV] is not allowed for measuring the market value of inventory. | 9 9.3% |
43 44.3% |
0 0.0% |
36 37.1% |
9 9.3% |
3.07 | 0.57 | 0.57 | M |
| 9 | The net realizable value represents the enter price of inventory. | 18 18.6% |
43 44.3% |
10 10.3% |
26 26.8% |
0 0.0% |
3.55 | 4.98 | 0.00 | I |
| 10 | The amount of the write-down is not allowed to be reversed even if the inventories remain unsold. | 29 29.9% |
36 37.1 |
9 9.3% |
23 23.7% |
0 0.0% |
3.73 | 6.36 | 0.00 | I |
| Incorrect Application of IAS 2 | 13 13.% |
31 31.9% |
8 8.7% |
32 32.5% |
13 13.8% |
2.98 | -0.24 | 0.82 | M | |
| The test value of the One-Sample T test is 3.0. Ho: M=3, Ha: M ≠ 3. If Sig. >0.05, Ho must be accepted which means incorrect application of the IAS2. The negative value of T when Sig. < 0.05 means the correct application of the IAS2. The positive value of T when Sig. <0.05 means incorrect application of the IAS2. Where: C=Correct Application, I=Incorrect Application and M=Mix Understanding. | ||||||||||
1. Applying the lower of cost or fair market value approach.
2. In computing the net realizable value using the inventory enter price.
3. The amount of the write-down is not allowed to be reversed even if the inventories remain unsold.
Based on table 6 outcomes, the IAS2 is still being applied incorrectly and away from the approved manner by the accountants, financial managers and internal auditors. Instead, they apply the US GAAP standard. Table 9, therefore, shows that the only firms that apply the IAS 2 incorrectly in accordance with the accounting policies and methods are the privately held corporations. It further reveals that the publicly held corporations apply the IAS 2 correctly with reference to the accounting policies and methods.
Examining Hypothesis Number Two
Hypothesis 2 states that "The Palestinian commercial and manufacturing companies do not apply the disclosure requirements that related to inventories in accordance with IFRS". Relatively, table 7 includes 10 obligatory disclosure requirements. The statistical outcomes as explained in table 7 reveals that there is a lack of compliance with the disclosure requirements that are mentioned in the IAS 2 “inventories”. Similarly, the calculated T value of one sample T test equals -0.23 and Sig. is greater than 0.05. This result proves that the Palestinian corporations do not meet the disclosure requirements of the inventories and consistent with IFRS”. Table 7 shows a shortcoming in matching the disclosure requirements according to the IAS 2; wherein the following particulars have not been disclosed in accordance with the IAS 2.
| Table 7 Compliance With Disclosure Requirements According To The Ias 2 |
||||||||||
| # | Question | Strongly Agree |
Agree | Neutral | Disagree | Strongly Disagree |
Mean | T Value |
Sig. | Result |
| 1 | The accounting policies are adopted in measuring inventories. | 19 19.6% |
59 60.8% |
0 0.0% |
9 9.3% |
10 10.3% |
3.70 | 5.79 | 0.00 | CDR |
| 2 | The amount of any write-down of inventories recognized as an expense in the period. | 18 18.6% |
46 47.4% |
10 10.3% |
23 23.7% |
0 0.0% |
3.61 | 5.72 | 0.00 | CDR |
| 3 | The amount of any reversal of a write-down to NRV. | 10 10.3% |
26 26.8% |
9 9.3% |
52 53.6% |
0 0.0% |
2.94 | -0.55 | 0.58 | NCDR |
| 4 | The circumstances or events that led to the write-down. | 9 9.3% |
10 10.3% |
9 9.3% |
59 60.8% |
10 10.3% |
2.47 | -4.67 | 0.00 | NCDR |
| 5 | The amount of any reversal of any write-downs. | 9 9.3% |
36 37.1% |
9 9.3% |
13 13.4 |
30 30.9% |
2.80 | -1.33 | 0.19 | NCDR |
| 6 | The circumstances that led to such reversal. | 9 9.3% |
23 23.7% |
9 9.3% |
46 47.4% |
10 10.3% |
2.74 | -2.11 | 0.04 | NCDR |
| 7 | Cost of inventories recognized as an expense (cost of goods sold). | 9 9.3% |
36 37.1 |
19 19.6 |
13 13.8% |
20 20.6% |
3.01 | 0.077 | 0.93 | NCDR |
| 8 | The total carrying amount of inventories broken into appropriate classifications. | 19 19.6% |
13 13.4% |
32 33% |
13 13.8% |
20 20.6% |
2.98 | -0.14 | 0.88 | NCDR |
| 9 | The carrying amount of any inventories carried at fair value less costs to sell. | 9 9.3% |
23 23.7% |
10 10.3% |
45 46.4% |
10 10.3% |
2.75 | -2.03 | 0.04 | NCDR |
| 10 | The expected costs of completion and disposal that used to compute the NRV. | 9 9.3% |
23 23.7% |
19 19.6% |
26 26.8% |
20 20.6% |
2.74 | -1.97 | 0.05 | NCDR |
| Compliance with Disclosure Requirements | 12 12.37% |
29 29.9% |
13 13.4% |
30 30.93% |
13 13.4% |
2.98 | -0.23 | 0.81 | NCDR | |
| The test value of the One-Sample T test is 3.0. Ho: M=3, Ha: M 3. If Sig. >0.05, Ho must be accepted; which means there is lack of compliance with disclosure requirements according to the IAS2. The negative value of T when Sig. <0.05 means a lack of compliance with disclosure requirements according to the IAS2. The positive value of T when Sig. <0.05 compliance with disclosure requirements according to the IAS2. Where: CDR=Compliance with Disclosure Requirements. NCDR=Noncompliance with Disclosure Requirements. | ||||||||||
1. The amount of any write-down of inventories recognized as an expense in the period..
2. The amount of any reversal of a write-down to NRV.
3. The circumstances that lead to the write-down.
4. The amount of any reversal of any write-downs.
5. The circumstances that led to such reversal.
6. Cost of inventories recognized as an expense.
7. The total carrying amount of inventories broken into appropriate classifications.
8. The carrying amount of any inventories carried at the FMV less costs to sell.
9. The expected costs of completion and disposal that used to compute the NRV.
The aforementioned analysis proves the presence of a clear shortcoming in matching the disclosure requirements in accordance with the IAS 2.
However, Table 9 shows that only privately held corporations apply the IAS 2 incorrectly. In contract, it reveals that the publicly held corporations apply the IAS 2 correctly and in compliance with the disclosure requirements.
Examining Hypothesis Number Three
Hypothesis 3 reveals that "There are no statistically significant differences in the commitment of applying the IAS 2 (inventories) by the commercial and manufacturing companies in Palestine. It also clears that the compliance with the disclosure requirements refers to the legal form of business (privately held corporation and publicly held corporation). Hence, Mann-Whitney U test is exploited so as to examine hypothesis 3. Furthermore, table 8 illustrates Mann-Whitney U test outcomes. Mann-Whitney U test outcomes reveals the following realities:
| Table 8 The Outcomes Of Mann-Whitney U Test For Examining The Differences In Applying The Ias 2 And Compliance With Disclosure Requirements According To The Legal Form Of Business |
||||
| Panel A: Mann-Whitney U test for examining the differences in applying the policies of the IAS 2; privately held corporations and publicly held corporations. | ||||
| Mann-Whitney U | Z Value | Sig. | ||
| • Using LIFO in valuing the inventories at cost. | 741 | -2.65 | 0.008 | |
| • Applying the lower of cost or fair market value approach. | 850 | -1.74 | 0.081 | |
| • The fair market value of inventory is computed by using the replacement cost. | 831 | -1.82 | 0.069 | |
| • The fair market value of inventory is computed by using the discounted models. | 495 | -4.54 | 0.000 | |
| • The biological asset inventory is evaluated according to the IAS2. | 125 | -7.33 | 0.000 | |
| • Inventories aren't written-down if the cost is greater than NRV. | 825 | -1.87 | 0.061 | |
| • The construction assets inventory is evaluated according to the IAS2. | 192 | -6.83 | 0.000 | |
| • The net realizable value [NRV] is not allowed for measuring the market value of inventory. | 183 | -7.16 | 0.000 | |
| • The net realizable value represents the enter price of the inventory. | 739 | -2.56 | 0.010 | |
| • The amount of the write-down is not allowed to be reversed even if the inventories remain unsold. | 512 | -4.34 | 0.000 | |
| Incorrect Application of IAS 2 | 96 | -7.35 | 0.000 | |
| Panel B:Mann-Whitney U test for examining the differences in the compliance with disclosure requirements according to the IAS 2 between privately held corporations and publicly held corporations. | ||||
| • The accounting policies are adopted in measuring inventories. | 315 | -6.44 | 0.000 | |
| • The amount of any write-down of inventories recognized as an expense in the period. | 520 | -4.36 | 0.000 | |
| • The amount of any reversal of a write-down to NRV. | 192 | -7.24 | 0.000 | |
| • The circumstances or events that led to the write-down. | 441 | -5.33 | 0.000 | |
| • The amount of any reversal of any write-downs. | 144 | -7.25 | 0.000 | |
| • The circumstances that led to such reversal. | 31 | -8.32 | 0.000 | |
| • Cost of inventories recognized as an expense (cost of goods sold). | 187 | -6.85 | 0.000 | |
| • The total carrying amount of inventories broken into appropriate classifications. | 38 | -7.98 | 0.000 | |
| • The carrying amount of any inventories carried at fair value less costs to sell. | 32 | -8.29 | 0.000 | |
| • The expected costs of completion and disposal that used to compute the NRV. | 31.5 | -8.00 | 0.000 | |
| Compliance with Disclosure Requirements | 15 | -8.00 | 0.000 | |
Firstly: There is variation in applying the IAS 2 in the correct way by the privately held corporation and publicly held corporation. The Mann-Whitney U equals 96; and Sig. is less than 0.05 (see table 8, panel A).
Secondly: There is variation in the compliance with disclosure requirements according to the IAS 2 of privately held corporation and publicly held corporation. The Mann-Whitney U is equal 15; and Sig. is less than 0.05 (see table 8, panel B).
The variation is explained in the aforementioned two points (firstly and secondly). It is also explored as explained in table 9.
| Table 9 The Compliance Degree With The Ias 2 Requirements By Privately Held Corporation And Publicly Held Corporation |
||||
| Mean | T Value | Sig. | Result | |
| Panel A: Incorrect Application of IAS 2 | ||||
| Privately Held Corporations | 3.366 | 4.621 | 0.000 | Incorrect application of the IAS 2 |
| Publicly Held Corporation | 2.236 | -11.972 | 0.000 | Correct application of the IAS 2 |
| The test value of the One-Sample T test is 3.0. Ho: M=3, Ha: M ≠ 3. If Sig. >0.05, Ho must be accepted which means incorrect application of the IAS2. The negative value of T when Sig. <0.05 means the correct application of the IAS2. The positive value of T when Sig. <0.05 means incorrect application of the IAS 2. | ||||
| Panel B: Compliance with Disclosure Requirements | ||||
| Privately Held Corporations | 2.3471 | -9.111 | 0.000 | A lack of compliance with disclosure requirement according to the IAS2 |
| Publicly Held Corporations | 4.193 | 14.283 | 0.000 | Compliance with disclosure requirement according to the IAS2 |
| The test value of the One-Sample T test is 3.0. Ho: M=3, Ha: M ≠ 3. If Sig. >0.05, Ho must be accepted. This means a lack of compliance with disclosure requirement according to the IAS2. The negative value of T when Sig. <0.05 means a lack of compliance with disclosure requirement according to the IAS 2. The positive value of T when Sig. < 0.05 compliance with disclosure requirement according to the IAS 2. | ||||
Table 9 illustrates the compliance level with the IAS 2 requirements by the privately held corporations and publicly held corporation. The outcomes show that the public held industrial corporations that apply the inventory accounting policies and methods in the correct way. Where in, T value is -11.972 and Sig. is less than 0.05. They also show that the publicly held industrial corporations have compliance with the disclosure requirements consistent with the IAS 2. Hence, T value is 14.283 and Sig. is less than 0.05. Likewise, table 9 reveals that the industrial privately held corporation does not apply inventory accounting policies and methods in the correct way. Table 9 illustrates that T value is 4.621 and Sig. is less than 0.05. The industrial privately held corporations do not comply with the disclosure requirements in accordance with the IAS 2; where in T value is -9.111 and Sig. is less than 0.05.
Examining Hypothesis Number Four
Hypothesis 4 states that "There are no statistically significant differences regarding the commitment of the commercial and manufacturing companies in Palestine in applying the IAS 2 (Inventories). The compliance with disclosure requirements refers to the business activity (commercial and industrial firms). This hypothesis is examined; Wherein Mann-Whitney U test is exploited. What's more, table 10 illustrates Mann-Whitney U test outcomes. Mann-Whitney U test outcomes introduces the following realities:
Firstly: There is no variation in applying the IAS 2 in the correct way by the commercial corporations and industrial corporations. The Mann-Whitney U is equal 1007, and Sig. is greater than 0.05 (see table 10, panel A).
| Table 10 The Outcomes Of Mann-Whitney U Test For Examining The Differences In Applying The Ias 2 And Compliance With Disclosure Requirements According The Activity Of Business |
|||
| Panel A: Mann-Whitney U test for examining the differences in applying the policies the IAS 2 between commercial corporations and industrial corporations | |||
| Mann-Whitney U | Z Value | Sig. | |
| • Using LIFO in valuing the inventories at cost. | 936 | -0.88 | 0.375 |
| • Applying the lower of cost or fair market value approach. | 873 | -1.42 | 0.154 |
| • The fair market value of inventory is computed using the replacement cost. | 655 | -3.14 | 0.002 |
| • The fair market value of inventory is computed using the discounted models. | 528 | -4.17 | 0.000 |
| • The biological asset inventory is evaluated according to the IAS2. | 895 | -1.15 | 0.250 |
| • Inventories aren't written-down if the cost is greater than NRV. | 208 | -6.81 | 0.000 |
| • The construction assets inventory is evaluated according to the IAS2. | 365 | -5.38 | 0.000 |
| • The net realizable value [NRV] is not allowed for measuring the market value of inventory. | 230 | -6.70 | 0.000 |
| • The net realizable value represents the enter price of the inventory. | 1024 | -0.13 | 0.896 |
| • The amount of the write-down is not allowed to be reversed even if inventories remain unsold. | 886 | -1.24 | 0.214 |
| Incorrect Application of IAS 2 | 1007 | -0.25 | 0.799 |
| Panel B: Mann-Whitney U test for examining the differences in the compliance with disclosure requirements according to the IAS 2 between commercial corporations and industrial corporations. | |||
| • The accounting policies are adopted in measuring inventories. | 734 | -2.68 | 0.007 |
| • The amount of any write-down of inventories recognized as an expense in the period. | 957 | -0.68 | 0.495 |
| • The amount of any reversal of a write-down to NRV. | 944 | -0.81 | 0.417 |
| • The circumstances or events that led to the write-down. | 1022 | -0.15 | 0.875 |
| • The amount of any reversal of any write-downs. | 976 | -0.51 | 0.605 |
| • The circumstances that led to such reversal. | 792 | -2.03 | 0.042 |
| • Cost of inventories recognized as an expense (cost of goods sold). | 315 | -5.77 | 0.000 |
| • The total carrying amount of inventories broken into appropriate classifications. | 374 | -5.26 | 0.000 |
| • The carrying amount of any inventories carried at fair value less costs to sell. | 528 | -4.17 | 0.000 |
| • The expected costs of completion and disposal that used to compute the NRV. | 517 | -4.12 | 0.000 |
| Compliance with Disclosure Requirements | 543 | -2.65 | 0.048 |
Secondly: There is variation in the compliance with the disclosure requirements in accordance with the IAS 2 of both the commercial corporations and industrial corporations. The Mann-Whitney U is equal 543, and Sig. is less than 0.05 (see table 10, panel B).
The analysis is clarified in the aforementioned two points, (firstly and secondly) in which they will be also explained in table 11.
| Table 11 The Degree Of Compliance With The Ias 2 Requirements By Commercial Corporation And Industrial Corporations |
||||
| Mean | T Value | Sig. | Result | |
| Panel A: Incorrect Application of IAS 2 | ||||
| Commercial Corporations | 2.888 | -1.480 | 0.149 | Incorrect application of the IAS2 |
| Industrial Corporation | 3.028 | 0.250 | 0.804 | Incorrect application of the IAS2 |
| The test value of the One-Sample T test is 3.0. Ho: M=3, Ha: M ≠ 3. If Sig. >0.05, Ho must be accepted which means incorrect application of the IAS2. The negative value of T when Sig. <0.05 means the correct application of the IAS2. The positive value of T when Sig. <0.05 means incorrect application of the IAS2. | ||||
| Panel B: Compliance with Disclosure Requirements | ||||
| Commercial Corporations | 2.516 | -5.570 | 0.000 | Lack of compliance with disclosure requirement |
| Industrial Corporations | 3.302 | 2.412 | 0.046 | Compliance with disclosure requirement according to the IAS2 |
| Test value of the One-Sample T test is 3.0. Ho: M=3, Ha: M ≠ 3. If Sig. >0.05, Ho must be accepted. This means a lack of compliance with disclosure requirements according to the IAS2. The negative value of T when Sig. <0.05 means a lack of compliance with disclosure requirement according to the IAS 2. The positive value of T when Sig. <0.05 compliance with disclosure requirement according to the IAS 2. | ||||
Table 11 illustrates the degree of compliance with the IAS 2 requirements by the commercial corporations and industrial corporations. The outcomes of table 11 state that the industrial corporations apply the inventory accounting policies and methods correctly and greater than the commercial corporations. They also illustrate that there is compliance with the disclosure requirements and in accordance with the IAS 2 by the industrial corporations greater than the commercial ones.
Discussion of the Results
This part provides a debate of the results that exposes the commitment level of applying the IAS 2 "inventories" in Palestine including applying the polices of the IAS 2 and the compliance with the disclosure requirements. This study found poor application of this international accounting standard. Instead, financial managers, accountants, and internal auditors, still, to date, apply the US GAAP standard. This result is similar to previous studies that found significantly poor application of the IAS 2 at various developing countries (Al-Daoor, 2008; Obaidat and Al-Hajaia, 2013; Asiri, 2014; Kral, 2014; Onyekwelu, 2014). The misapplication of the IAS in Palestine may refer to many factors such as;
1. There is a lack of expert accountants of international accounting standards at the Palestinian corporations.
2. Most corporations in Palestine are family owned and accounted by non-experts’ people.
3. There is a lack of control on the published financial statements.
4. The Palestinian auditor does not perform his duties professionally.
Palestine has adopted international accounting standards since 2005. Before that, US accounting standards were applied. For this reason, accountants are still applying American accounting standards; where there is dissimilarity between the international accounting standards and the US accounting standards and in particular with respect to the measurement of inventory value and inventory disclosure. Hence, it becomes the responsibility of the Palestinian corporations to train accountants to implement IAS 2 in the correct manner.
Conclusion Suggestion For Future Research
The primary objectives of the present study are: i) exploring the theory and application of the main policies that relate to the IAS 2. ii) Investigating the commitment level of the Palestinian firms in applying the IAS 2 correctly. iii) Exploring the compliance with the disclosure requirements as explained in the IAS 2 among Palestinian commercial and industrial corporations. The sample consisted of 97 respondents in the year 2017. Cronbach's Alpha, Descriptive Statistics, One Sample T Test, and Mann-Whitney U test statistics were used to examine the propositions of this study. Based on the obtained results, the IAS 2 is not applied in the correct manner by the Palestinian firms. The results also showed that the (publicly held corporations) and industrial corporations apply the IAS 2 better than both the (privately held corporations) and the commercial corporations.
Similar to other papers, this paper is riddled with limitations, and from these limitations, the paper suggests directions and further work for future empirical studies. The present study focused on the firms that located in the West Bank while the firms that located in Gaza Strip were ignored due to the political circumstances. Future authors could explore this issue from the reality of Gaza Strip. In the present study, the researcher also concentrated on some accounting policies of inventories and the main disclosure requirements. Accordingly, future studies can integrate other accounting methods, polices, and disclosure requirements for goods, biological assets, constructions, and financial instruments. I do not examine the impact of the compliance with the IAS 2 on the performance of the corporations. I leave this interesting area for further research. Other limitation of this paper is the data that gathered by using a questionnaire. Future authors could explore this issue by analyzing the audited annual reports of the corporation. Additionally, future authors can extend the reasons of shortcoming in applying the IFRS and the IAS correctly. I recommend other authors to explore the information content of the compliance with applying the IFRS and the IAS correctly. Also, this study recommends the future studies to examine the impact of other variables on the compliance of applying the IAS 2 (e.g. firm's age and firm's size). Although the previous mentioned limitations, this study provides new knowledge that proved the existence of huge gap in applying the IAS 2. This gap of application leads to mislead the readers of financial statements in Palestine.
Finally, yet importantly, this manuscript recommends the Palestine Exchange to take a decision that effectively leads to applying the IAS 2 correctly. It also recommends the companies to comply with the disclosure requirements and in accordance with the IAS 2. This compliance hence has a duty to be a constant one. I think that the accounting education, auditors, accounting bodies, and Palestine Exchange in Palestine should correct this shortcoming soon.
References
- Al-Daoor, J. (2008). Factors influencing inventory methods choice at Palestinian economic entities: An empirical study. Journal of Al Azhar University Gaze, 10(1A), 279-324.
- Al-Ehmood, T. & Almomani, T. (1996). Analytical study of the used methods and polices in evaluating inventories: The case of the industrial corporations that listed in Amman bourse. The Journal of Administrative Sciences and Economics, 7, 175-199.
- ARB 43. (1953). Restatement and revision of accounting research bulletins ARB 43 status issued: June 1953 Effective Date: June 1953 (Replaced ARBs Issued September 1939-January 1953).
- Asiri, A. (2014). Saudi accounting standards between adoption and conciliation with the international accounting standards: Analytical study. Journal of King Abdulaziz University: Economics and Administration, 28(2), 33-68.
- Athanasios, B. Kanellos, T. & Konstantinos, P. (2007). The consequences of applying international accounting standards (ias) to the financial statements of greek companies. European Accounting Association Lisbon-Portugal. http://ssrn.com/abstract=985048.
- Barth, M., Landsman, W. & Lang, M. (2006). International accounting standards and accounting quality. Working Paper, Stanford University.
- Chen, X. & Zheng, M. (2012). Different inventory valuation methods based on analytic hierarchy process AHP. International Journal of Accounting and Financial Management, 1(1), 44-51.
- Doupnik, T. & Perera, H. (2015). International Accounting (Fourth Edition). McGraw-Hill Irwin, higher education.
- Emmanuel, O. & Abdullahi, Y. (2015). Inventory valuation practices and reporting: Nigerian textile industry experience. Mediterranean Journal of Social Sciences, 6(4), 74-82.
- Foley, C. & Comm, B. (2015). IAS 2-inventories: The institute of certified public accountants in Ireland. Financial Accounting Articles, 1-9.
- Gray, D. & Ehoff, C. (2014). Lower of cost or market inventory valuation: IFRS versus US GAAP. Journal of Business & Economics Research, 12(1), 19-22.
- Honkova, I. (2015). International financial reporting standards applied in the Czech Republic. Finance, 18(3), 84-90.
- Hughes, P. & Schwartz, E. (1988). The LIFO/FIFO Choice: An asymmetric information approach. Journal of Accounting Research, 26, 41-58.
- Kral, B. (2014). International accounting standard 2-inventories and Czech accounting legislation. Czech Financial and Accounting Magazine, 3, 107-121.
- Mia, A. & Qamruzzaman, M. (2016). Inventory valuation and IAS # 2 compliance in Bangladeshi manufacturing industries. The Cost and Management, 44(6), 4-12.
- Monea, A. (2011). Some aspects regarding implications of IAS 2 inventory in Romanian accounting. Annals of the University of Petro?ani, Economics, 11(4), 183-190.
- Mutai, B. (2014). The effect of adoption of international financial reporting standards on quality of financial reporting by companies listed at Nairobi securities exchange. Unpublished Master Thesis. School of Business. University of Nairobi.
- Needles, B. & Powers, M. (2012). Financial accounting (Eleventh Edition). South-Western Cengage Learning, Mason, OH.
- Nisha, N. (2015). Inventory valuation practices: A developing country perspective. International Journal of Information Research and Review. 2(7), 867-874.
- Obaidat, A. & Al-Hajaia, M. (2013). The reality of implementing international accounting standard 36 impairment of assets in Jordanian industrial company’s shareholders. ARAB Economic and Business Journal, 8, 21-30.
- Onyekwelu, U. (2014). Effects of IFRS adoption on inventory valuation and financial reporting in Nigeria. European Journal of Business and Management, 6(8), 29-34.
- PWC. (2015). IFRS and US GAAP: Similarities and differences. Price water house Coopers Publications.
- Shusheng, G. (2014). The choices of issued inventory valuation methods based on different accounting standards at home and abroad. In: Jeong, H.S., Obaidat, M., Yen, N., Park, J. (eds), Advances in Computer Science and its Applications. Lecture Notes in Electrical Engineering, Vol. 279. Springer, Berlin, Heidelberg.
- Siyanbola, T. (2012). Impact of stock valuation on profitability of manufacturing industries. International Journal of Advanced Research in Management and Social Sciences, 1(1), 35-46.
- Spiceland, D., Sepe, J. & Nelson, M. (2012). Intermediate accounting, with annual report (Seventh Edition). McGraw-Hill Irwin, Higher Education.
- Sunder, S. (1975). Stock price and risk related to accounting changes in inventory valuation. The Accounting Review, 305-315.