Research Article: 2021 Vol: 25 Issue: 3S
Factors Affecting Corporate Liquidity: Evidence from Steel Listed Companies in Vietnam
Nguyen Huu Tan, Academy of Finance, Vietnam
Keywords:
Liquidity, Factors, Corporate, Listed, Vietnam
Abstract
Liquidity affects the performance and credit risk of companies. Companies with liquidity difficulties will suffer negative impacts on performance and may lead to bankruptcy. The paper examines the influence of factors on liquidity of steel listed companies in Vietnam. The study uses regression techniques in panel data using data collected from steel companies listing on the stock market in Vietnam during 2015-2020. Liquidity of steel listed companies is measured by current assets to current liabilities, whereas firm size, debt ratio, profitability, growth rate of asset and revenue, asset structure, cash flow, market value, GDP growth rate and inflation are used as independent variables. The research results indicate that asset growth rate and asset structure have a positive effect on corporate’s liquidity, whereas debt ratio has a negative effect on corporate’s liquidity and the remaining independent variables have no correlation with firm’s liquidity. Based on the research results, the author propose the some policy implications.
Introduction
Liquidity is a group of ratios that measures a company’s ability to meet short-term obligations. The ratios commonly used to assess firm’s liquidity are current ratio, quick ratio, cash ratio. The lack of liquidity makes the company lose the opportunity to receive preferential discounts or the opportunity to earn more profit. The difficulties of liquidity can also lead to the company having to sell investment projects, assets, raise capital at high costs and in the worst case, go bankrupt. In addition, liquidity helps businesses to be flexible and gain advantages when market conditions change and to respond to the strategies of competing firms.
The study aims to examine the factors affecting firm’s liquidity of steel listed companies in Vietnam over a time period from 2015 to 2020. The study seeks to fill the existing gap by empirically analyzing firms specifics variables such as firm size (SIZE), debt ratio (DR), profitability (ROA), growth rate of asset (GTA), growth rate of revenue (GTR), asset structure (AS), cashflow generation (FUTL), market value (PE and PB), number of years of operation (AGE) and macroeconomic factors such as GDP growth rate (GDP) and inflation rate (INF).
Literature Review and Hypotheses
Opler, et al., (1999) empirically studied the factors affecting liquidity of 1,048 US companies in the period from 1971 to 1994. The research results have shown that the variables of firm size, current asset to total asset, the debt ratio was inversely correlated with liquidity. The authors concluded that large firms with better access to capital market would hold less cash, which has resulted in a lower liquidity ratio.
Ferreira & Vilela, (2004) studied the liquidity determinants of 400 firms in 12 EMU countries including Germany, Austria, France, Greece, Italy, Netherlands, Portugal, Spain, Belgium, Ireland, Finland and Luxemburg in the period from 1987 to 2000. The results have shown that liquidity had a negative correlation with debt ratio, firm size.
Bruinshoofd & Kool, (2004) conducted empirical research on the liquidity of Dutch companies. The study used data of 453 enterprises in the period from 1986 to 1997. The authors considered the factors of firm size, working capital, assets, revenue, total debt, short-term debt, investment, return on assets, uncertain income, average interest rate as independent variables. The research results have shown that the ratio of working capital, investment and the return on assets had a negative impact on the liquidity of the company.
Afza & Adnan, (2007) studied the factors of firm size, current assets to total assets and the debt ratio affecting the liquidity of the company by collecting data of 205 companies in Karachi in the period from 1998 to 2005. The research results indicated that firm size had a positive effect, while current assets to total assets and debt ratio had the opposite effect.
Baum et al., (2008), studied a sample of about 21,000 US companies in the period from 1993 to 2002, in order to find out the factors affecting corporate liquidity. The author used panel data to describe the effects of the asset growth, debt ratio and macroeconomic variables to corporate liquidity. The research results have shown that the asset growth had a positive correlation with the liquidity of the company.
Isshaq & Bokpin (2009) collected data from 1991 to 2007 in Ghana to assess the relationship between liquidity, firm size, ratio of current assets, and return on assets. The results of the study have shown that firm size, ratio of current assets and return on assets have a positive relationship with the company’s liquidity.
Chen & Mahajan, (2010) studied companies from 45 countries in the period from 1994 to 2005. The objective of the research was to assess the corporate liquidity through the factors of firm size, cash flow/assets, working capital/assets, cost of capital/assets, debt ratio, dividend. The study indicated that cash flow had a positive effect on liquidity, while working capital/assets and debt ratio had a negative effect on liquidity.
Filippo Ippolito & Ander Perez, (2011) studied the factors affecting the corporate liquidity including firm size, market value/book value, cash flow, net working capital/total assets and R&D expenses by studying a sample of over 23,000 US companies in the period from 2002 to 2008. The study showed that market value/book value and R&D expenses were negatively related to liquidity, while firm size, cash flow and net working capital ratio had a positive effect.
Gill & Mathur, (2011) studied 164 companies on the Toronto stock market in the period from 2008 to 2010 to find out the factors affecting the company’s liquidity. Size, net working capital, debt ratio, short-term debt, investment ratio and industry factors had an impact on a company’s liquidity. Variables that had a negative impact on liquidity were debt ratio, net working capital and investment ratio.
The study aims to examine the factors affecting corporate liquidity of steel listed firms in Vietnam over the time period from 2015 to 2020. In the process, it will empirically investigate both internal and external factors that affect the steel listed firms’ liquidity in Vietnam. Based on the statement above, the study has generated the following hypotheses for further verification.
H1: Firm size is positively related to the liquidity of the steel listed firm
H2: Debt ratio is negatively related to the liquidity of the listed firm
H3: Profitability is positively related to the liquidity of the listed firm
H4: The asset growth rate is positively related to the liquidity of the listed firm
H5: The return growth rate is positively related to the liquidity of the listed firm
H6: The proportion of current asset is positively related to the liquidity of the listed firm
H7: The cashflow form operation to total liability is positively related to the liquidity of the listed firm
H8: The market value is positively related to the liquidity of the listed firm
H9: The number of years of operation is positively related to the liquidity of the listed firm
H10: The GDP growth rate is negatively related to the liquidity of the listed firm
H11: The inflation rate is positively related to the liquidity of the listed firm
Model and Research Method
Research Model
Based on the review of previous research, a model has been advanced to examine the factors that may affect steel listed firms’ liquidity in Vietnam as follows:
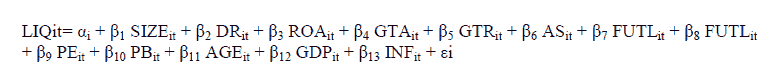
In which, LIQit is the accumulated liquidity of firm i in year t, calculated by current asset/current liabilities and thirteen independent variables have been categorized into firm specific factors (firm size, debt ratio, profitability, growth rate of assets and revenue, asset structure, cashflow to total liability, market value, number of years of operation) and microeconomic factors (GDP and inflation rate) as shown in Table 1.
| Table 1 Describe the Variable in the Research Model |
|||
|---|---|---|---|
| Variables | Code | Measurement | Impact |
| Liquidity | Liq | Current assets/Current liabilities | |
| Firm size | Size | Natural logarithm of total assets | + |
| Debt ratio | Dr | Liabilities/Total assets | - |
| Return on assets | Roa | Net profit/Average assets | + |
| Asset growth rate | Gta | (Assets1 – Assets0)/Assets0 | + |
| Revenue growth rate | Gtr | (Revenue1 – Revenue0)/Revenue0 | + |
| Asset structure | As | Current assets/Total assets | + |
| Cashflow from operation to total liabilities | Futl | Cashflow from operation/Liabilities | + |
| P/E ratio | Pe | Market price/EPS | + |
| P/B ratio | Pb | Market price/Book value | + |
| Number of years of operation | Age | From established year to 2020 | + |
| GDP growth rate | Gdp | Annual GDP growth rate | - |
| Inflation rate | Inf | Annual inflation rate | + |
Reasearch Data
Researching the factors affecting corporate liquidity of Vietnamese steel listed firms over a period from 2015 to 2020. The data of these companies is collected from their financial statements.
Data Processing Methods
The study uses the Fixed Effect and Random Effect regression methods to estimate the impact of factors on the liquidity of steel listed companies in Vietnam. The paper will use Hausman tests to examine which models of Fixed Effect and Random Effect give better estimates.
Research Results and Discussions
Descriptive Statistics
LIQ has an average value of 1.298. The maximum liquidity of steel companies listed on the Vietnam stock market is 2.513. This shows that the companies have a high ability to repay its due debts. Meanwhile, the lowest liquidity is 0.381, proving that there are some companies with weak debt repayment ability.
Firm size (SIZE) with an average value of 6.313 shows that the scale of steel companies in Vietnam is small and medium. The standard deviation value is 0.743, showing that the size of companies in the research scope is relatively uniform.
Debt ratio (DR) shows that on average, 60.12% of the assets of steel enterprises were financed by debts. The debt ratio is relatively high.
Return on assets (ROA) of steel enterprises in the research scope is 3.49%. In general, the steel enterprises have not really high return on total assets.
Asset growth (GTA) is also relatively high. Asset growth is a prerequisite for businesses to expand their operations and improve competitiveness.
Revenue growth (GTR) in the period from 2015 to 2020 of steel enterprises was quite high. There are many businesses with revenue growth greater than 100%. Revenue growth helps companies improve their liquidity.
Asset structure (AS) of steel industry enterprises is relatively high, averaging 67.69% of the total asset value. When companies allocate large current assets, it will contribute to improving firm liquidity, because these debts are guaranteed to be paid by current assets.
The mean value of cash flow from operation (FUTL), PE and PB ratio are 0.093, 11.354 and 0.930.
The variable GDP growth rate has an average value of 0.061, with a standard deviation of 0.014. The inflation rate has the largest value of 0.047, the smallest value is 0.0063. The average value of the variable is 0.027 with the standard deviation of 0.0138. as shows in Table 2.
| Table 2 Statistical Description of the Sample for the Period from 2015 to 2020 |
||||
|---|---|---|---|---|
| Variable | Mean | Std. Dev. | Min | Max |
| Liq | 1.298892 | .3815437 | .8527528 | 2.513201 |
| Size | 6.313594 | .7433829 | 5.04683 | 8.118964 |
| Dr | .6012569 | .1367412 | .2794329 | .834339 |
| Roa | .0349175 | .0560986 | -.1149955 | .2249559 |
| Gta | .1062465 | .2715102 | -.4439508 | .9135739 |
| Gtr | .0819159 | .2428383 | -.4877454 | 1.042252 |
| As | .6769219 | .1389009 | .299058 | .8942176 |
| Futl | .0931199 | .2708397 | -.3204966 | 1.484176 |
| Pe | 11.35447 | 33.81447 | -141.5493 | 232.7273 |
| Pb | .9306136 | .7273196 | .0975892 | 3.672415 |
| Age | 17.57692 | 4.889743 | 8 | 31 |
| Gdp | .0611833 | .0147197 | .0291 | .0708 |
| Inf | .02775 | .0138102 | .0063 | .0474 |
Correlation Analysis
Table 3 shows that firm size, debt ratio, assets growth rate, revenue growth rate, PB ratio and GDP growth rate have a negative relationship with liquidity ratio, while the remaining variables have a positive relationship with liquidity. The results show that the correlation coefficient between any pair of independent variables in the model is no less than 0.8 and therefore multicollinearity is unlikely to occur. To analyze more carefully, this study used the variance inflation factor to test multicollinearity issues. The findings revealed that the variance inflation factor values for all independent variables do not exceed 10.00 which suggest that there is no multicollinearity between variables
| Table 3 Results of Correlation Between Key Variables |
|||||||||||||
|---|---|---|---|---|---|---|---|---|---|---|---|---|---|
| Liq | Size | Dr | Roa | Gta | Gtr | As | Futl | Pe | Pb | Age | Gdp | Inf | |
| Liq | 1.0000 | ||||||||||||
| Size | -0.4840 | 1.0000 | |||||||||||
| Dr | -0.7179 | 0.1400 | 1.0000 | ||||||||||
| Roa | 0.0218 | 0.4389 | -0.1881 | 1.0000 | |||||||||
| Gta | -0.1094 | 0.2971 | 0.1601 | 0.4573 | 1.0000 | ||||||||
| Gtr | -0.1414 | 0.2138 | 0.1398 | 0.4731 | 0.6439 | 1.0000 | |||||||
| As | 0.4191 | -0.7238 | 0.0575 | -0.3306 | -0.0985 | -0.0475 | 1.0000 | ||||||
| Futl | 0.1566 | 0.0738 | -0.3559 | 0.1193 | -0.5594 | -0.2703 | -0.2585 | 1.0000 | |||||
| Pe | 0.0610 | 0.0352 | -0.0164 | -0.0185 | -0.1357 | -0.1165 | -0.0368 | 0.0876 | 1.0000 | ||||
| Pb | -0.2734 | 0.4464 | 0.2508 | 0.2111 | 0.2599 | 0.2196 | -0.0801 | -0.1331 | -0.1339 | 1.0000 | |||
| Age | 0.2071 | 0.3787 | -0.5316 | 0.1525 | 0.1203 | -0.0006 | -0.4320 | 0.1602 | 0.0461 | 0.0061 | 1.0000 | ||
| Gdp | -0.1228 | -0.0167 | 0.0947 | -0.0172 | 0.1871 | 0.2316 | -0.0250 | -0.2496 | -0.3059 | 0.0037 | -0.1894 | 1.0000 | |
| Inf | 0.0887 | 0.0336 | -0.0245 | 0.1172 | 0.3517 | 0.2408 | 0.1180 | -0.2539 | -0.1197 | 0.1155 | -0.0221 | 0.3611 | 1.0000 |
Regress Results
The Hausman test was adopted to select the suitable model estimation between Fixed Effect model and Random Effect model. The p-value results indicate that the Random Effect model is suitable because the Hausman p-value test is more than 0.05. The Breusch and Pagan Lagrangian multiplier test indicates that the model has heterogeneity (p-value=0.0112<0.05). Furthermore, the Wooldridge test indicates that the model has autocorrelation (p-value=0.0005<0.05) and the author proceeds to overcome the discovered defects of the model by feasible general least squares method (FGLS) with panel (heteroskedastic) corr(ar1).
The results in Table 4 show that debt ratio, assets growth rate and asset structure have statistically correlation with firm’s liquidity.
The debt ratio (DR) has a negative impact on the firm’s liquidity. Specifically, when the debt ratio increased by 1%, the liquidity decreased by 2.307%. This is consistent with economic theory. When the debt ratio increases, it means that the companies take on more debt, thereby reducing the liquidity of the enterprise. The results on the negative relationship between debt ratio and corporate liquidity are similar to previous studies of Opler, et al., (1999); Ferreira & Vilela (2004); Afza & Adnan, (2007); Chen & Mahajan, (2010); Gill & Mathur, (2011).
Assets growth rate (GTA) has a positive impact on the liquidity of steel enterprises. Specifically, when assets growth rate increased by 1%, liquitdity increased by 0.203%. As the firm size increases, the enterprise will assert its position in the market and ability with investors and creditors, so it will receive many incentives when borrowing. This result is similar to previous studies of Opler, (1999); Ferreira và Vilela (2004).
Asset structure (AS) has a positive impact on the corporate liquidity. Specifically, when the asset structure increases by 1%, the liquidity of the enterprise increases by 1.172%. When current assets increase, current liabilities will be guaranteed to be paid by more current assets. By ensuring payment of short-term debts, enterprises not only improve their financial reputation but also maintain good liquidity. This result is similar to previous studies of Garcia-Teruel & Martinez-Salano, (2007), Lyroudi & Bolek, (2012).
| Table 4 Regression Results of Panel Regression Analysis |
||||
|---|---|---|---|---|
| Variables | Vif | Regression coefficients | ||
| Fem | Rem | Fgls | ||
| Size | 4.04 | .0641941 | -.0370563 | -.0314344 |
| Dr | 2.55 | -2.197051* | -2.51464 * | -2.307615 * |
| Roa | 2.40 | .1374857 | -.3006212 | -.2281677 |
| Gta | 3.51 | .2077503 ** | .3074731 * | .2034476 * |
| Gtr | 2.00 | -.1264811 *** | -.1108061 | -.0758089 |
| As | 2.96 | .8925263 * | 1.062459 * | 1.172112 * |
| Futl | 2.32 | .0782796 | .0740999 | .038237 |
| Pe | 1.16 | .0002809 | .0008024 *** | .0003115 |
| Pb | 1.57 | .0454785 | .0011639 | -.0067882 |
| Age | 2.55 | -.0011406 | -.0090832 ** | -.0017349 |
| Gdp | 1.50 | -.8278685 | -1.104004 | -.2239702 |
| Inf | 1.37 | .2801866 | .0830205 | .0178348 |
| R-sq | 0.7941 | 0.9136 | ||
| Prob (F Statistic) | 0.0000 | 0.0000 | 0.0000 | |
| Hausman test | chi2(12)=11.02 Prob>chi2=0.5270 |
|||
| Breusch and Pagan Lagrangian multiplier test | chibar2(01)=5.21 Prob>chibar2=0.0112 |
|||
| Wooldridge test | F(1,12)=22.303 Prob>F=0.0005 |
|||
Conclusion and Recommendations
Liquidity is an important indicator for the companies. Liquidity is also a highly appreciated factor in assessing the company’s risk. Therefore, controlling liquidity helps the company to stabilize and grow better, and mobilize capital at a lower cost. The study was conducted to find out the factors affecting the liquidity of steel enterprises listed on the Vietnam stock market in the period from 2015 to 2020. The study used one dependent variable of liquidity (LIQ) and 13 independent variables, including Firm size (SIZE), Debt ratio (DR); Return on assets (ROA), Asset Growth rate (GTA), Revenue growth rate (GTR), Asset Structure (AS), Operating cash flow to total liability (FUTL), Price to EPS ratio (PE), Price to book value ratio (PB), Number of years of operation (AGE), GDP Growth (GROWTH) and Inflation rate (I).
With the results from the regression model, the study found that among the factors affecting the liquidity of steel listed enterprises in Vietnam, the debt ratio has the largest impact and best explains the change of firm liquidity. In addition, two variables of assets growth rate and asset structure also affect the liquidity.
The debt ratio has an impact on the change of liquidity, the relationship between debt ratio and liquidity is negative. Therefore, based on this information, the management can adjust the debt ratio to suit the business strategy but still ensure the liquidity and sustainable development of the company. At the same time, the company needs to control and manage its capital in accordance with its current capacity and situation, minimizing liquidity risks that may affect the company's long-term prospects.
Besides, companies in the steel industry are characterized by the need for a large amount of capital. If the enterprise scale is not large enough, the annual revenue is not stable. When the asset growth and firm size are maintained reasonably, it will create prestige with suppliers and brand quality with customers.
Steel companies listed on the Vietnamese stock market need to have a reasonable assets structure to improve their efficiency. Reasonable asset structure is the capital structure in which current assets account for a reasonable proportion to meet the sustainable production and business process. If the excess will lead to stagnation, if the shortage will cause the production and business process to be halted, and both reduce the efficiency of capital use of the enterprise.
References
- Brigham, E.F., & Houston, J.F. (2003). Fundamentals of financial management, 10th Edition. South-Western College Pub, 592–744.
- Bruinshoofd, W.A., & Kool, C.J.M. (2004). “Dutch corporate liquidity management: New evidence on aggregation”. Journal of Applied Economics, 7(2), 195–230.
- Chen, N., & và Mahajan, A. (2010). “Effects of macroeconomic conditions on corporate liquidity international evidence”. International Research Journal of Finance and Economics, 35, 112-129.
- Ferreira, M.A., & Vilela, A.S. (2004). “Why do firms hold cash? evidence from EMU countries”. European Financial Management,10(2), 295-319.
- Isshaq, Z. and Bokpin, G.A. (2009). “Corporate liquidity management of listed firms in Ghana”. Asia Pacific Journal of Business Administration, 1(2), 189-198.
- Gill, A., & Mathur, N. (2011). “Factors that influence corporate liquidity holdings in Canada”. Journal of Applied Finance &Banking, 1(2), 133-153.
- Opler, T., Pinkowitz, L., Stulz, R., & Williamson, R. (1999). “The determinants and implications of corporate cash holdings”. Journal of Financial Economics, 52, 3–46.
- Subramanyam, K.R., & Wild, J.J. (2008). Financial statement analysis, 10th Edition. McGraw-Hill/Irwin, 526 – 827.
- Zimmermann, H.J. (1991). Fuzzy set theory and its application. Kluwer Academic Publishers, London