Research Article: 2021 Vol: 25 Issue: 5
Factors Affecting Financial Performance and Health Levels of Sharia Cooperative in Jakarta
Indo Yama Nasarudin, Universitas Islam Negeri Syarif Hidayatullah
Suhendra, Universitas Islam Negeri Syarif Hidayatullah
Citation Information: Nasarudin, I., & Suhendra. (2021). Factors affecting financial performance and health levels of sharia cooperative in jakarta. Academy of Accounting and Financial Studies Journal, 25(6), 1-19.
Abstract
This study aims to analyze the factors that determine the profitability of savings and loan cooperatives and Islamic financing. The research sample consisted of 29 savings and loan cooperatives and sharia financing with the category of national-scale primary cooperatives located in Jakarta. Measurement of variables that determine profitability with the CAMELS approach and regulations of the Minister of Cooperatives and SMEs related to the health assessment of savings and loan cooperatives and Islamic financing. Based on the results of data processing and analysis with the partial least squarre method, the results of variables that have a significant effect on the profitability of savings and loan cooperatives and Islamic financing are the variables of identity, asset quality, liquidity and management variables at a significance level of 5%. Meanwhile, other variables that have a significant effect on profitability at a significance level of 10% are capital, efficiency, sharia compliance. The variables that have a positive influence on the profitability of savings and loan cooperatives and sharia financing are capital, sharia compliance, liquidity and management. While the variables of efficiency, identity and asset quality have a negative influence on the profitability of savings and loan cooperatives and sharia financing. The variables that are most dominant in influencing the profitability of savings and loan cooperatives and Islamic financing are asset quality, then management and liquidity. So that this variable becomes an important variable that needs to be considered by savings and loan cooperatives and Islamic financing in increasing the value of its profitability. The coefficient of determination is 0.403. This shows that the profitability variable can be explained by capital, earning asset quality, management aspects, efficiency, liquidity, cooperative identity, 40.30 percent compliance with sharia principles while the remaining 59.70 percent is explained by other factors.
Keywords
Profitability, Capital, Quality of Productive Assets, Management Aspects, Efficiency, Liquidity, Cooperative Identity, Compliance with Sharia Principles.
Introduction
Savings and loans cooperatives and cooperative savings and loan units are cooperative institutions that carry out business activities of collecting and distributing funds from and for members, prospective members, other cooperatives, and / or their members, which need to be managed professionally in accordance with the principle of prudence. Where in this business, it is necessary to assess the health level of the savings and loan units of cooperatives and savings and loan cooperatives in order to increase trust and provide maximum benefits to members and the community around them. Savings and Loans Cooperatives and Savings and Loans Units provide loans to their members with the aim of improving the lives of their members. Meanwhile, in providing this objective, the cooperative management always tries to provide the lowest possible interest rate so that borrowing members feel light to pay off debts. To increase the cooperative's capital, the profits are not entirely distributed to the members of the cooperative but are reserved for enlarging the cooperative's capital and the possibility of extending credit to its members. To achieve the goal of providing credit, it is necessary to monitor the use of credit that has been given, so that diversion from the use of the loan can be avoided.
Sharia cooperatives have developed quite rapidly, but in terms of quality the condition is not necessarily the case. There are still many Sharia cooperatives that initially have grown and developed then experience setbacks due to losses and then cannot operate again. The main factor that causes this is the lack of quality Human Resources both in terms of knowledge and skills in managing Sharia Cooperatives and weak supervision of managers, especially in fund management and also a lack of sense of belonging from the management of Sharia Cooperatives. The large number of sharia microfinance institutions spread across Indonesia has not yet provided a positive signal, including Islamic cooperatives. As a microfinance institution that takes sides with a weak economic community, there are many challenges and problems that arise and are faced in the development of Sharia Cooperatives, both internal and external.
The establishment of a Sharia Cooperative is often caused by a lack of professional knowledge, experience and skills regarding management, services, and human resources management. Therefore, many of these sharia cooperatives emerge and then die in a short age or grow but stand in place unable to move, and few can walk even then with limping (Sadrah, 2004).
The internal weaknesses of Islamic cooperatives mentioned above, Islamic cooperatives are also faced with tougher challenges. Islamic cooperatives can no longer rely on public trust capital on issues of sharia, such as the prohibition of usury and the interest system and running an economic system based on Islamic sharia (Sadrah, 2004). Moreover, Islamic banks and BPRs with their facilities and strong capital are increasingly narrowing the space for Islamic cooperatives to move. Plus, at this point in time the process of borrowing funds through fintech is easy, which offers a fast disbursement process. Until the end of May 2019, OJK released the number of registered fintech companies with business licenses of 113 fintech companies. Of course, this will also be a big challenge for sharia cooperatives in carrying out their operations as the spearhead of the umkm sharia economy. Therefore, like it or not, Islamic cooperatives must improve the health of their businesses in order to be able to compete and survive.
The results of previous studies indicate that simultaneously the variables of capital, quality of productive assets, management, profitability and liquidity have a significant effect on the health level of the KSP in Gianyar Regency, with a coefficient of determination of 57.6 percent. If seen partially, the variables of capital and management have no effect on the health level of the KSP in Gianyar Regency. Meanwhile, the variable of earning asset quality, profitability and liquidity had a positive and significant effect on the health level of the KSP in Gianyar Regency. The quality of earning assets is the most dominant variable that affects the health level of KSP in Gianyar Regency (Sudarma & Yasa, 2010).
Research conducted by Sri Purniyanti (2006) shows that the aspects of capital, earning asset quality, liquidity have a significant effect on the health level of KUD in Semarang Regency.
The results of research by Huda (2007), which state that the quality of productive assets, aspects of profitability, liquidity have a positive and significant effect on the health assessment of several cooperatives in the Prigi area, Watulimo District, Trenggalek Regency. Meanwhile, the management aspect has no significant effect on the health assessment of several cooperatives in the Prigi area, Watulimo District, Trenggalek Regency.
The results of research conducted by Hasmayati (2016) show the health condition of KJKS BMT At-Taqwa through the calculation of eight aspects, consisting of six financial aspects (capital, quality of productive assets, efficiency, liquidity, independence and growth, and aspects of cooperative identity) and two aspects. non-financial (aspects of management and aspects of compliance with sharia principles) shows that KJKS BMT At-Taqwa is at a fairly healthy level. The calculation results show that there is a ratio that has the greatest influence on weight by reaching a maximum value of seven ratios (NPF ratio, risk financing portfolio ratio, institutional ratio, fixed assets ratio to total assets, ROE ratio, gross participation ratio and member participation ratio) In addition, there are three ratios that have the least influence (equity to total capital ratio, staff efficiency ratio and ROA ratio). Although these three ratios have the lowest relative value, they still contribute value to the total assessment score. This implies that all ratio factors have an influence on the health level of KJKS BMT At-Taqwa.
Research conducted by Nasarudin (2016) states that aspects for health assessment consist of capital aspects, asset product quality aspects, management aspects, efficiency aspects, liquidity aspects, aspects of independence and growth and aspects of cooperative identity. Based on the results obtained, the value of all aspects of the Abdi Raharja Kerta cooperative health assessment is 81.00. It can be concluded that the Abdi Kerta Raharja cooperative has a healthy category for health assessment.
The health level of Islamic cooperatives is the quality performance of Islamic cooperatives seen from important factors that are very influential for the smooth, sustainable and successful business of Islamic cooperatives, both for the short term and long term sustainability (Yusuf, 2016). In simple terms a healthy Islamic cooperative is a sharia cooperative that can carry out its functions properly. in other words, a healthy sharia cooperative is a sharia cooperative that can maintain and maintain public trust and can carry out an intermediation function.
Knowing the level of financial health, financial performance measurement needs to be done at the end of each certain period. and this is one of the important actions that must be taken by the cooperative to determine the achievements and benefits it achieves through indicators of measuring the health level of Islamic cooperatives in the hope that the Islamic cooperative can operate normally and is able to fulfill all its obligations in accordance with applicable regulations (Afandi, 2014). The scope of health assessment of sharia savings and loan cooperatives and syariah savings and loan units and cooperative financing units is carried out on several aspects, namely aspects of capital, quality of productive assets, management, efficiency, liquidity, independence and growth, cooperative identity and sharia principles. The results of the assessment will be divided into 4 (four) groups, namely healthy, healthy enough, under special supervision and under special supervision.
Literature Review
Performance according to Bastian (2006) is a description of the achievement of implementation / program / policy in realizing the goals, objectives, mission and vision of an organization. Financial performance appraisal is carried out using two theories, namely agency theory and signal theory and theory. In agency theory, it is explained that in a company there are two interacting parties. These parties are company owners (shareholders) and company management. Shareholders are referred to as principals, while management people who are authorized by shareholders to run the company are called agents. Companies that separate management and ownership functions will be prone to agency conflicts because each party has conflicting interests, namely trying to achieve their own prosperity (Jensen & Meckling, 1976).
Fahmi (2012) financial performance is an analysis conducted to see the extent to which a company has implemented proper and correct financial implementation rules. Company performance is a description of the financial condition of a company which is analyzed using financial analysis tools, so that it can be seen about the good and bad financial condition of a company that reflects the work performance in a certain period. This is very important so that resources are used optimally in the face of environmental changes. Thorpe (2004) argues that the performance management system is about past achievements, and can be considered as an indicator of the ability to carry out successful activities in the future that help the company achieve the business goals and objectives that have been set. Good performance management is when the business achieves its goals, and as evidence that companies fulfill their customers' desires efficiently and effectively compared to their competitors. The criteria for measuring performance include financial and non-financial performance (Hatmoko, 2000). Chiao & Yang (2011) state that to measure the company's financial performance, it has many measurements such as the rate of return on assets (ROA), the rate of return on sales (ROS), the rate of return on equity (ROE) and sales growth.
CAMELS is an acronym or six parameters, capital adequacy (C), asset quality (A), management (M), efficiency (M), earnings (E), liquidity (L) and sensitivity to the market risk (S), to measure the banking and finance performance (Wanke et al., 2016). As it is shown in Table 1, CAMELS is an extended approach to the CAMEL modelwhich has been used in the USA since 1979 to judge the soundness of banks (Roman & ?argu, 2013). Later, CAMEL has been extended and used as a method to assess the soundness and financial performance of banks for the supervisory authorities in different countries (Roman & ?argu, 2013). The financial weakness and soundness were measured by the International Monetary Fund (IMF) using five major handful parameters of financial system soundness with shortening of CAMEL (capitaladequacy, asset quality, management quality, earnings size and liquidity). Nevertheless, it has been extended to include the sixth parameter “S” which reflects the bank sensitivity to the deviations in the market (Roman & ?argu, 2013). This “S” measures the sensitivity to market risks like interest rate, foreign exchange and inflation riskwhich captures the organization’s risk (Gasbarro et al., 2002). Currently, CAMELS becomes an evaluation tool for bank performance (Roman & ?argu, 2013). According to the report of IMF (2000), the IMF and world bank advocated the use of CAMELS as a valuable measure for financial system stability.
| Table 1 Equations For The Measurement Model (Outer Model) |
|||
| Indicator | Exogenous constructs (ξ1) | ||
|---|---|---|---|
| Equity to total asset | X1.1 | = | λ1 ξ1 X1.1 |
| Capital adequacy ratio | X1.2 | = | λ2 ξ1 X1.2 |
| Financing and bad debts against accounts receivable and financing | X2.1 | = | λ3 ξ2 X2.1 |
| Risk financing portfolio | X2.2 | = | λ4 ξ2 X2.2 |
| Provision for earning assets losses (PPAP) | X2.3 | = | λ5 ξ2 X2.3 |
| General management | X3.1 | = | λ6 ξ1 X3.1 |
| Institution management | X3.2 | = | λ7 ξ1 X3.2 |
| Capital management | X3.3 | = | λ8 ξ1 X3.3 |
| Asset management | X3.4 | = | λ9 ξ1 X3.4 |
| Liquidity manajement | X3.5 | = | λ10 ξ1 X3.5 |
| Service Operational Costs Against Gross Participation | X4.1 | = | λ11 ξ2 X4.1 |
| Fix asset to total asset | X4.2 | = | λ12 ξ2 X4.2 |
| Service eficiency | X4.3 | = | λ13 ξ2 X4.3 |
| Cash Rasio | X5.1 | = | λ14 ξ1 X5.1 |
| Financing to Funds Received | X5.2 | = | λ15 ξ1 X5.2 |
| Gross Participation | X6.1 | = | λ16 ξ1 X6.1 |
| Member Economy Promotion | X6.2 | = | λ17 ξ1 X6.2 |
| Sharia Principle Compliance | X7.1 | = | λ18 ξ1 X7.1 |
| Return on asset | Y1.1 | = | λ19 ξ2 Y1.1 |
| Return on equity | Y1.2 | = | λ20 ξ2 Y1.2 |
| Independent Operational Services | Y1.3 | = | λ21 ξ2 Y1.3 |
Source: data processed 2020
In measuring the level of profitability in savings and loan cooperatives and sharia financing, the variables of independence and growth are used, namely showing how far the cooperative can generate profits and be independent in terms of capital. The aspects of the independence and growth of the cooperative that are assessed include the ratio of asset profitability, ratio of capital profitability and ratio of operational independence. This asset profitability ratio is intended to measure the ability of a cooperative to earn a profit or gain from assets or capital being managed. The measurement is done by comparing the SHU before tax with total assets. The higher the value of the asset profitability ratio, the better the independence and growth of the cooperative (Nasarudin, 2016).
In measuring the health level of cooperatives and sharia financing, the CAMELS approach is also used plus the variables of cooperative identity and compliance with sharia principles. Capital is a financial aspect that plays an important role in a business entity including cooperatives. A healthy level of cooperative capital will show how qualified the level of cooperative business entity is. The capital aspects assessed include the ratio of own capital to total assets, the ratio of own capital to risky loans, and the ratio of own capital adequacy. The ratio of own capital to total assets is intended to measure the ability of the cooperative's fixed capital to support funding of total assets. The measurement is done by comparing the equity itself with total assets (Nasarudin, 2016). The assessment of the capital aspect is carried out using two capital ratios, namely the comparison of own capital to total assets and the Capital Adequacy ratio (Harto et al., 2018).
Earning Asset Quality is investment of funds both in rupiah and foreign currency in the form of financing, receivables, securities, placements, equity participation, temporary equity participation, commitments and contingencies in administrative account transactions. Productive assets are a source of income, as a definite source of income has the greatest risk. Potential losses from these risks can be anticipated by establishing an Allowance for Earning Asset Losses (PPAP) in the form of general reserves and special reserves so as to cover possible losses that will occur (Taswan, 2005). The quality of productive ativa is used to see the wealth of the cooperative that brings income to the cooperative concerned (Sadriatwati, 2020).
According to Yusuf (2016) Management is a typical process consisting of planning, organizing, mobilizing and controlling actions that are carried out to determine and achieve predetermined targets through the use of human resources and other sources. According to Nasarudin (2016) management is a system divided into planning, organizing, actuating, and controlling which are carried out to achieve predetermined goals by using humans and other resources. Management aspects are assessed based on 5 components. The components in question are components of general management, institutional management, capital management, asset management and liquidity management.
The concept of efficiency in Islam is to use a minimum of resources to avoid redundant actions. Efficiency in Islam is not only beneficial for business actors, in this case cooperatives, but also for consumers, when the resources used by the cooperative are only a few, the costs to be incurred by consumers are small, and vice versa. The concept of efficiency is in line with sharia principles which aim to achieve and maintain the maqashid of sharia, namely the maintenance of al-maal. This concept is as contained in the Al-Qur 'an Surah Al Israa' verses 26-27 (An-Nabhani, 1996). In savings and loan cooperatives and sharia financing, the efficiency assessment shows how much the cooperative is able to provide efficient services to its members based on the use of assets it already has. The efficiency aspects assessed include the ratio of service operating costs to gross participation, the ratio of operating expenses to gross SHU, and the ratio of service efficiency (Nasarudin, 2016; Harto et al., 2018).
Kasmir (2009), the liquidity ratio is a ratio that shows the company's ability to pay its short-term debts that are due or the ratio to determine the company's ability to finance and fulfill obligations when they are collected. Savings and loan cooperatives and sharia financing. The cooperative liquidity ratio is used to measure the level of liquidity (fluency) of the cooperative in meeting its short-term obligations. Aspects of liquidity that are assessed include the ratio of cash and bank to current liabilities and the ratio of loans to funds received (Nasarudin, 2016; Harto et al., 2018).
Assessment of the identity of a cooperative is intended to conduct an assessment with regard to how much the cooperative can achieve its objectives in promoting its members. The aspects of cooperative identity that are assessed include the gross participation ratio and the economic promotion ratio of members. The gross participation ratio is intended to measure the ability of the cooperative to activate its members regarding savings and loans. The measurement is done by comparing gross participation with gross participation plus income. (Nasarudin, 2016; Harto et al., 2018).
Sharia Compliance is the fulfillment of obligations carried out by cooperatives in carrying out their business operations to comply with the MUI DSN fatwas and the Sharia Supervisory Board. Assessment of the compliance aspect of sharia principles is used to assess the extent to which sharia principles are applied or adhered to by sharia cooperatives in carrying out their activities (Harto et al., 2018).
Research Methode
This research is an associative study that looks at the relationship between variables. Research variables include capital, quality of productive assets, management, efficiency, liquidity, independence and growth, cooperative identity, sharia compliance and profitability. The sample used in this study is a national scale sharia savings and loan cooperative (KSPPS) whose management and supervision are carried out by the Ministry of Cooperatives and SMEs of the Republic of Indonesia. The sampling technique used is purposive sampling with the criteria of savings and loan cooperatives and sharia financing located in the territory of Indonesia which has chapters in several provinces, as primary cooperatives supervised by the Ministry of Cooperatives and SMEs, the cooperatives used as samples have complete audited financial reports. and periodically provide financial reports and health assessments to the Deputy for Supervision of the Indonesian Ministry of Cooperatives and SMEs. The number of research samples was 29 samples.
The data used in this study is secondary data obtained from various sources, namely literature study is a data collection technique by collecting data from theories that come from various references that support this research, including journal articles, literature, books. and so on relating to this research. Then survey with the help of questionnaires and health assessment working papers to find out the financial ratios that exist in the cooperative.
The data analysis technique was performed using the Partial Least Square (PLS) method. PLS is a method of solving structural equation modeling (SEM), which is a statistical technique for testing and estimating causal relationships by integrating factor analysis and path analysis (Simon, 2004) which in this case (according to research objectives) is more precise than other SEM techniques. Small sample size, potential distribution of abnormal variables, and use of formative and reflexive indicators make PLS more appropriate. Partial least square analysis (PLS) is a variant-based SEM statistical technique designed to solve structural problems involving many variables or constructs when the sample size is small, there are missing data values and multicollinearity (Field, 2000). The SEM modeling process consists of two basic stages, namely validation of the measurement model and testing of the structural model. SEM prioritizes confirmatory modeling rather than exploratory modeling so that it is more appropriate to use for testing quantitative theories than qualitative theory development. The choice of the PLS method is based on the consideration that PLS is able to model many dependent and independent variables, managing multicollinearity problems between independent variables. The results remain robust even though there are data that are not normal and missing. Generating a cross-product based direct independent latent variable involving the dependent latent variable as predictive power. In estimating PLS parameters, there are three categories, namely Weight Estimate, Path Estimate and Means and parameter location. Weight estimate is used in creating scores from latent variables. Path Estimate is used to connect latent variables and also connect latent variables with the indicators. Meanwhile, Means and parameter locations are the regression constant values of indicators and other variables. To apply the PLS model in this study, the Smart PLS software tool was used. In this study, the measurement model test was carried out on 21 manifest variables or observed variables which formed the 8 factors or unobserve variables used in the study. A total of 2 dimensions are used to form the capital variable. The measurement model equation for the capital variable is as shown in Table 1 as follows:
The method of estimating parameters in PLS is the least square method. The calculation process is done by iteration, where the iteration will stop when convergent conditions have been reached. Estimating parameters in the PLS include three things, namely:
1. Weight estimate is used to create a latent variable score.
2. Path estimate that connects latent variables and the estimated loading between latent variables and the indicator.
3. Means and parameter locations (regression constant values, intercept) for indicators and latent variables.
The model fit test is carried out on two models, namely the measurement model or outer model and the structural model or inner model.
a. Outer Model
The correlation between the reflective indicator score and the latent variable score. For this, loading 0.5 is considered sufficient if the number of indicators per construct is not large, ranging from 3 to 7 indicators. Comparing the square root of average variance extracted (AVE) value of each construct with the correlation between other constructs in the model, if the square root of average variance extracted construct is greater than the correlation with all other constructs it is said to have good discriminant validity. Recommended measurement value greater than 0.50.
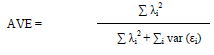
Where λi is the loading component to the indicator and var (εi) is 1- λi2 if all indicators are standardized, then this measurement is the same as the average communalities in the block. The indicator group that measures a variable has good composite reliability if it has a composite reliability greater than or equal to 0.7, even though it is not an absolute standard.
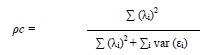
Where λi is the loading component to the indicator and r (εi) is 1- λi2. Compared to Cronbach alpha, this measure does not assume or be equivalent between measures assuming all indicators are weighted equally. So that Cronbach alpha tends to lower bound estimate reliability, while ρc is a closer approximation with the assumption that the parameter estimate is accurate, ρc as a measure of internal consistence can only be used for constructs with reflective indicators.
b. Inner Model (Structural Model)
The goodness of fit of the model is measured using the R-Square of the dependent latent variable with the same interpretation as the regression; Q-square predictive relevance for structural models, measures how well the observed value is generated by the model and also its parameter estimates. Q-square value> 0 indicates that the model has predictive relevance. Conversely, if the Q-square value ≤ 0 indicates that the model lacks predictive relevance. Q-square calculation is done with the formula:
![]()
Where R12 R22 Rp2 is the R-square of the endogenous variables in the equation model. The quantity of Q2 has a value with a range of 0 <Q2 <1, where the closer to 1 means that the model is getting better. The magnitude of Q2 is equivalent to the total coefficient of determination in the path analysis.
To see the effect of exogenous latent constructs (financial resources and intangible assets) on competitive strategies and financial performance when they are not present in the model, the effect size (f2) evaluation can be used. The effect value size (f2) can be calculated with the following formula:
![]()
If the value of f2 is close to 0.02, the effect is weak, if the value of f2 is close to 0.15, then the effect is medium and if the value of f2 is close to 0.35, it is stated that the effect is large (Henseler et al., 2009).
In PLS analysis, it can be calculated that the effect, either directly or indirectly, of one latent variable on the other latent variable, and the total of these two effects can be calculated. Identification of the influence of exogenous latent variables on endogenous latent variables is not only the direct effect (DE) but also the indirect effect (IE). The indirect effect explains the effect of the causal variable on the effect variable that occurs through other endogenous latent variables which are treated as intermediate variables. The amount of the indirect effect can be determined by the following equation (Hair et al., 2006).
![]()
Based on the direct and indirect effects, then the total effect (TE) can be determined (Schumacker & Lomax, 1996; Hair et al., 2006) exogenous latent variables to exogenous latent variables to endogenous latent variables
TE = DE + IE
To find out the health value of the Sharia Cooperative, the researcher first calculates the score of each aspect that is assessed according to the regulations of the Ministry of Cooperatives and SMEs. There are eight aspects, namely the aspect of capital, aspects of earning asset quality, aspects of management, aspects of efficiency, aspects of liquidity, aspects of cooperative identity, aspects of independence and growth and aspects of compliance with sharia principles. Capital aspect which consists of Own Capital ratio and CAR. Quality aspect of earning assets consisting of NPF and PPAP ratios. Management aspects which consist of general management, institutional, capital, assets, and liquidity.
The efficiency aspect consists of the ratio of operational costs to services, fixed assets to total assets, and staff efficiency. The liquidity aspect consists of cash ratios and financing ratios. Aspects of Cooperative Identity which consist of Member Economic Promotion Ratio and Gross Participation Ratio. Aspects of Independence and Growth which consist of Asset Profitability Ratio, Equity Profitability Ratio, and Operational Independence Ratio. Sharia Principal Compliance Aspects in Figure 1.

Figure 1: Research Model
By Model:
KP = MDL + KAP + MNJ + EFS + LKD + JDK + KPS
Where:
KP = Profitability
MDL = Capital
KAP = Earning Asset Quality
MNJ = Management
EFS = Efficiency
LKD = Liquidity
JDK = Cooperative Identity
KPS = Compliance with Sharia Principles
Result and Analysis
The measurement model (outer model) is basically a validity and reliability test whose purpose is to measure the relationship between the indicator and its construct. In other words, this model describes how much the indicators in the model explain their latent constructs or variables. In this study, the model test was carried out on 21 manifest or observed variables which formed the 7 latent variables (unobserve variables) used in the study which will be explained as follows.

Figure 2: Path Coefficients And Outer Model Values.
Figure 2 provides information regarding the outer model results for all variables. To see the significance of each loading factor is greater than 0.5 or the critical ratio value is greater than the t-table value, namely 1.6440. So that the factor loading value less than 0.5 is removed from the model because the indicator is not valid in measuring the variable.
After testing the validity and the loading factor value of each variable that has been valid in measuring the variable. The results of the validity measurement of the capital aspect variable show that all indicators have a loading factor value greater than 0.5 or a critical ratio value greater than the t-table value, namely 1.6440 or seen from the probability value far below the significance level of 0. 05. C1 is an indicator of own capital to total assets which is significant in shaping the capital aspect variable because the estimated value is more than 0.5. For other indicators, the same result is also obtained, namely C2, namely the capital adequacy ratio has a loading factor value of more than 0.5 or the critical ratio value is greater than the t-table value, namely 1.6440. So that all observed variables are valid in forming their latent construct. The most dominant indicator in measuring the capital aspect variable is the capital adequacy ratio with a loading factor value of 0.978.
| Table 2 Measurement Model (Outer Model) Variable Aspects Of Capital |
|||||
| Original Sample (O) | Sample Mean (M) | Standard Deviation (STDEV) | T Statistic | P Values | |
|---|---|---|---|---|---|
| C1 <- Capital | 0.974 | 0.965 | 0.004 | 258.520 | 0.000 |
| C2 <- Capital | 0.978 | 0.968 | 0.005 | 187.992 | 0.000 |
| K1 <- Asset Quality | 0.998 | 0.998 | 0.001 | 1.347.476 | 0.000 |
| K2 <- Asset Quality | 0.998 | 0.998 | 0.001 | 1.223.047 | 0.000 |
| M1 <- Management | 0.795 | 0.712 | 0.091 | 8.719 | 0.006 |
| M3 <- Management | 0.750 | 0.775 | 0.168 | 4.4469 | 0.023 |
| M4 <- Management | 0.764 | 0.894 | 0.031 | 24.571 | 0.001 |
| E1 <- Eficiency | 0.959 | 0.982 | 0.007 | 141.715 | 0.000 |
| E3 <- Eficiency | 0.726 | 0.734 | 0.082 | 8.863 | 0.006 |
| KP1 <- Profitability | 0.982 | 0.967 | 0.005 | 184.689 | 0.000 |
| KP3 <- Profitability | 0.792 | 0.901 | 0.026 | 30.934 | 0.001 |
Source: data processed 2020
The results of measuring the validity of the variable aspects of the quality of productive assets show that all indicators have a loading factor value greater than 0.5 or a critical ratio value greater than the t-table value of 1.6440 or seen from the probability value far below the significance level of 0.05. Based on table 2, it is known that the loading factor value for each indicator on the variable aspects of earning asset quality. K1 is the ratio of the level of financing and non-performing receivables to the number of receivables and significant financing in shaping the quality aspect of earning assets because the estimated value is more than 0.5. For other indicators, the same results also obtained, namely K2, which is the ratio of the risky financing portfolio, which has a loading factor value of more than 0.5 or the value of the critical ratio value is greater than the t-table value, namely 1.6440. Meanwhile, the K3 indicator, namely the ratio of allowance for earning assets losses, is invalid because it has a value of loading factor below 0.5 as shown in Figure 2.
The results of measuring the validity of the management aspect variable show that all indicators have a loading factor value greater than 0.5 or a critical ratio value greater than the t-table value, namely 1.6440 or seen from the probability value far below the significance level of 0, 05. Based on Table 4, it is known that the loading factor value for each indicator on the management aspect variable. M1 is a significant General Management in forming management variables because the estimated value is more than 0.5. Another indicator also obtained the same result, namely M3, which is capital management, has a loading factor value of more than 0.5 or a critical ratio value greater than the t-table value, namely 1.6440. Then M4 is Asset Management. Meanwhile, M2 indicator, namely institutional management and M5, namely liquidity management, is invalid because it has a loading factor value below 0.5 as shown in Figure 2. Thus, the observed variables M1, M3 and M4 are valid in forming their latent construct.
The results of measuring the validity of the efficiency variable show that all indicators have a loading factor value greater than 0.5 or a critical ratio value greater than the t-table value, namely 1.6440 or seen from the probability value far below the significance level of 0, 05. Based on Table 4, it is known that the loading factor value for each indicator on the efficiency aspect variable. E1 is the ratio of service operational costs to gross participation which is significant in shaping the variable aspects of earning assets quality because the estimated value is more than 0.5. For other indicators, the same results also obtained, namely E3, which is the Service Efficiency Ratio, which has a loading factor value of more than 0.5 or the critical ratio value is greater than the t-table value, namely 1.6440. Meanwhile, the E2 indicator, namely the ratio of fixed assets to total assets. The ratio of allowance for earning assets losses is not valid because it has a loding factor value below 0.5 as shown in the figure. 2. Thus the observed variables E1 and E3 are valid in forming their latent construct. For other variables, namely the variable aspects of liquidity, cooperative identity and sharia compliance have a single loading factor because the other loading factors are invalid in measuring the variables so they have been removed from the model as shown in Figure 2. The results of measuring the validity of the profitability aspect variable show that all indicators have a loading factor value greater than 0.5 or a critical ratio value greater than the t-table value, namely 1.6440 or seen from the probability value far below the significance level of 0, 05. Based on Table 6, it is known that the loading factor value for each indicator on the variable aspects of profitability. KP1 is a significant asset profitability in forming management variables because the estimated value is more than 0.5. Another indicator also obtained the same result, namely KP2 = Equity Rentability, which means that capital management has a loading factor value of more than 0.5 or the value of the critical ratio value is greater than the t-table value, namely 1.6440. Then KP3 = Service Operational Independence also has a loading factor value of more than 0.5 or the value of the critical ratio value is greater than the t-table value, namely 1.6440.
Table 3 shows the Cronbach alpha value and composite reliability. The parameters used to assess reliability are Cronbach alpha and composite reliability. According to Chin (1995) states that an indicator is said to be reliable if the value of Cronbach alpha is more than 0.6 and the composite reliability is more than 0.7. The results of Cronbach alpha and composite reliability are presented in table 3. Based on table 3, it is known that the variables used in this study are capital variables, earning asset quality, management aspects, efficiency, liquidity, cooperative identity, compliance with sharia principles and profitability.
| Table 3 Value Of Cronbach Alpha And Composite Reliability |
||||
| Cronbach Alpha | Rho_A | Composite Reliability | Average Variance Extracted (AVE) | |
|---|---|---|---|---|
| Capital | 0.950 | 0.956 | 0.976 | 0.952 |
| Eficiency | 0.668 | 1.050 | 0.837 | 0.723 |
| Identity | 1.000 | 1.000 | 1.000 | 1.000 |
| Sharia Complience | 1.000 | 1.000 | 1.000 | 1.000 |
| Asset Quality | 0.996 | 0.997 | 0.998 | 0.996 |
| Likuidity | 1.000 | 1.000 | 1.000 | 1.000 |
| Management | 0.695 | 0.599 | 0.813 | 0.593 |
| Profitability | 0.865 | 0.916 | 0.918 | 0.789 |
Source: data processed 2020
The results of the calculation of the reliability of the capital aspect variable can be seen from the composite reliability value of 0.976, greater than 0.7. The average variance extracted (AVE) value of 0.952 is greater than 0.5 and the Cronbach alpha value of 0.950 is greater than 0.7. So that all dimensions of the aspects of capital are reliable in measuring the latent construct. The results of the calculation of the reliability of the variable aspects of the quality of earning assets, seen from the composite reliability value of 0.998, are greater than 0.7. The average variance extracted (AVE) value of 0.996 is greater than 0.5 and the Cronbach alpha value of 0.996 is greater than 0.7. So that all indicators are reliable in measuring the latent construct.
The results of the calculation of the reliability of the management aspect variable can be seen from the composite reliability value of 0.813, greater than 0.7. The average variance extracted (AVE) value of 0.593 is greater than 0.5 and the Cronbach alpha value of 0.695 is closer than 0.7. So that all indicators are reliable in measuring the latent construct. The results of the calculation of the reliability of the efficiency aspect variable, seen from the composite reliability value of 0.837, are greater than 0.7. The average variance extracted (AVE) value of 0.723 is greater than 0.5 and the Cronbach alpha value of 0.668 is closer than 0.7. So that all indicators are reliable in measuring the latent construct. The results of the calculation of the reliability of the variable in the profitability aspect can be seen from the composite reliability value of 0.918 which is greater than 0.7. The average variance extracted (AVE) value of 0.789 is greater than 0.5 and the Cronbach alpha value of 0.865 is greater than 0.7. So that all indicators are reliable in measuring the latent construct. The variables used in this study are capital variables, productive asset quality, management aspects, efficiency, liquidity, cooperative identity, sharia principles compliance and Cronbachs alpha profitability is more than 0.6 and the value of composite reliability is more than 0.7. So, it can be concluded that the variables used in this study are reliable.
The discriminant validity test parameters can be seen from the results of cross loading, AVE roots and the correlation of latent variables. The results of the AVE root and the correlation of the latent variables are presented in Table 4 and the results of the cross loading are presented in Table 5. Based on Table 4, it can be seen that the AVE roots in all variables are greater than the correlation between latent variables. And in Table 4 it is also known that the indicators used to measure the variables of capital, earning asset quality, management aspects, efficiency, liquidity, cooperative identity, compliance with sharia principles and profitability have valid indicator values that measure these variables are the highest and have a value. more than 0.7. So, it can be concluded that the variables and indicators used in this study have met the discriminant validity in Table 5.
| Table 4 Ave Roots And Correlation |
||||||||
| Capital | Eficiency | Identity | Sharia Complience | Asset Quality | Likuidity | Management | Profitability | |
|---|---|---|---|---|---|---|---|---|
| Capital | 0.976 | |||||||
| Eficiency | -0.084 | 0.851 | ||||||
| Identity | -0.529 | -0.131 | 1.000 | |||||
| Sharia Complience | -0.270 | 0.104 | 0.326 | 1.000 | ||||
| Asset Quality | 0.247 | 0.252 | -0.224 | 0.017 | 0.998 | |||
| Likuidity | 0.242 | 0.061 | 0.101 | 0.060 | 0.146 | 1.000 | ||
| Management | 0.054 | 0.006 | -0.045 | 0.026 | 0.378 | -0.018 | 0.770 | |
| Profitability | 0.175 | -0.337 | -0.075 | 0.074 | -0.360 | 0.177 | 0.093 | 0.888 |
Source: data processed 2020
| Tabel 5 Cross Loading |
||||||||
| Capital | Eficiency | Identity | Sharia Complience | Asset Quality | Likuidity | Management | Profitability | |
|---|---|---|---|---|---|---|---|---|
| C1 | 0974 | -0.101 | -0.508 | -0.288 | 0.180 | 0.321 | -0.069 | 0.163 |
| C2 | 0.978 | -0.065 | -0.525 | -0.241 | 0.298 | 0.159 | .164 | 0.178 |
| E1 | -0.111 | 0.959 | -0.114 | 0.014 | 0.206 | 0.089 | -0.032 | -0.363 |
| E3 | 0.012 | 0.726 | -0.123 | 0.284 | 0.271 | -0.029 | 0.095 | -0.150 |
| J2 | -0.529 | -0.131 | 1.000 | 0.326 | -0.224 | 0.101 | -0.045 | -0.075 |
| K1 | 0.250 | 0.262 | -0.216 | 0.043 | 0.998 | 0.141 | 0.380 | -0.364 |
| K2 | 0.244 | 0.242 | -0.230 | -0.008 | 0.998 | 0.141 | 0.380 | -0.364 |
| KP1 | 0.166 | -0.307 | -0.085 | 0.048 | -0.426 | 0.144 | 0.095 | 0.982 |
| KP2 | -0.242 | -0.160 | 0.093 | 0.150 | -0.218 | 0.160 | -0.085 | 0.881 |
| KP3 | 0.428 | -0.399 | -0.161 | 0.029 | -0.281 | 0.160 | -0.085 | 0.881 |
| KS | -0.270 | 0.104 | 0.326 | 1.000 | 0.017 | 0.060 | 0.026 | 0.074 |
| L2 | 0.242 | 0.061 | 0.101 | 0.060 | 0.146 | 1.000 | -0.018 | 0.177 |
| M1 | 0.045 | 0.029 | 0.103 | 0.268 | 0.171 | 0.140 | 0.795 | 0.083 |
| M3 | 0.051 | 0.001 | -0.204 | -0.203 | 0.445 | -0.221 | 0.750 | 0.073 |
| M4 | -0.010 | -0.090 | 0.011 | -0.216 | 0.236 | 0.112 | 0.764 | 0.019 |
Source: data processed 2020
After passing the validity and reliability test, the inner model is evaluated. The parameters used to evaluate the inner model in SmartPLS are the determinant coefficient (R2 test) and the path coefficient or t-value. The value of R2 is used to measure the degree of variation in the change in the independent variable on the dependent variable. based on the output, it is known that the value of R2 is 0.403. R2 value is used to see the Goodness of Fit (GOF), because it only consists of one endogenous variable, namely profitability. so that the value of R2 means that the profitability model can be explained by the variables of capital, earning asset quality, management aspects, efficiency, liquidity, cooperative identity, compliance with Islamic principles of 40.30% and the remaining 59.7% is explained by other variables not included in the model. Thus, it can be concluded that this research model is good as a research model because the R2 value is more than 80%. Because the higher the R2 value, the better the predictive model of the proposed research model. After calculating the Goodness of Fit (GOF), the next step is testing the hypothesis with the path coefficient. Path coefficient is a coefficient that shows the level of significance in hypothesis testing.
Information
C1 = ratio of own capital to total assets
C2 = capital adequacy ratio (CAR)
K1 = The ratio of the level of financing and non-performing receivables to the number of receivables and financing
K2 = Risk financing portfolio ratio
K3 = Ratio of allowance for earning assets losses (PPAP)
M1 = General Management
M2 = Institutional Management
M3 = Capital Management
M4 = Asset Management
M5 = Liquidity Management
E1 = Ratio of Service Operational Costs to Gross Participation
E2 = Ratio of Fixed Assets to Total Assets
E3 = Service Efficiency Ratio
L1 = Cash Ratio
L2 = Ratio of Financing to Funds Received
J1 = Gross Participation Ratio
J2 = Member Economic Promotion Ratio (PEA)
KS = Compliance with Sharia Principles
KP1 = Asset profitability
KP2 = Equity Rentability
KP3 = Independence of Service Operations
The following is a picture of a structural model of the influence of capital, earning asset quality, management aspects, efficiency, liquidity, cooperative identity, compliance with sharia principles on profitability as shown in Figure 3.

Figure 3:Path Coefficients And Outer Model Values
Based on Table 6, information is obtained regarding the effect of capital, earning asset quality, management aspects, efficiency, liquidity, cooperative identity, compliance with sharia principles on profitability. The path coefficient value for the effect of capital on profitability is 0.138. Judging from the critical value (critical ratio), the value is 2.007. For the right-side test, the critical value is smaller than the t-table value, which is 2.58 (2.007 <2.58). Thus, it does not reject the null hypothesis at 5% alpha. However, at 10% alpha the null hypothesis is rejected, so it can be stated that there is a significant positive effect of the capital variable on profitability. The results of this study are also supported by previous research conducted by Khoirul Mustakim, an analysis of the effect of capital structure, quality of productive assets, liquidity and efficiency on Independence and Profitability Growth of BMT Sunan Kalijaga which concludes that the capital aspect does not have a significant effect on the profitability of cooperatives.
| Table 6 The Effect Of Capital, Quality Of Productive Assets, Aspects Of Management,Efficiency, Liquidity, Cooperative Identity, Compliance With Sharia Principles On Profitability |
|||||
| Original Sample (O) | Sample Mean (M) | Standard Deviation (STDEV) | T Statistic | P Values | |
|---|---|---|---|---|---|
| Capital -> Proitability | 0.138 | 0.473 | 0.069 | 2.007 | 0.091 |
| Eficiency -> Profitabiklity | -0.062 | -0.200 | 0.116 | 2.259 | 0.076 |
| Identity -> Profitability | -0.233 | 0.185 | 0.014 | 16.828 | 0.002 |
| Sharia complience–> Profitability | 0.201 | 0.036 | 0.081 | 2.489 | 0.065 |
| Asset quality -> Profitability | -0.523 | -0.319 | 0.029 | 18.069 | 0.002 |
| Likuidity -> Profitability | 0.252 | -0.211 | 0.003 | 96.313 | 0.000 |
| Management -> Profitability | 0.273 | -0.250 | 0.068 | 4.031 | 0.028 |
Source: data processed 2020
The path coefficient value for the effect of efficiency on profitability is -0.262. Judging from the critical value (critical ratio), the value is 2.259. For the left side test the critical value is greater than the t-table value which is equal to -2.58 (-2.259> -2.58). Thus, it does not reject the null hypothesis at 5% alpha. However, at 10% alpha the null hypothesis is rejected, so it can be stated that there is a significant negative effect of the efficiency variable on profitability. This result is also supported by previous research conducted by Nofiyati (2016) in her research The Effect of Liquidity, Solvency and Efficiency on Profitability of BMT BIF Bugisan Yogyakarta Branch 2012-2015 which concludes that efficiency has a negative and significant effect on profitability or independence.
The path coefficient value for the effect of identity on profitability is -0.233. Judging from the critical value, the value is 16.828. For the left-hand test, the critical value is smaller than the t-table value, which is -2.58 (-16.828 <-2.58). Thus reject the null hypothesis at alpha 5% so that it can be stated that there is a significant negative effect on the variable identity on profitability.
The path coefficient value for the effect of sharia compliance on profitability is 0.201. Judging from the critical value, the value is 2.489. For the right side test, the critical value is smaller than the t-table value, which is 2.58 (2.489 <2.58). Thus, it does not reject the null hypothesis at 5% alpha. However, at 10% alpha the null hypothesis is rejected, so it can be stated that there is a significant positive effect of sharia compliance variables on profitability.
The path coefficient value for the effect of earning asset quality on profitability is -0.523. Judging from the critical value, the value is 18.069. For the left side test, the critical value is smaller than the t-table value which is equal to -2.58 (-18.069 <-2.58). Thus reject the null hypothesis at alpha 5%. So, it can be stated that there is a significant negative effect of the quality of earning assets on profitability. This result is different from previous research conducted by Asep Muammar in his research on the effect of earning asset quality on profitability at Bank BNI Syariah which concludes that the quality of earning assets does not have a significant effect on profitability or independence.
The path coefficient value for the effect of liquidity on profitability is 0.252. Judging from the critical value, the value is 96.313. For the right side test, the critical value is greater than the t-table value, which is 2.58 (96.313> 2.58). Thus reject the null hypothesis at alpha 5% so that it can be stated that there is a significant positive effect of the liquidity variable on profitability. This result is also supported by previous research conducted by Nofiyati (2016) in her research The Effect of Liquidity, Solvency and Efficiency on Profitability of BMT BIF Yogyakarta Bugisan Branch 2012 - 2015 which concludes that Efficiency has a negative and significant effect on Profitability or Independence.
The path coefficient value for the influence of management on profitability is 0.273. Judging from the critical value, the value is 4.031. For the right-hand test, the critical value is greater than the t-table value, which is 2.58 (4.031> 2.58). Thus reject the null hypothesis at alpha 5% so that it can be stated that there is a significant positive effect of management variables on profitability.
The following presents a structural equation model of the structural influence of capital, earning asset quality, management aspects, efficiency, liquidity, cooperative identity, compliance with sharia principles on profitability.
Profitability =0,138C-0,262E-0,233J+0,201 KS –0,523KA + 0,252L + 0,273M
(0.091) (0.076) (0.002) (0.065) (0.002) (0.000) (0.028)
To be able to categorize whether the influence of capital, earning asset quality, management aspect, efficiency, liquidity, the identity of the cooperative, compliance with sharia principles on profitability is weak, moderate and strong, categorization can be carried out based on the value of the effect size (f2). If the value of f2 approaches 0.02, the effect is weak, if the value of f2 is close to 0.15, it is stated that the effect is medium and if the value of f2 is close to 0.35 then the effect is large (Henseler et al., 2009). The calculation results show that the effect size (f2) for the capital variable is 0.018, ranging from 0.02. So, it can be stated that the effect of capital on profitability is weak. The effect size (f2) value for the efficiency variable is 0.098, ranging from 0.15. This shows that the effect of efficiency on profitability is moderate. The effect size (f2) for the identity variable is 0.053, ranging from 0.15 to the value. This shows that the effect of identity on profitability is moderate. The effect size (f2) for the sharia compliance variable is 0.058, ranging from 0.15. This shows that the effect of sharia compliance on profitability is moderate. The effect size (f2) for the variable of earning asset quality is 0.329, ranging from 0.35. This shows that the effect of earning asset quality on profitability is strong in Table 7.
| Table 7 Value Of F Square |
|||||
| Original Sample (O) | Sample Mean (M) | Standard Deviation (STDEV) | T Statistic | P Values | |
|---|---|---|---|---|---|
| Capital -> Proitability | 0.018 | 0.229 | 0.097 | 0.187 | 0.434 |
| Eficiency -> Profitabiklity | 0.098 | 0.062 | 0.051 | 1.905 | 0.099 |
| Identity -> Profitability | 0.053 | 0.040 | 0.004 | 14.343 | 0.002 |
| Sharia complience–> Profitability | 0.058 | 0.017 | 0.014 | 4.089 | 0.027 |
| Asset quality -> Profitability | 0.329 | 0.099 | 0.034 | 9.677 | 0.005 |
| Likuidity -> Profitability | 0.089 | 0.069 | 0.017 | 5.334 | 0.017 |
| Management -> Profitability | 0.105 | 0.080 | 0.041 | 2.558 | 0.062 |
Source: data processed 2020
The effect size (f2) value for the liquidity variable on profitability is 0.089, ranging from 0.15. This shows that the effect of liquidity on profitability is moderate. The effect size (f2) for the management variable on profitability is 0.105, ranging from 0.15 to the value. This shows that the effect of profitability on profitability is moderate in Table 8.
| Tabel 8 Value Of R Square |
|||||
| Original Sample (O) | Sample Mean (M) | Standard Deviation (STDEV) | T Statistic… | P Values | |
|---|---|---|---|---|---|
| Proitability | 0.403 | 0.531 | 0.114 | 3.547 | 0.036 |
Source: data processed 2020
Judging from the determination value for the influence of capital influence, earning asset quality, management aspects, efficiency, liquidity, cooperative identity, compliance with sharia principles on profitability, the value is 0.403. This shows that the profitability variable can be explained by capital, earning asset quality, management aspects, efficiency, liquidity, cooperative identity, 40.30 percent compliance with sharia principles while the remaining 59.70 percent is explained by other factors.
Conclusion
Based on the analysis and discussion, several conclusions can be drawn as follows, the variables that have a significant influence on the profitability of savings and loan cooperatives and Islamic financing are the variables of identity, asset quality, liquidity and management variables at a significance level of 5%. Meanwhile, other variables that have a significant effect on profitability at a significance level of 10% are capital, efficiency, sharia compliance.
The variables that have a positive influence on the profitability of savings and loan cooperatives and sharia financing are capital, sharia compliance, liquidity and management. While the variables of efficiency, identity and asset quality have a negative effect on the profitability of savings and loan cooperatives and Islamic financing.
The variables that are most dominant in influencing the profitability of savings and loan cooperatives and sharia financing are asset quality, then management and liquidity. So that this variable becomes an important variable that needs to be considered by savings and loan cooperatives and Islamic financing in increasing the value of its profitability.
References
- Afandi, P. (2014). Analisis Kinerja Keuangan untuk Mengukur Kesehatan Keuangan Koperasi KSU BMT Arafah Kecamatan Bancak Kabupaten Semarang. Among Makarti, 7(1).
- An-Nabhani, T. (1996). Membangun Sistem Ekonomi Alternatif Perspektif Islam. Surabaya: Risalah Gusti.
- Bastian, A.J. (2006). Learning to predict the future: the cerebellum adapts feedforward movement control. Current Opinion in Neurobiology, 16(6), 645-649.
- Chiao, Y.C., & Yang, K.P. (2011). Internationalization, intangible assets and Taiwanese SMEs performance: Evidence of an Asian newly-industrialized economy. African Journal of Business Management, 5(3), 641-655.
- Chin, W.W. (1995). Partial least squares is to LISREL as principal components analysis is to common factor analysis. Technology Studies, 2(2), 315-319.
- Fahmi, I. (2012). Pengantar Manajemen Keuangan, Teori dan Soal Jawab. Bandung: Alfabeta.
- Field, J. (2000). Lifelong learning and the new educational order. London: Trentham Books, Ltd.
- Gasbarro, D., Sadguna, I.G.M., & Zumwalt, J.K. (2002). The changing relationship between CAMEL ratings and bank soundness during the Indonesian banking crisis. Review of Quantitative Finance and Accounting, 19(3), 247-260.
- Hair, E., Halle, T., Terry-Humen, E., Lavelle, B., & Calkins, J. (2006). Children's school readiness in the ECLS-K: Predictions to academic, health, and social outcomes in first grade. Early Childhood Research Quarterly, 21(4), 431-454.
- Harto, P.P., Amaliah, U., & Mulyati, S. (2018). Penilaian Tingkat Kesehatan Koperasi Syariah Berdasarkan Peraturan Kementerian Koperasi Dan Ukm. Jurnal Ekonomi Dan Perbankan Syariah, 6(2), 5-26.
- Hasmayati, H. (2016). Analisis Penilaian Kesehatan Koperasi Jasa Keuangan Syariah Berbasis Masjid (Studi Kasus Koperasi Jasa Keuangan Syariahbaitul Mal Tamwil At-taqwa-masjid At-taqwa Kemanggisan Jakarta). Jurnal Riset Manajemen dan Bisnis (JRMB) Fakultas Ekonomi UNIAT, 1(2), 163-170.
- Hatmoko, J.U.D. (2000). Persepsi pimpinan bumn terhadap elijibilitas balanced scorecard sebagai sistem penilaian kinerja perusahaan. Doctoral dissertation, Universitas Diponegoro.
- Henseler, J., Ringle, C.M., & Sinkovics, R.R. (2009). The use of partial least squares path modeling in international marketing. In New challenges to international marketing. Emerald Group Publishing Limited.
- Huda, H.M. (2007). Penilaian Kesehatan Koperasi terhadap Beberapa Koperasi di Kawasan Prigi Kecamatan Watulimo Kabupaten Trenggalek Menggunakan Analisis Camel. Master thesis, Universitas Brawijaya Malang.
- IMF. (2000). International Monetary Fund Annual Report 2000: Making the Global Economy Work for All. IMF.
- Jensen, M.C., & Meckling, W.H. (1976). Theory of the firm: Managerial behavior, agency costs and ownership structure. Journal of Financial Economics, 3(4), 305-360.
- Kasmir. (2009). Analisis Laporan Keuangan. Rajawali Pers. Jakarta
- Nasarudin, I.Y. (2016). Analysis of Abdi Kerta Rahardja Union Health Assesment. Etikonomi, 15(2), 194865.
- Nofiyati. (2016). Pengaruh Likuiditas, Solvabilitas dan Efisiensi Terhadap Rentabilitas BMT BIF Cabang Bugisan Yogyakarta 2012-2015. Skripsi Uin Sunan Kalijaga. Available: https://digilib.uin-suka.ac.id/id/eprint/22446/1/12391040_BAB-I_IV-atau-V_DAFTAR-PUSTAKA.pdf
- Purniyanti, S. (2006). Analisis Tingkat Kesehatan Koperasi Unit Desa (Studi Kasus pada KUD di Kabupaten Semarang). Doctoral dissertation, Universitas Negeri Semarang.
- Roman, A., & ?argu, A.C. (2013). Analysing the financial soundness of the commercial banks in Romania: an approach based on the camels framework. Procedia Economics and Finance, 6, 703-712.
- Sadrah, E. (2004). BMT dan Bank Islam Instrumen Lembaga Keuangan. Bandung: Pustaka Bani Quraisy.
- Sadriatwati, S.E. (2020). The Financial Ratio Analysis as Performance Assessement of Koperasi Simpan Pinjam dan Pembiayaan Syariah (KSPPS) BMT Al Hikmah Ungaran. Admisi dan Bisnis, 21(1), 29-42.
- Schumacker, R.E., & Lomax, R.G. (1996). A guide to structural equations modeling. Hillsdale, NJ: Erl-baum.
- Simon, J. (2004). Bekerja di bank itu mudah. Jakarta: Gramedia Pustaka Utama.
- Sudarma, I.W., & Yasa, I.M. (2013). Faktor-Faktor Yang Mempengaruhi Tingkat Kesehatan Koperasi Simpan Pinjam Di Kabupaten Gianyar. E-Jurnal Ekonomi dan Bisnis Universitas Udayana, 2(5), 312-338.
- Taswan. (2005). Akuntansi Perbankan.Yogyakarta: UPP AMP YKPN
- Thorpe, K.E. (2004). The Medical Malpractice ‘Crisis’: Recent Trends And The Impact Of State Tort Reforms: Do recent events constitute a crisis or merely the workings of the insurance cycle?. Health Affairs, 23 (Suppl1), W4-20.
- Wanke, P., Azad, M.A.K., Barros, C.P., & Hassan, M.K. (2016). Predicting efficiency in Islamic banks: An integrated multicriteria decision making (MCDM) approach. Journal of International Financial Markets, Institutions and Money, 45, 126-141.
- Yusuf, B. (2016). Analisis tingkat kesehatan koperasi syariah. Esensi: Jurnal Bisnis dan Manajemen, 6(1), 101-112.