Research Article: 2022 Vol: 26 Issue: 2
Factors Affecting the Efficiency of Labor Reallocation in Vietnams Manufacturing Sector: Spatial Econometric Model Approach
Ha Quynh Hoa, National Economics University, Hanoi, Vietnam
Nguyen Viet Hung, National Economics University, Hanoi, Vietnam
Phung Mai Lan, Thuy Loi University, Hanoi, Vietnam
To Trung Thanh, National Economics University, Hanoi, Vietnam
Luu Thi Phuong, National Economics University, Hanoi, Vietnam
Truong Nhu Hieu, National Economics University, Hanoi, Vietnam
Citation Information: Hoa, H.Q., Hung, N.V., Lan, P.M., Thanh, T.T., Phuong, L.T., & Hieu, T.N. (2022). Factors affecting the efficiency of labor reallocation in vietnam’s manufacturing sector: spatial econometric model approach. Academy of Accounting and Financial Studies Journal, 26(2), 1-11.
Abstract
The study focuses on measuring the efficiency of labor reallocation in aggregate productivity growth by using dynamic decomposition and examining the factors affecting the efficiency of the labor reallocation in Vietnam's manufacturing. Using firm-level data in the manufacturing industry for the 2005-2019 period, the study reveals that most changes in aggregate labor productivity and aggregate TFP are due to a pure within-firm productivity. The labor reallocation contributes 46.2% to aggregate labor productivity and 2.7% to aggregate TFP. Based on the spatial econometric model approach, using province-level data, the paper evaluates direct and indirect effects of factors on efficiency of labor reallocation. The results indicate that the increase in the number of employees in high and medium-high-tech enterprises is creating a positive effect on labor reallocation efficiency while that of the medium and low-tech industry shows a negative effect. In the period of study, it is found that specialization did not improve the efficiency of labor reallocation, but diversification created a positive impact. Diversification improved the efficiency of the labor reallocation within the province and spread positive effects to the neighbor ones. FDI firms have created positive effects on the efficiency of the labor reallocation within the provinces, but not neighbor provinces.
Keywords
Labor Reallocation, Dynamic Decomposition of Aggregate Productivity, Vietnam's Manufacturing Sector, Efficiency of Labor Reallocation, Spatial Econometrics Model.
Introduction
The driving forces for productivity growth depend not only on the firm's technical progress but also the efficient use of inputs. The movement of labor and other resources from one sector to another can increase the overall productivity of the economy and per capita income. Thus, labor, capital and other intermediate inputs are continuously reallocated among firms and sectors (Kuznets, 1966; Chenery et al., 1986; Harberger, 1998; Hsieh & Klenow, 2009). The bankrupt enterprises, low-productivity firms, exiting from the market, releasing and reallocating its production resources to better-performing firms. A process of resource reallocation from less to more productive firms contributing to aggregate productivity growth (TFP) is creating jobs and increasing economic growth and economic welfare (Andrews & Cingano, 2014; Hassine, 2019; Foster et al., 2001 ; Restuccia & Rogerson, 2017). A key to a well-functioning market economy is often characterized by a continuous process of reallocating resources among firms (Andrews & Cingano, 2014).
In recent years, there has been studies on the effect of resource reallocation on productivity growth. Some papers study economy-wide misallocations of input factors or inter-sector reallocation and aggregate productivity (Dabla-Norris et al., 2015; Hsieh & Klenow, 2009; Haltiwanger et al., 2014). On the other hand, some papers choose to focus on the reallocation within sectors in which productivity growth in an industry was driven by the reallocation of labor through the entry and exit of firms (Brandt et al., 2012; Foster et al., 2001; Disney et al., 2003; Dias et al., 2014; Bartelsman et al., 2013; Minh et al., 2019).
This paper measures the efficiency of labor reallocation in aggregate productivity growth by using dynamic decomposition and examines the factors affecting the efficiency of the labor reallocation. The unbalanced panel data of 730,908 firms in the manufacturing sector of Vietnam in the period from 2005 to 2019 are extracted from the Annual Enterprise Survey data set of the General Statistics Office of Vietnam (GSO) from 2006 to 2020. Data is collected and aggregated annually by sector, province. At province-level, the data includes 945 observations of 63 provinces/cities in 15 years. The study measures the labor reallocation and assesses direct and indirect spillover effects of some important factors on the efficiency of the labor reallocation, such as the presence of FDI enterprises, the degree of manufacturing specialization and economic diversification of the province, average income per labor, capital per labor of enterprise, and size of labor in high-tech and low-tech industry groups. Clarifying factors that directly and indirectly affect the efficiency of the reallocation will help policymakers understand more about the operating mechanism of the economy which includes labor reallocation, then find out constraints of reallocation process to reform economic policies in order to make the process efficient and promote productivity growth.
The remainder of this paper is organized as follows: Section 2 mentions literature review. The research methodology is presented in Section 3. Section 4 describes data and discusses empirical estimation results. Section 5 gives the conclusions of the study.
Literature Review
Recent studies have shown different factors affecting productivity at the firm level. One of the most concerning issues is whether the firm productivity growth is based primarily on its productivity improvement or the reallocation of resources between firms and the process of entering into, exiting from the industry (Aw et al., 2001; Melitz, 2003; Loecker & Konings, 2006). Some studies suggested that the slow process of inputs reallocation and firm innovation plays an important role in explaining the slowdown growth of TFP (Hsieh & Klenow, 2009; Restuccia & Rogerson, 2013; Midrigan & Xu, 2014; Decker et al., 2017). Some studies found that higher contribution of reallocation to productivity growth results from government policy reforms (Collard & Loecker, 2015; Hassine, 2019).
Many studies, based on firm-level data, have revealed that the speed of inputs reallocation varies over time and across industries. Loecker & Konings (2006) have indicated that TFP growth in the Slovenian manufacturing industry is mainly due to increasing efficiency of existing firms and the replacement of state-owned enterprises with private firms in the industry. Meanwhile, using US steel industry data for the period from 1963 to 2002, Collard & Loecker (2015) shows that the replacement of old technology with new technology is the main driving force behind the reallocation of resources process and leading to outstanding productivity growth in not only the steel industry but also all other US industries. Reallocating labor from low-productivity sectors/enterprises to high-productivity ones can improve the economy's productivity. Baldwin & Gu (2006) showed that the process of reallocating resources in Canada made a remarkable increase in productivity growth, which accounted for 50% in manufacturing and approximately 100% in retail industries. However, insufficient reallocation processes can lead to low productivity growth of the industry/enterprise, and even afflict productivity growth (Decker et al., 2017).
The decomposition methodology of aggregate productivity growth was pioneered by Baily et al. (1992), hereafter BHC) and subsequently developed by important contributions of several scholars (Griliches & Regev, 1995; Foster et al., 2001; Olley & Pakes, 1996; Melitz & Polanec, 2015). The BHC decomposition of the aggregate productivity change is separated into three firm categories (survivors, entrants, and exiters). But this decomposition is very sensitive to the number of firms' entry and exit. At a given level of productivity, if number of entering firms is higher than exiting ones, the net entry effect (entry minus exit) could be negative even when entrants (firms entry) are more productive than exiters (firms exit), when the market share of entrants is very low and the market share of exiters is very high (Haltiwanger, 1997). Therefore, the BHC decomposition has a potential bias if entry/exit effects are overestimated. Griliches & Regev (1995)and Foster et al. (2001) proposed two decomposition methods to correct this bias. Griliches & Regev (1995), hereafter GR) decomposed the contribution of entry and exit firms by comparing the average productivity level of two years (the base year and last year) as the reference productivity level. Foster et al. (2001) ), hereafter FHK) decomposition uses the same approach as the BHC and GR decomposition but the main difference is that FHK method uses the aggregate productivity level in period t-1 instead of the time average productivity level as the reference productivity level.
The other method of decomposition, commonly used, is proposed by Olley & Pakes (1996), hereafter OP). The OP defined aggregate productivity as the average of the productivity levels and decomposed it into two terms: a moment of the firm productivity distribution (the unweighted productivity average), and a moment of the joint distribution with market shares (the covariance between productivity and market shares captures allocative efficiency). The OP decomposition does not allow us to distinguish between contributions of entering and exiting. Melitz & Polanec (2015) extended the OP decomposition to measure the contribution of surviving, entering and exiting firms to aggregate productivity growth of Slovenian manufacturing industries during the period of 1995-2000. This methodology is known as the “dynamic Olley and Pakes” method. Moreover, they showed that the other decompositions that break down aggregate productivity changes into similar components introduce some biases in the measurement of the contributions of entry and exit.
Through the literature review, it can be seen that most researchers have addressed the sources of productivity growth (including labor productivity and TFP) by static and dynamic decomposition methods. These researches have also considered factors affecting labor productivity and TFP. However, there is only a limited amount of research that evaluates the impact of factors affecting the efficiency of labor reallocation on the growth of labor productivity and TFP.
Methodology
Dynamic productivity decomposition method
Based on the decomposition method of Olley & Pakes (1996), Loecker & Konings (2006) and Collard & Loecker (2015), this study implements dynamic decomposition aggregate productivity growth between two points in a given time window t-1 and t (in which t is a one year window) in Vietnam’s manufacturing sector into the contribution from four components: improvement in incumbents’ productivity; reallocation of resources from less productive to more productive producers; entry of more productive firms; and exit of less productive firms. Specifically, dynamic productivity decomposition considers the origin of productivity changes according to three sets of firms: set of survivors (S) contains the firms of continuing operation during the periods from t-1 to t, set of entrants (E) contains entering firms at time t and set of exiters firms (X) contains exiting firms at time t-1. Aggregate productivity growth ΔΩt can be decomposed as follows:
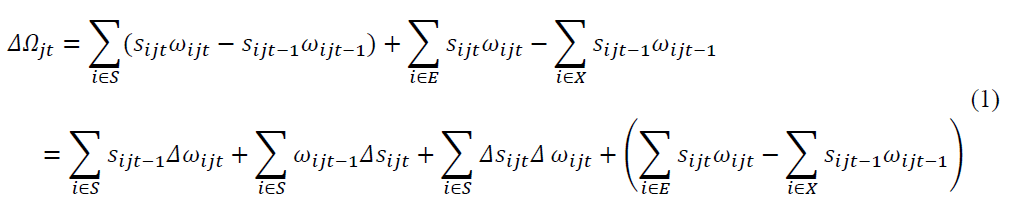
Where sijt is the number of labor employed by firm i over the total number of employees industry j in year t  is the productivity of the firm i of industry j in year t (represented by labor productivity or TFP); Ωjt is aggregate productivity of industry j at time t is measured as a weighted average of firm level productivity ωijt (Ωjt=∑sijt.ωijt). In this paper, TFP is estimated from the semi-parametric method of Levinsohn & Petrin (2003), and labor productivity (LP) is defined by the ratio of the value-added to the number of labor Sobrino (2003).
The first component of Equation (1):  is productivity change due to a pure within-firm productivity increase or firm improvement, under the constraints that no structural shifts have taken place and that each industry has maintained the share amount of shares in total employment as in the year t-1. The next two components
 are the productivity change due to reallocation, where
 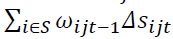 is the change due to change in labor share, reallocation, and
 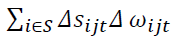 the covariance component or an interaction term, illustrating the change in labor share and productivity of industries. The sum of these two components will be used as a proxy for the contribution of labor reallocation to aggregate productivity (LabRe), reflecting the efficiency of the labor reallocation process. The fourth component
 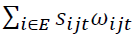 is the change in the productivity of the entrant and the last component
 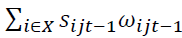 is the change in the productivity of the exiting firm. Thus,
 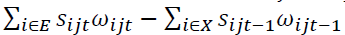 is a net entry component (net entry).
To evaluate the impact of factors on the efficiency of the labor reallocation process, the LabRe variable is calculated for each province annually with two sub-catalogs: LabRe_LP is the contribution of labor reallocation in aggregate labor productivity growth and LabRe_TFP is the contribution of labor reallocation in aggregate TFP growth.
Evaluate spatial spillover impacts of factors on the efficiency of labor reallocation.
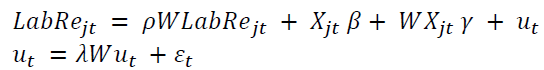
The study applies spatial regression models, which are Spatial Durbin model (SDM) (LeSage & Page, 2009; Gibbons & Overman, 2012) and Dynamic Spatial model (Elhorst, 2014). The specification of the general nesting spatial model as follows:
 (2)
(2)
Where: LabRejt denotes an N×1 column vector of the dependent variable, representing the contribution of labor reallocation efficiency to aggregate labor productivity growth (LabRe_LP) or aggregate total factor productivity TFP growth (LabRe_TFP) of province j at year t. Xj is the N×K matrix of explanatory variables representing spatially influencing factors. W represents the N×N spatial weight matrix, describing the spatial connectivity of each unit. WLabRejt represents the endogenous interaction effects of the dependent variable of each province through the spatial weight matrix. WXjt reflects the exogenous interaction effects of the independent variable Xjt of a province on LabRe in other provinces through the spatial weight matrix. ρ is the spatial autoregressive coefficient or spatial lag coefficient, reflecting the influence of global spillover effects. γ is a parameter of the variable X expressing the impact of spatial factors, measuring impact from neighbor provinces (local spillover effects). λ is the spatial autocorrelation coefficient, which measures the degree of correlation of the spatial residuals. εt is a vector of disturbance terms, and is assumed to be independently and identically distributed error terms with a mean of zero and variance σ2).
In Equation (2) if λ = 0 then a spatial Durbin model (SDM) is generated. If γ = 0 then a Spatial Autocorrelation model (SAC) is generated. If λ = 0 and γ = 0 then a spatial autoregressive model (SAR) is generated. The SDM determines both the influence of the exogenous variables generated within a province (direct impacts), and the influence of the exogenous variables of the neighbors on the endogenous variable of a given province (indirect impacts). The spatial estimates results show direct and indirect impacts as with the totals, known as the “circular feedback process” (Lesage and Pace, 2009; Elhorst, 2014; Leobardo et al., 2020).
To make the spatial model in Equation (2) to be dynamic, a time lag of the dependent variable is added. This will be a Dynamic Spatial Durbin model (Debarsy et al., 2011; Elhorst, 2014) as follows:
 (3)
(3)
Empirical Results and Discussions
Data and statistical description
The data used in the study are extracted from the Annual Enterprise Survey data of the General Statistics Office (GSO). After removing duplicate observations, observations with missing value, observations with zero and negative values of labor, total asset, fixed asset, revenue, gross output, materials, we obtain an unbalanced panel data set of 730,908 firms in the manufacturing sector in the period from 2005 to 2019. The raw individual-firm-level data is aggregated annually by sector and province. The province-level data includes 945 observations of 63 provinces/cities for 15 years.
Table 1 shows descriptive statistics of the variables in the sample. In the manufacturing industry, the size of workers in firms decreased gradually in the period 2005-2019, with the average of 94.48 employees per firm. In contrast, firms’ real capital gradually grew, by the average VND 48,631.44 million per firm. Labor productivity also increased considerably during the research period, reaching an average of VND 77,231 million per worker.
| Table 1 Descriptive Statistics | ||||||||
| Key Variables | Period 2005-2019 | 2005 2009 |
2010 2014 |
2015 2019 |
||||
| Mean | Std | Min | Max | |||||
| L | Labor employed (Labor/firm) |
94.48 | 607.034 | 1 | 85206 | 123.37 | 103.70 | 78.17 |
| K | Real capital (mil. VND/firm) |
48631.44 | 817862.6 | .0708366 | 2.72e+08 | 44402.04 | 44289.54 | 52663.4 |
| M | Intermediate input (mil. VND/firm) |
52788.93 | 1319620 | 8.36E-08 | 4.47e+08 | 45318.53 | 55599.82 | 53759.52 |
| REV | Revenue (mil. VND/firm) |
63931.86 | 1621621 | -897,287 | 5.00E+08 | 54501.56 | 65557.34 | 66285.62 |
| PRO | Profit (mil. VND/firm) |
3671.38 | 145471 | -1294191 | 4.73E+07 | 3351.18 | 3490.75 | 3889.71 |
| VA | Real Value-Added (mil. VND/firm) |
9515.02 | 202469.8 | 8.05e-08 | 7.93e+07 | 8339.23 | 8826.23 | 10331.73 |
| LP | Labor productivity (mil. VND/Labor/firm) |
77.21 | 1777.73 | 6.44e-08 | 1285080 | 56.22 | 74.66 | 97.81 |
| KL | Capital per labor (mil. VND/labor) |
822.52 | 9940.49 | 0.0019 | 4118827 | 457.21 | 533.89 | 1120.03 |
| LC | Average income (mil. VND/labor) |
39.36 | 186.45 | 0 | 108711.2 | 27.36 | 37.69 | 44.54 |
| IEa | Manufacturing specialization index | 1.65 | 0.890 | 0.3738 | 18.961 | 1.703 | 1.66 | 1.623 |
| IDEb | Economic Diversification Index | 0.0198 | 0.0474 | .0012 | 0.4096 | 0.04 | 0.02 | 0.01 |
| FS | The presence of FDI enterprises | 0.0002 | 0.0032 | 0.0000 | 0.765 | 0.00 | 0.00 | 0.00 |
| No of firms | 730,908 | 132,310 | 221,391 | 377,207 | ||||
The average Manufacturing Specialization Index (IE) is 1.65 indicating that some provinces of Vietnam have built up leading industry and created a comparative advantage. Some provinces with the highest degree of specialization are located in the Northwest, North Central and Mekong River Delta. Bac Can, Ha Giang, Quang Tri have high IE index in the wood processing industry. While high IE index is in the Bac Lieu’s food processing industry; Gia Lai’s food processing industry and wood products processing; Quang Binh’s non-metallic mineral products. These provinces have higher diversification index (IDE) than the average level of Vietnam (0.0195). The level of diversification in these provinces is lower than other provinces. Provinces with the highest degree of diversification are generally in the big cities/provinces, such as Hanoi, Ho Chi Minh, Dong Nai, Binh Duong, Hai Phong and Hai Duong. Provinces in the Northwest region and the Mekong Delta have the lowest degree of economic diversification.
Dynamic decomposition of aggregate productivity of the manufacturing sector
Table 2 summarizes the results of the dynamic decomposition of aggregate labor productivity and aggregate TFP for the period 2005-2019 by four components as shown in Equation (1). The results show that most of the changes in aggregate labor productivity and aggregate TFP are due to a pure within-firm productivity with its contribution being 148.1% and 134.5% respectively. This result is quite similar to the research of Loecker & Konings (2006). In the period from 2005 to 2019, the process of restructuring enterprises (job creation and job destruction) has had a significant effect on productivity growth of firms in the industry.
| Table 2 Dynamic Decomposition of Aggregate Productivity 2005-2019 | ||||
| Contribution ratio of each component (%) | ||||
| Firm Improvement | Reallocation | Covariance | Net Entry | |
| Labor Productivity (LP) | 148.1 | 46.2 | -130.8 | 36.6 |
| Aggregate TFP | 134.5 | 2.7 | -65.1 | 27.8 |
The reallocation component contributes 46.2% to aggregate labor productivity and 2.7% to aggregate TFP. It explains the reality in which the process of reallocating labor between firms gradually eliminates weak performing firms and expands market share of efficient ones. Reallocation process has resulted in a significant increase in output volume, not in aggregate TFP growth.
In Table 2, the covariance component’s value is negative, showing an inverse correlated relation between productivity change and number of firm’s employee change. In terms of labor size, firms with higher productivity growth are smaller. It is true for Vietnam's transitional economy, as is the case with Loecker & Konings (2006).
The net entry component explains 36.6% of the observed aggregate labor productivity and 27.8% of aggregate TFP growth. Government policies promoting market competition, removed barriers to entry and exit has been effective in Vietnam.
Estimate factors impact on the efficiency of the labor reallocation
In this section, the study used spatial econometric model to analyze the factors affecting the efficiency of labor allocation on productivity growth. The global Moran's I, LM-Error and LM-lag test are used in the diagnostic test of the spatial autocorrelation and spatial lag model. All these tests affirm the existence of globally spatial autocorrelation of the efficiency of labor allocation to productivity growth among 63 provinces of Vietnam. Based on the log-likelihood statistics, the Akaike Criterion (AIC) and the Bayesian Information Criterion (BIC), the SDM spatial model and the dynamic spatial model were selected to evaluate factors affecting the efficiency of labor reallocation to TFP growth (LabRe_TFP) and labor productivity growth (LabRe_ LP).
In the SDM LabRe_TFP model and in the LabRe_LP dynamic spatial model, the Hausman tests have 2(5)= 24.99 (P_value=0.0001) and 2(5)= 71.06 (P_value=0.000) respectively. This result is taken as an indication of fixed effects spatial panel data model. In addition, multicollinearity tests showed that the value of VIF is 4.0 (smaller than 10) with both SDM spatial model (LabRe_TFP) and dynamic spatial model (LabRe_LP). Both models do not face multicollinearity.
Table 3 provides the results of the SDM model with dependent variable LabRe_TFP and Dynamic Spatial Durbin model (DSDM) with dependent variable LabRe_LP. According to the estimated results in Table 3, the coefficients of spatial lag ρ which measure the impact of global spatial spillover on the efficiency of the labor reallocation. The spatial lag in both models are positive and statistically significant at 5% and 10%. This indicates that there is a significant spatial dependence between closely proximate province of the efficiency of the labor reallocation to aggregate labor productivity growth (LabRe_LP) and aggregate total factor productivity TFP growth such as a higher efficiency of the labor reallocation in province i will tend to push up the efficiency of the labor reallocation in province j.
| Table 3 The Impact of Factors on the Efficiency of the Labor Reallocation | ||||
| SDM model (LabRe_TFP) | Dynamic Spatial Durbin model (LabRe_LP) | |||
| Direct Effects (X) | Indirect Effects (W*X) | Direct Effects (X) | Indirect Effects (W*X) | |
| LabRe(-1) | 0.0093 (0.0136) |
|||
| lnKL | -0.000343** (0.00015) |
-0.00015 (0.00016) |
-0.00374** (0.00191) |
-0.00004 (0.0008) |
| lnLC | -0.0047 (0.00345) |
0.00441* (0.00262) |
-0.0270 (0.0190) |
0.0206* (0.1255) |
| IE | -0.0123* (0.00658) |
-0.0219 (0.0168) |
-0.0371 (0.0267) |
-0.164 (0.141) |
| IDE | -0.2013** (0.088) |
-0.318* (0.189) |
-2,497** (1.03) |
-3.452** (1,656) |
| FS | 1,066*** (0.296) |
-0.363** (0.189) |
2.130** (0.894) |
-0.592 (0.915) |
| Lhigh-tech a | 8.96e-07 (6.08e-07) |
1.72e-06* (1.00e-06) |
-1.39e-06 (4.17e-06) |
0.000016* (0.0007) |
| Lmedium-high-tech a | 2.91e-06 (3.56e-06) |
9.48e-06* (5.21e-06) |
0.0004** (2,00002) |
0.0000519 (0.0000701) |
| Lmedium-tech a | -2.29e-07 (2.78e-06) |
1.62e-06 (2.29e-06) |
-0.000013 (0.00001) |
-319e-06 (0.000036) |
| Llow-tech a | -2.65e-06*** (4.9e-07) |
-1.96e-06** (8.45e-07) |
-0.000016** (6.46e-06) |
-0.000013* (6.94e-06) |
| rho | 0.079** (0.0324) |
0.036* (0.013) |
||
| sigma2_e | 0.0588*** (0.025) |
2.171* (1,596) |
||
| Number of Obs. | 945 | 882 | ||
Standard errors are in parentheses; *** p<0.01, ** p<0.05, * p<0.1
Source: Estimation results from the SDM model and DSMD model
As shown in Table 3, the variable lnKL has a negative sign and is statistically significant while the variable W*lnKL is not statistically significant. This reflects the fact that the capital structure of manufacturing firms has not been used effectively, reducing the efficiency of the labor reallocation by a small magnitude. The level of capital per worker has not shown a spillover effect on the efficiency of labor reallocation in neighboring provinces in both models.
The variable lnLC has no statistical significance while the variable W*lnLC has a positive sign and is statistically significant in both models. This shows that per capita income hardly affects the efficiency of the labor reallocation process within provinces, but has a positive effect on the efficiency of the labor reallocation process with different sectors in neighboring provinces. This indicates that the firms’ salary policy in the manufacturing industry has not yet created a driving force to increase labor productivity. However, provinces with high average income per worker created a change in the labor structure not only within the province but also in neighboring ones. Thus, firms are forced to change the wage structure in order to get this benefit. They can attract more high-quality workers. This results in replacement of inefficient firms with more efficient ones, which pushes the productivity of firms and provinces.
The estimated coefficients of the IE variable (Specialization index) are negative and only have a statistically significant effect on efficiency of labor allocation to TFP growth within the province (LabRe_TFP), but no statistically significant effect on the neighbor provinces’ efficiency of labor allocation. Specialization may be an obstacle to the efficiency of the labor reallocation process in the manufacturing industry within the province and neighbors, and the creation of new jobs.
Especially in Vietnam, industries in high specialization provinces are mainly low-tech, such as food, wood processin. Their output values are not high and unsustainable. The number of high-productivity firms increases more slowly than the less productive ones, while the firm labor size tends to be smaller. Therefore, specialization of a province does not create a positive spillover to the efficiency of the labor reallocation of neighboring ones.
Degree of diversification variables IDE and W*IDE have negative and statistically significant coefficients. It shows that the higher degree of diversification (the smaller index of IDE, the higher degree of economic diversification), the higher effect of the labor reallocation in the aggregate productivity growth of the industry within provinces (the estimated coefficient in the SDM LabRe_TFP model is -0.2013; and the DSDM LabRe_LP is -2,497). The results also show that the impact of diversification on neighbor provinces is stronger than within the province (the estimated coefficient in the SDM LabRe_TFP model is -0.318 and the DSDM LabRe_LP is -3.452). The highest diversification degree firms are generally operated in big cities and provinces and focus on supply chain, through production to consumption process. This reduces operating costs, increases productivity and operational efficiency. Thus, the process of labor reallocation on this track will expand the quantity of high productivity firms, and reduce the number of less productive ones.
Table 3 shows that the presence of FDI enterprises has a positive impact on the efficiency of the labor reallocation within the province (estimated coefficients 1,066 and 2,130 respectively in the SDM model LabRe_TFP) and dynamic spatial model SDM LabRe_LP). However, the results do not show the spatial spillover effect of FDI on the efficiency of labor reallocation of neighboring provinces, and it even has a negative effect in the SDM model LabRe_TFP (-0.363 at 5% significance level). FDI enterprises, operated in the provinces or specially in the manufacturing industry, are not in the same production chain with domestic firms. Vietnamese enterprises also have few FDI enterprises customers. According to GSO, the goods that FDI enterprises bought are mainly from abroad (with nearly 60%), and only 15% supplied within the province and about 10% from neighboring provinces/cities. However, within the province, the presence of FDI enterprises has partly helped increase competitiveness in the market and forced domestic enterprises to change and actively improve technological innovation, organizational structure and improve management capacity. In addition, FDI enterprises also supply high quality input products to domestic firms. Thereby, domestic enterprises produce high quality products, increase production efficiency and technological capacity. Numbers of low-productivity enterprises will be less, and higher-productivity enterprises will be more.
Table 3 reflects that the increase in size of workers in low-tech industries (Llow-tech) is reducing efficiency of labor reallocation while the inverted result is seen in high- and medium-high-tech enterprises within the province and neighboring provinces. In fact, low-tech industries often employ large numbers of workers, generally reducing the efficiency of labor reallocation.
Conclusion
The study decomposed aggregate labor productivity and aggregate TFP to find out sources of productivity growth and evaluate the factors affecting the efficiency of labor reallocation by using spatial econometric models (SDM model and Dynamic Spatial Durbin model). Using firm-level data and province-level data of 63 provinces/cities in Vietnam's manufacturing sector for the period 2005-2019, results shows that: (1) firm improvement (a pure within-firm productivity) and labor reallocation are two components that play an important role in aggregate productivity growth, in which labor reallocation contributing 46.2% and 2.7% respectively to labor productivity growth and aggregate TFP changes; (2) labor income has positive effect on the efficiency of labor reallocation within the province and the neighbor provinces; (3) province diversification has created a positive impact, improved efficiency of labor redistribution within the province and spread positively to neighbor provinces; (4) the increase in labor size of medium and low-tech firms reduced efficiency of labor reallocation process, while the increase in the number of workers in high and medium-high-tech enterprises created a positive effect on the efficiency of the process; (5) the presence of FDI in industry of province/city has affected positively within the province without spatial spillover to neighbor ones.
Thus, in order to improve efficiency of labor reallocation, the government should promulgate policies and amend acts towards forming or developing province’s specialized production field. State government should develop and diversify the province's production activities to get a complete supply chain. Attracting FDI enterprises is also an effective policy that can improve the province's efficiency of labor reallocation. Some neighboring provinces with similar characteristics of economic and natural environment, should create economic zones, form interregional production networks.
Acknowledgement: This research is funded by National Economics University, Hanoi, Vietnam.
References
Baily, M. N., C. Hulten, D. Campbell, T. Bresnahan & R. E. Caves (1992). Productivity Dynamics in Manufacturing Plants. Brookings papers on economic activity. Microeconomics, 23(1992), 187–267.
Bartelsman, E., J. Haltiwanger & S. Scarpetta (2013). Cross-Country Differences in Productivity: The Role of Allocation and Selection. American Economic Review, 103(1), 305-34.
Chenery, H., S. Robinson & M. Syrquin (1986). Industrialization and Growth: A Comparative Study. Oxford University Press, Oxford.
Dabla-Norris, E., S. Guo, V. Haksar, M. Kim, K. Kalpana, K. Wiseman., & A. Zdzienicka (March 2015). The New Normal: A Sector-Level Perspective on Productivity Trends in Advanced Economies. IMF Discussion Note.
Disney, R., J. Haskel, & Y. Heden (2003). Restructuring and Productivity Growth in UK Manufacturing. The Economic Journal, 113(489), 666-694
Foster, L., J.C. Haltiwanger & C.J. Krizan (2001). Aggregate productivity growth: lessons from microeconomic evidence. In C.R. Hulten, E.R. Dean & M.J. Harper (Eds), New Developments in Productivity Analysis (pp. 303-372), University of Chicago Press, Chicago.
Haltiwanger, J. (1997). Measuring and Analyzing Aggregate Fluctuations: The Importance of Building from Microeconomic Evidence. Review, Issue May, 55–78.
Harberger, A.C. (1998). A vision of the growth process. The American Economic Review, 84(1), 1-32
Kuznets, S. S. (1966). Modern economic growth: Rate, structure, and spread. New Haven: Yale University Press
LeSage, J.P & R.K. Pace (2009). Introduction to Spatial Econometrics. A Series of Textbooks & Monographs, CRC Press.
Loecker, J.D. & J. Konings (2006). Job reallocation and productivity growth in a post-socialist economy: Evidence from Slovenian manufacturing. European Journal of Political Economy, 22(2), 388-408.
Melitz, M.J. & S. Polanec (2015). Dynamic Olley-Pakes productivity decomposition with entry and exit. Journal of Economics, 46(2), 362-375.
Olley, G.S. & A. Pakes (1996). The Dynamics of Productivity in the Telecommunications Equipment Industry. Econometrica, 64(6), 1263-129.
Sobrino, J. (2003). Competitividad de las ciudades en México. México: El Colegio de México.