Research Article: 2022 Vol: 26 Issue: 5
Factors Affecting the Growth of Micro and Small Scale Enterprises in Case of Kotebe Sub City
Neeraj Bali, Wollega University
Citation Information: Bali, N. (2022). Factors affecting the growth of micro and small scale enterprises in case of kotebe sub city. Academy of Accounting and Financial Studies Journal, 26(5), 1-19.
Abstract
The purpose of the Research was to asses factors affecting growth of micro and small scale enterprises in case of Kotebe sub city. This Research has employed explanatory research design in order to estimate annual MSEs employee growth by using explanatory variables such as access to work premise, access to finance, access to marketing & government support. It was designed to evaluate the extent of access to work premise, access to finance, access to marketing & government support prediction about annual MSEs employee growth. The five level Likert scale questionnaires were used as the main data gathering tool. In order to meet the objective, the researcher was used simple random sampling techniques and the data were collected from 298 participants. The collected data were analysed using mean, standard deviation; correlation and multiple linear regression analysis. The descriptive findings of access to work premise, access to finance, access to marketing & access to government support were under practice in the Research area. The correlation coefficient findings of access to work premise, access to finance, access to marketing & access to government support have strong and positive relation with annual MSEs employee growth. The R square findings of access to work premise, access to finance, access to marketing & access to government support, all together have strong & positive association; and impactful predicts annual MSEs employee growth and out of these explanatory variables, access to finance was find to be the leading predictor of annual MSEs employee growth. Therefore, it is beneficial, if the concerned government body & other stakeholder of micro and small scale enterprises of Kotebe sub city has more increase the number of micro finance institution that might lead to increase annual employee growth; have identify MSEs with the problem of work premise and give them adequate work premise that should meet their enterprise demand; and have also identify the problem of MSEs more likely requires immediate government support & provide them possible support, that might also lead to increase their annual employee growth.
Keywords
Finance, Growth, Marketing, Support, Work Premise & Mses.
List of Acronyms
AF : Access to Finance AGS : Access to Government support AM : Access to Marketing ANOVA : Analysis of Variance AWP : Access to work premise GE : Growth in Employees M : Mean SD : Standard Deviation SPSS : Statistical Package for Social Science VIF : Variance Inflation Factors
Introduction
Ethiopia is a country with a long, proud history, and which has remarkable and impressive institutions in many respects. In recent years, economic growth has increased significantly (Etzkowitz & Roest, 2008). However, after decades of both political and economic problems, Ethiopia is one of the poorest countries in the world, and an impetus to sustained and equitable income growth is needed. An analysis of the potential and problems inherent in its national innovation system could help identify outstanding issues and point to opportunities for growth-friendly reforms. An application of the triple helix concept can further contribute to essential understanding how the various key societal actors can be engaged so as to facilitate effective implementation of such reforms (Jasra et al., 2011).
MSE is one of the institutions given recognition as global issues for development & primarily considered as any country’s industry development plan. It serves as vehicles for employment opportunities at urban center and it strengthen the economic development. MSEs also serve as sources for sustainable job opportunities not only for developing countries like Ethiopia, but also for developed countries like USA (Kamunge et al., 2014). Thus, they should be given prior consideration as they are essential and serve for sustainable source of job opportunities to Ethiopiaa (Ababiya et al., 2015). Micro and small enterprises play a key role in stimulating other sectors of the economy such as trade, construction, services and agriculture as well as in reducing unemployment (Abay et al., 2014), as cited in (Payangan et al., 2016).
Statement of the Problem
In Africa, the Research on determinants of growth in youth owned MSEs in Kenya and he has used a descriptive survey research design with small sample size and his Research variable was technological, marketing and financial access, which is not logical to infer for other MSEs. Research on the determinants of growth of MSEs by Solomon and he has relied on only credit access, marketing facilities, policy and regulatory issues. Scholars (Mulugeta, 2010), suggest that MSEs are the essential area of government intervention to promote MSEs is a provision of financial support and designing a national micro credit and saving directive that primarily focuses on alleviating the financial constraint of MSEs operating in the country (Kebede & Simesh., 2015).
The Research on factors constraining the growth and survival of micro and small enterprises in Burayu, Ethiopia by (Abiyu, 2011) was mainly concentrated on the governmental support and analyzed by descriptive statistics only. This Research empirical investigation did not assess the possible factors that affect development of MSEs (Ciemleja & Lace, 2011). The Research by (Admasu, 2012) on factors affecting the performance of SMEs in case of textile and garment in Lideta sub-city and he has relied only on manufacturing sector without considering other MSEs sector. The Research on determinants of growth in youth owned Micro and Small Enterprises in Kenya by Mugambi and he has used a descriptive survey research design with small sample size, which is not logical to infer for other SMEs including this Research area. The survey by both (Muthini, 2015) on performance of Micro and Small Enterprises was pre-dominantly prevail in small towns, particularly for low-income, poor women without considering the counterpart (Kimuru, 2018). In Ethiopia, the Research on factors affecting the growth of MSEs in Shire Indasselassie by Haftom. His target respondent was only government official which administer MSEs without considering owner of MSEs in the Research area. The researcher was only employed financial resource, access to infrastructure and access to working premise to predict growth of MSEs and the finding of this Research was not generalized to Kotebe sub city MSEs. As per the researcher effort of reviewing available empirical facts on the subject matter, there is no evidence that prove the research have been conducted on the factors affecting growth of micro and small scale enterprises in case of Kotebe sub city. Therefore, all of the above methodological and empirical gaps have supported the importance of undertaking the Research, which entitled the factors affecting growth of micro and small scale enterprises in Kotebe sub city. In view of this, the researcher was motivated to examine the factors affecting growth of micro and small scale enterprises in case of Kotebe sub city (Zemenu & Mohammed, 2014).
Research Questions
Hence, the Research was sought to answer the following research questions:
1. To what extent do access to finance predicts annual employee growth in MSEs? 2. To what extent do government support predicts annual employee growth in MSEs? 3. To what extent do access to market predicts annual employee growth in MSEs? 4. To what extent do access to work premise predicts annual employee growth in MSEs?
Significance of The Research
The findings of this Research will help as additional information for addressing the constraints associated in the development of the MSE sector. There are very limited research output and literature regarding strategic orientation of MSEs particularly in Kotebe sub city. Therefore, academicians, consultants, and government agencies may use the Research to be obtained as a stepping- stone for further Research in the area at an advanced level. Both graduate and undergraduate students may find the Research relevant for their academic work. The findings will also be considered as an important addition to the existing knowledge and literature in this area for the public at large. Academicians for further Research in the area by providing a deeper understanding of the critical factors that affect the development of MSEs (Mwangi, 2011). Also, the local government may use the findings of this Research to overcome critical factors that affect the development of MSEs. So far, the findings of this Research will help the policy makers in consideration to areas where the strategies will be so as to encourage MSEs development. Finally, the Research will add literature in the development of MSEs in the Ethiopian context. This Research, therefore, attempts to address this knowledge gap by addressing the development of MSEs issues taking the case of Kotebe sub city into account. This may add to the body of knowledge related to growth of MSEs (Munyaka, 2010).
Scope of The Research
The population of the Research is limited to active micro and small enterprises registered under small scale enterprises level in Kotebe sub city. Geographically, this Research was delimited to Kotebe sub city MSEs Sectors. Conceptually, the Research was also focused on the factors affecting the growth of MSEs sectors in Kotebe sub city. This Research was also delimited to formally registered MSEs sectors such as manufacturing sector, construction sector, trade, services and urban agriculture. Specifically, the Research was covered the factors affecting MSEs (access to finance, government support, access to market & access to work premise) and growth in terms of annual employee growth in MSEs (Aremu & Adeyemi, 2011).
Conceptual Framework
Conceptual framework is used to make conceptual distinctions and organize ideas. In fact, it is defined as a way ideas are organized to achieve a research purpose. Based on the review of literature this Research is identified seven essential driving factors (Worku, 2008). These selected factors are the critical growth factors of individual MSEs. Factors affects growth of MSEs in Kotebe sub city depends on certain factors as set out into two categories as dependent and independent variables. Independent variables include: (finance, government support, marketing & work premise) and annual MSEs employee growth. The dependent variable is growth of MSEs in terms of employees (Gedam, 2010). The relationship of the variables is displayed in the Figure 1 below.

Figure 1: Conceptual Framework.
Research Design and Methodology
Research Design
The types of research design employed for this Research was explanatory research design. This research design is used to explain the cause effect relationship of annual MSEs employee growth and access to (finance, government support, marketing & work premise) in Kotebe sub city. This research design was used to investigate the cumulative effect of (finance, government support, marketing & work premise) on annual MSEs employee growth in Kotebe sub city (Bouazza et al., 2015; Endalkachew, 2016).
Target Population
The target population of the Research is 1911 employees in MSEs sector such as manufacturing, construction, trade, services and urban agriculture, as per the Kotebe sub city MSEs Office report of 2013 E.C Table 1.
| Table 1 Target Population Of The Research |
||
|---|---|---|
| MSEs sector | Total Employees of MSEs | |
| 1 | Manufacturing | 294 |
| 2 | Construction | 198 |
| 3 | Urban-Agriculture | 17 |
| 4 | Service | 928 |
| 5 | Trade | 474 |
| Total | 1911 | |
Source: Kotebe sub city MSEs Office report (2013E.C).
Sample Size Determination
The researcher was selected the samples from those sectors using cluster allocation. The total number of each MSEs sectors registered in Kotebe sub city office in 2013 E.C are 1911 (as per the report of Kotebe sub city MSEs office). The sample groups was limited by using Daniel’s formula, and then comparing the divisions in five sectors in Kotebe sub city before using stratified random sampling to collect the data. One of the sampling methods is simple random sampling which adopt in identifying respondents from each level to minimize bias (Dereje, 2016).
To determine an adequate sample size that estimate the population prevalence with a good precision Daniel, 1999 formula is used. Because, if this proportion is larger than 5%, (n/N >0.05), use the formula with finite population correction is recommended by (Naing et al., 2006)
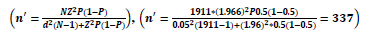
Where n'=Sample size N=population size Z=Z statistical for a level of confidence (95%) P=expected population (in proportion of one) (0.5) d=precision (in population of one) (5%)
Sampling Techniques
The Kotebe sub city MSEs was taken as they are; so as to reduce the population heterogeneity and to increase the efficiency of the estimates, stratified random sampling procedure by proportion allocation will be used (Netsaalem, 2011). The following table lists the sectors as strata with population size for each stratum. The researcher has calculated the below sample by taking the total number of target respondent from each MSEs sectors and also divide for each stratum (Tarfasa et al., 2016) Table 2.
| Table 2 Mses Sectors Involved In This Research |
|||
|---|---|---|---|
| MSEs sector | Total Employees of MSEs | Sample(n) | |
| 1 | Manufacturing | 294 | 337/1911*294=52 |
| 2 | Construction | 198 | 337/1911*198=35 |
| 3 | Urban-Agriculture | 17 | 337/1911*17=3 |
| 4 | Service | 928 | 337/1911*928=163 |
| 5 | Trade | 474 | 337/1911*474=84 |
| Total | 1911 | 337 | |
Data Source and Type
The primary data will be obtained from MSEs Sector owners using Likert scale questionnaire and also secondary data will be obtained from Kotebe sub city MSEs officer.
Method of Data Collections
Close-ended questions have the advantages of easy handling, simple to answer, and quick and relatively inexpensive to analyse (Gujarati, 2004). Hence, the researcher was employed five level Likert scale questionaries’ to obtain quantitative data from target respondents (MSEs owners), since it is easy to process it statistically (Okungu, 2012).
Method of Data Analysis
Under this, the collected data were coded, classified, transformed and tabulated and entered into SPSS version 25. Besides, regression model assumption test specifically Multicollinearity, normality, linearity and homoscedasticity of collected data using the SPSS version 25 so as to check the feasibility to use regression model for data analysis. Descriptive statistics like correlation, mean and standard deviation will be used to analyze the descriptive part. The multiple linear regression analysis was also used to predict the Kotebe sub city annual MSEs Employee growth (Abebe, 2011).
Model Specification
The multiple linear regression analysis was used to investigate the effect of independent variable on dependent variable. The dependent variable is annual MSEs employee growth and independent variable are access to work premise, access to finance, access to marketing & government support with regard to Kotebe sub city. Hence, the following multiple linear regression models was used (Saunders et al., 2009).

Where: Y is DV (Annual Employee Growth in MSEs) and the independent variables include the following:
1.β0 Is constant amount or intercept
2. β1 is coefficient of access to finance (X1)
3. β2 is coefficient of access to marketing (X2) and
4. β3 is coefficient of access to government support (X3)
5. β4 is coefficient of access to work premise (X4)
6. The e is the stochastic error of the Research
Where:
β0- is the intercept term- it gives the mean or average effect on X of all the variables excluded from the equation, although its mechanical interpretation is the average value of X when the stated independent variables are set equal to zero (Werotaw, 2010).
β1, β2, β3 and β4, refers to the coefficient of their respective independent variable which measures the change in the mean value of X, per unit change in their respective independent variables.
e=the stochastic error
Results, Discussions and Interpretations
This Article presents analysis, interpretation and findings of the Research. The data gathered through questionnaire was classified, tabulated and summarized using means and standard deviations distribution tables. The discussion begins with the demographic information followed by the descriptive analysis such as mean, standard deviation and correlation of Research variables. The data were collected from 298 employees and owner of different type of MSEs such as construction, manufacturing, service, trade and urban agriculture about factors affecting growth of micro and small enterprises in Kotebe sub city. The collected data were coded, entered in SPSS version 25 software and the result of the Research is presented, analyzed and interpreted. First, it was started with descriptive analysis of demographic characteristics of respondents, followed by factors affecting growth of micro and small enterprises in Kotebe sub city. The inferential statistics multiple linear Regression analysis were used to infer the Research findings (Birdthistle, 2007).
Background Characteristics of Respondents
The background characteristics of this Research were gender, educational qualification, duration of MSEs operation and the type of MSEs sector were described using Table 3, frequency and percentage as follows.
The above Table 3 presents the general characteristics of respondents. Accordingly, the result of the Research shows 187 (62.8%) of respondents were male, whereas 111 (37.2%) of them were female respondents. The educational qualification of the Research participants in the Table 3 above shows that 235 (78.9%) of respondents are less than or equal to diploma holder and 63 (21.1%) of respondents were bachelor degree holder in the Research area.
| Table 3 Demographic Variable Of The Research |
|||
|---|---|---|---|
| Variables | Category | Frequency | Percent |
| Gender | Female | 111 | 37.2 |
| Male | 187 | 62.8 | |
| Educational qualification | <= to diploma | 235 | 78.9 |
| BA/BSC holder | 63 | 21.1 | |
| MSEs Business Sector | Construction | 61 | 20.5 |
| Manufacturing | 28 | 9.4 | |
| Service | 103 | 34.6 | |
| Trade | 79 | 26.5 | |
| Urban agriculture | 27 | 9.1 | |
| How long has your enterprise been in operation | One to five years | 131 | 44.0 |
| Six to ten years | 113 | 37.9 | |
| above eleven years | 54 | 18.1 | |
Source: Survey Data of 2021
Table 4 above also illustrates the duration of MSEs operation & the type of MSEs’ Sector under studied. Out of 298 participants, 131 (44%) respondents said their MSEs have operate between one to five years, 113 (37.9%) respondents have said their MSEs have operate between six to ten years, 54 (18.1%) respondents have said their MSEs have operate above eleven years of operation history respectively. This shows that most of the Research MSEs have one to five years of duration operation. This indicates that most of the MSEs under Research were relevant operational experience to investigate the growth of micro and small enterprise in the Research area. In the same table above also, shows that the type of MSEs sector in which the sample respondents were serve. Majority of respondents 103 (34.6%) were in service industry followed by trade that accounts 79(26.5%), next the construction 61(20.5%) The rest 28(9.4%) and 27(9.1%) of respondents were manufacturing and urban agriculture respectively. Here the lion share of participants were under service industry which accounts 103 (34.6%).
| Table 4 Access To Finance |
|||
|---|---|---|---|
| No | Access to finance | Mean | SD |
| 1 | Our enterprise has easy access of MFI to get credit. | 2.26 | 1.28 |
| 2 | The loan processing procedures of available MFI requires less time. | 2.58 | 1.70 |
| 3 | The loan obtained from MFI is adequate & fulfill our enterprise demand. | 2.13 | 1.27 |
| 4 | The MFI have provided training for our enterprise on basic financial management skill. | 2.44 | 1.44 |
| 5 | The MFI have provided training for our enterprise on basic financial record keeping and reporting skill. | 2.46 | 1.48 |
Source: Survey Data of 2021
Descriptive Analysis of Research Variable
The Research participants’ level of agreement about MSEs access to (Finance, government support, marketing & work premise) and annual MSEs employee growth in Kotebe sub city were asked using five level Likert scale such as 1=strongly disagree, 2=Disagree, 3=Neutral, 4=Agree, and 5=strongly agree. The mean value of the response computed based on Likert scale indicated the average agreement of respondents. According to the measurement of midpoint (3) on the five-point Likert scale, mean score below midpoint (3) is disagree; mean score above midpoint (3) is agree and the mean score equal to midpoint (3) is neutral. The following Table 3 are presented with mean, standard deviation and correlation concerning MSEs access to (finance, government support, marketing & work premise) in Kotebe sub city (Abebe, 2014).
Access to Finance
The respondents were asked to rate MSEs access to finance practices in Kotebe sub city and the participant rating is ranging between 2.58 and 2.13, as presented in Table 4 above.
The participants’ were asked whether MSEs loan processing procedures from the available MFI requires less time and the result came to be (M=2.58 & SD=1.48). This showed that participants’ were disagreed about the raised questions. This means the loan processing procedures of MFI have required plenty of time for their enterprise. The participants were asked whether the MFI have provided training for their enterprise on basic financial record keeping and reporting skill and the result was (M=2.46& SD=1.48). The result showed that the MFI did not provide training for their enterprise on basic financial record keeping and reporting skill.
The participants were asked whether the MFI have provided training for their enterprise on basic financial management skill and the result was (M=2.44 & SD=1.44). The result showed that the MFI did not provide training for their enterprise on basic financial management skill. The participants were asked whether the MFI have provided training for their enterprise on basic financial management skill and the result was (M=2.44 & SD=1.44). The result showed that the MFI did not provide training for their enterprise on basic financial management skill.
The participants were asked whether their enterprises have easy access of MFI to get credit and the result was (M=2.26 & SD=1.28). The result showed that their enterprises did not easily access MFI to get credit. The participants were asked whether their enterprises have obtained loan from MFI is adequate & fulfill their enterprise demand and the result was (M=2.13 & SD=1.27). The result showed that their enterprises have easy access of MFI to get credit in the Research area.
Access to Marketing
In the Table 5: the Research mean value of MSEs’ access to marketing result were ranged from (M=2.82& SD=1.45) to (M=2.12 & SD=1.04). Depending on the five level Likert scale ways of reporting descriptive result with (mean & SD), the participants’ were asked whether their MSEs have legal enforcement contracts with their customers and the result came to be (M=2.82 & SD=1.45). This showed that their MSEs have no legal enforcement contracts with their customers in the Research area. The participants’ were asked whether their MSEs have smooth relationship with their existing customer and the result came to be (M=2.67 & SD=1.51). This illustrates that their MSEs have no smooth relationship with their existing customer in the Research area. The respondents were asked whether their MSEs have used relevant promotional tool to attract the potential users of their products and the mean score came to be (M=2.24& SD=1.29). This illustrates that the MSEs under Research have not used relevant promotional tool to attract their potential users of their products.
| Table 5 Access To Marketing |
|||
|---|---|---|---|
| No | Access to marketing | Mean | SD |
| 1 | Our enterprise have legal enforcement contracts with its customers. | 2.82 | 1.45 |
| 2 | Our enterprise have access to information about consumer demand of its products | 2.37 | 1.32 |
| 3 | Our enterprise have conducted marketing research to sale its existing product | 2.12 | 1.03 |
| 4 | Our enterprise have sold large amount of its existing product in the existing market | 2.16 | 1.08 |
| 5 | Our enterprise have smooth relationship with its existing customer | 2.67 | 1.51 |
| 6 | Our enterprise have used relevant promotional tool to attract potential users of its product | 2.24 | 1.29 |
| N=298 | |||
Source: Survey Data of 2021
The participants’ were asked whether their MSEs have access to information about consumer demand of their products and the result came to be (M=2.37 & SD=1.32). This showed that their MSEs have no access to information about their consumer demand of their products in the Research area. The participants’ were asked whether their MSEs have sold large amount of their existing product in the existing market and the mean score would be (M=2.16 & SD=1.08). This showed that their MSEs under Research did not sale large amount of their existing product in the existing market in the Research area. The participants’ were asked whether their MSEs have conducted marketing research for the purpose of selling their existing product and the mean score would be (M=2.12 & SD=1.04). This showed that the MSEs did not conduct marketing research for the purpose of selling in the existing product in the Research area.
Access to Government Support
The respondents were asked to rate MSEs access to government support practices in Kotebe sub city and the participant rating is ranging between 2.88 and 2.47, as presented in Table 6 above. The participants’ were asked whether their enterprise have got training on business management by government and the result came to be (M=2.88 & SD=1.48). This showed that participants’ were disagreed about the raised questions. This means their enterprise do not get training on business management by government.
| Table 6 Access To Government Support |
|||
|---|---|---|---|
| No | Access to government support | Mean | SD |
| 1 | Our enterprise have got training on business management by government. | 2.88 | 1.48 |
| 2 | Our enterprise have collaborative linkages with government projects. | 2.47 | 1.35 |
| 3 | Our enterprise have got land ownership & titling assistance from government. | 2.65 | 1.44 |
| 4 | Our enterprise have got required infra structure facility from government. | 2.71 | 1.49 |
| N=298 | |||
Source: Survey Data of 2021
The participants’ were asked whether their enterprise have got required infra-structure facility from government and the result came to be (M=2.71 & SD=1.49). This showed that participants’ were disagreed about the raised questions. This means their enterprise did not get the required infra structure facility from government. The participants’ were asked whether their enterprise have got land ownership & titling assistance from government and the result came to be (M=2.65 & SD=1.44). This means their enterprise did not get land ownership & titling assistance from government. The participants’ were asked whether their enterprise have collaborative linkages with government projects and the result came to be (M=2.65 & SD=1.44). This means their enterprise did not has collaborative linkages with government projects in the Research area.
Access to Work Premise
The respondents were asked to rate MSEs access to work premise practices in Kotebe sub city and the participant rating is ranging between 2.71 and 2.32, as presented in Table 7 above. The participants’ were asked whether their enterprise location is appropriate for needs of their enterprise and the result came to be (M=2.71 & SD=1.38). This means their enterprise location is not appropriate for their enterprise needs. The participants were asked whether their enterprise work premise is convenient to sale their good & service and the result came to be (M=2.45& SD=1.28). The result showed that the enterprise work premise is not convenient to sale their good & service. The participants were asked whether their enterprise work premise have met their current production demand and the result came to be (M=2.43 & SD=1.37). The result showed that their enterprise work premise did not meet their current production demand. The participants were asked whether their enterprise work premise have potential for future expansion and the result came to be (M=2.43 & SD=1.37). The result showed that their enterprise work premise do not have potential for the future expansion of MSEs business in the Research area.
| Table 7 Access To Work Premise |
|||
|---|---|---|---|
| No | Access to work premise | Mean | SD |
| 1 | Our enterprise location is appropriate for needs of our enterprise. | 2.71 | 1.38 |
| 2 | Our enterprise work premise have met our current production demand. | 2.43 | 1.37 |
| 3 | Our enterprise work premise is convenient to sale good & service. | 2.45 | 1.28 |
| 4 | Our enterprise work premise have potential for future expansion. | 2.32 | 1.37 |
| N=298 | |||
Source: Survey Data of 2021.
Comparison of Overall Research Variable Mean Ranks
As shown in Table 8 the overall mean score of the Research variables was ranging from 2.74 to 2.37. MSEs Access to work premise have the highest mean score 2.74; followed by MSEs Access to government support with mean score 2.68; MSEs Access to marketing was ranked third with a mean score of 2.39 and MSEs Access to finance was the last ranked with a mean score of 2.37. From this result, the whole variables (MSEs Access to work premise, MSEs Access to government support, MSEs Access to marketing and MSEs Access to finance) have the mean result greater than the average which indicate the under practices of those items in the Research area. However, when compared with others the value of MSEs Access to finance was the lower one. Therefore, MSEs Access to work premise, MSEs Access to government support, MSEs Access to marketing and MSEs Access to finance need the government and other stakeholder intervention to improve annual MSEs employee growth in Kotebe sub city.
| Table 8 Comparison Of Overall Research Variable Mean Ranks |
||||
|---|---|---|---|---|
| No | Overall Research variable mean result | Mean | Rank Mean | Std. Deviation |
| 1 | Access to finance | 2.37 | 4th | .68342 |
| 2 | Access to marketing | 2.39 | 3rd | .76518 |
| 3 | Access to government support | 2.68 | 2nd | .67518 |
| 4 | Access to work premise | 2.74 | 1st | .69518 |
Source: Survey Data of 2021.
Correlation Analysis
With an objective of measuring the strength of relationship between (access to work premise, access to finance, access to marketing & government support) and annual MSEs employee growth (Bereket, 2010). To achieve this purpose the researcher has used Pearson correlation coefficients output as you see in the Table 9 below.
| Table 9 Correlation Coefficients Result | ||||||
|---|---|---|---|---|---|---|
| N=298 | ||||||
| Research Variables | GE | AI | AF | AM | AGS | |
| Annual MSEs employee growth | Correlation | 1 | ||||
| Sig. | ||||||
| Access to work premise | Correlation | 0.639** | 1 | |||
| Sig. | 0.000 | |||||
| Access to finance | Correlation | 0.729** | 0.594** | 1 | ||
| Sig. | 0.000 | 0.000 | ||||
| Access to marketing | Correlation | 0.719** | 0.685** | 0.750** | 1 | |
| Sig. | 0.000 | 0.000 | 0.000 | |||
| Government support | Correlation | 0.638** | 0.518** | 0.679** | 0.622** | 1 |
| Sig. | 0.000 | 0.000 | 0.000 | 0.000 | ||
| **. Correlation is significant at the 0.01 level (2-tailed). | ||||||
Source: Survey Data of 2021
According to Karl (2012) Correlation Coefficients, the strength of relation between independent and dependent variable value of 0.8 to 1.0, 0.6 to 0.8, 0.4 to 0.6; and 0.2 to 0.4; and below 0.0 to 0.2 have very strong, strong, moderate, weak and very weak respectively. Depending on mentioned value of (Komppula, 2004). Correlation coefficients, the strength of relation between dependent and independent variables were interpreted for each of the variables under the Research (Lema, 2013).
As it can be seen from the Table 9, there is significant relation between the dependent variable and all independent variables under Research. Therefore, Access to finance has strong and positive relationship with MSEs annual employee growth accounting the first 72.9 %; followed by access to marketing has a strong and positive relationship with the MSEs annual employee growth that accounts the second 71.9%, access to work premise has a strong and positive relationship with the MSEs annual employee growth that accounts the third 63.9 % and access to government support has a strong and positive relationship with the MSEs annual employee growth takes the fourth rank 63.8% respectively (Karl, 2012).
Regression Model Assumption Test
The Variance Inflation Factor (VIF) values below 10 are acceptable and tolerance value should be higher than 0.1 (Gujarati, 2004). As it is observed from regression coefficients in the table 10 below; multicollinearity problem is not observed in this research result because the coefficients of tolerance is higher than 0.360 and variance inflation factors coefficients is also less than 10 (Table 10).
| Table 10 Collinearity Statistics |
|||
|---|---|---|---|
| Coefficients | |||
| Model | Collinearity Statistics | ||
| Tolerance | VIF | ||
| 1 | Access to finance | 0.510 | 1.960 |
| Access to marketing | 0.360 | 2.781 | |
| Access to work premise | 0.339 | 2.948 | |
| Access to government support | 0.504 | 1.984 | |
| a. Dependent Variable: annual MSEs employee growth | |||
Source: Survey Data of 2021.
In addition, the researcher has tested the normality of data and the data set is straight forward as observed in Figure 2. Hence, normality test assumption is met. From the visual examination of the linearity probability plot in Figure 3 indicate there was no violation of the linearity assumption, as it is observed from straight line the tendency of the points is straight line. As observed from scatter plot of the standardized residuals in Figure 4 there are no serious assumption violations. This implies that the normality, linearity, scatter plot, tolerance and variance inflation factors assumption test were definitely met. Hence, it is possible for the researcher to run the regression analysis (Drbie & Kassahun 2013).

Figure 2: Normality Of Data.

Figure 3: Linearity Of Regression Standardized Residual.

Figure 4:Scatterplot Of Regression Standardized Residual.
Multiple Linear Regression Analysis
According to Gujarati (2004), the multiple linear regression model is a powerful tool for summarizing the nature of relationship between variables and for making predictions of likely values of the dependent variable (Getahun, 2016). Hence, the Research variables such as access to work premise, access to finance, access to marketing & access to government support were employed to explain the degree of association among the work premise, access to finance, access to marketing & access to government support) at the same time so as to predict annual MSEs employee growth in this multiple linear regression model (Table 11).
| Table 11 Model Summary Result |
||||
|---|---|---|---|---|
| Model Summary | ||||
| Model | R | R Square | Adjusted R Square | Std. Error of the Estimate |
| 1 | 0.799a | 0.638 | 0.633 | 0.60955 |
| a. Predictors: (Constant), Government support, work premise, finance, marketing | ||||
Source: Survey Data of 2021.
The model summary Table 11 above shows the degree of association that the stated independent variables have with the dependent variable in the Research area. As such, it has been shown by R result of access to work premise, access to finance, access to marketing & access to government support all together have strong & positive association by 79.9% degrees. This shows that the better these variables are treated the more annual MSEs employee growth in the Research area. The R Square result indicates the strength of regression model interpretation as it is explained by 63.8% variation of annual MSEs employee growth in Kotebe sub city but the remaining 36.2% variation of annual MSEs employee growth in Kotebe sub city might be caused by other factors that are not included in this Research. On the other hand, the R square 0.638 result of the model has shown that all the explanatory variables (access to work premise, access to finance, access to marketing & access to government support) have impactful predicts annual MSEs employee growth in Kotebe sub city.
The Research have been tested by using multiple linear regression model as seen in table 4.10. It can be noticed from Table 12, the F statistics in the multiple linear regression model is 129.311 with probability (F=0.000) which indicates a good fitness of the predictability of the model used. This indicates that the model is highly significant at P<0.05 %, which means all the independent variables (access to work premise, access to finance, access to marketing & access to government support) are jointly significant in causing variation of annual MSEs employee growth in Kotebe sub city.
| Table 12 Anova Result |
||||||
|---|---|---|---|---|---|---|
| ANOVA | ||||||
| Model | Sum of Squares | df | Mean Square | F | Sig. | |
| 1 | Regression | 192.180 | 4 | 48.045 | 129.311 | .000b |
| Residual | 108.863 | 293 | .372 | |||
| Total | 301.043 | 297 | ||||
| a. Dependent Variable: annual MSEs employee growth | ||||||
| b. Predictors: (Constant), Government support, work premise, finance, marketing | ||||||
Source: Survey Data of 2021
As seen from Table 13, the independent variable under Research such as access to finance (t=5.367, p<0.05), access to work premise (t=4.043, p<0.01), access to marketing (t=3.959, p<0.05) and access to government support (t=3.498, p<0.05) have significant contribution for annual MSEs employee growth in Kotebe sub city.
| Table 13 Regression Coefficients Result |
||||||
|---|---|---|---|---|---|---|
| Coefficients | ||||||
| Model | Unstandardized Coefficients | Standardized Coefficients | t | Sig. | ||
| B | Std. Error | Beta | ||||
| 1 | (Constant) | .008 | .035 | .214 | .831 | |
| Work premise | .202 | .050 | .199 | 4.043 | .000 | |
| Finance | .316 | .059 | .314 | 5.367 | .000 | |
| Marketing | .240 | .061 | .239 | 3.959 | .000 | |
| Government support | .174 | .050 | .173 | 3.498 | .001 | |
| a. Dependent Variable: annual MSEs employee growth | ||||||
Source: Survey Data of 2021
To identify the individual contribution of explanatory variable, unstandardized coefficient Beta value of each independent variable under Research were analysed. Therefore, standardized coefficient Beta (β) of access to finance (0.316), access to marketing (0.240), access to work premise (0.202) and access to government support (0.174) respectively.
As a result, it can be said that access to finance was the determinant predictor of annual MSEs employee growth in Kotebe sub city. That means, a unit increase in MSEs access to finance will increase annual MSEs employee growth by 0.316; a unit increase in MSEs access to marketing will increase in annual MSEs employee growth by 0.240; a unit increase in MSEs access to work premise will increase in annual MSEs employee growth by 0.202 and a unit increase in MSEs access to government support will increase annual MSEs employee growth by 0.174 degree respectively in the Research area. From this one can conclude that the influence/contribution of access to government support for annual MSEs employee growth is low as compared to access to finance, access to marketing and access to work premise in Kotebe sub city. From the observe magnitude of weighted beta in the table 13, one can concluded that if all independent variables are ignored, the MSEs in Kotebe sub city itself have the value of 0.008 on its annual MSEs employee growth. As per the multiple linear regression model result, the best fit for the data have defined by the following equation:

Where; EG is Annual MSEs Employee Growth that used as dependent variable of the Research and the explanatory variables employed in this multiple linear regression model are, AF is Access to Finance, AM is Access to Marketing, AWP is Access to Work Premise and AGS is Access to Government Support are predictor of annual MSEs employee growth that have been represented in the multiple linear regression model of this Research.
This Article deals with the summary, conclusion and recommendations parts of the research. The first part of this Article presents the summary of the major findings. The second part of the Article is concerned with the conclusion drawn by the researcher and the third part is about the recommendations made by the researcher.
Summary
The objective of this Research was to assessment of factors affecting growth of micro and small scale enterprises. The data collected from the respondents using five level Likert scale questionnaire have been analyzed by SPSS version 25 using descriptive statistics such as frequency, percentage, mean, standard deviation, correlation and also inferential statistics namely multiple linear regression analysis. As per the analysis made, the following major findings of the Research have summarized as follows:
The background characteristics of respondents have been evaluated from the point of their gender, educational qualification, duration of MSEs operation and type of MSEs’ Sector. Hence, most of the Research participants were male and the educational level of most participants were less than or equal to diploma holder and the majority of the Research participant enterprise duration of operation were one to five years and the majority of the Research participant enterprise sector were service industry. The independent variables of this Research are (access to work premise, access to finance, access to marketing & access to government support) and they have used to predict annual MSEs employee growth in Kotebe sub city. The overall descriptive statistics report shows that there is under practices of MSEs access to work premise, MSEs access to finance, MSEs access to marketing & MSEs access to government support in Kotebe sub city.
The matrix correlation coefficients was generated along with its statistical significance achieved for 298 numbers of respondents by using Pearson correlation Product Moment to assess the strength of relation between the independent and dependent variables. According to the correlation coefficient result access to work premise, access to finance, access to marketing & access to government support have strong and positive relation with annual MSEs employee growth in Kotebe sub city.
The Research explanatory variables such as access to work premise, access to finance, access to marketing & access to government support in the multiple linear regression model of R result indicates that these explanatory variables all together have strong & positive association in the Research area. The R Square result indicates the strength of regression model interpretation as it is explained by 63.8% variation of annual MSEs employee growth but the remaining 36.2% variation of annual MSEs employee growth in Kotebe sub city might be caused by other factors that are not included in this Research.
The F statistics in the multiple linear regression is 129.311 with probability (F=0.000) which indicates a good fitness of the predictability of the model used in this Research. This indicates that the model is highly significant at P<0.05 and that all the independent variables are jointly significant in causing variation of annual MSEs employee growth in the Research area. According to the multiple linear regression coefficient result of access to work premise, access to finance, access to marketing & access to government support have significantly predicts annual MSEs employee growth. From these explanatory variables access to finance was find to be the major predictor of annual MSEs employee growth in the Research area.
Conclusion
The Research was conducted to assessment of factors affecting growth of micro and small scale enterprises in Kotebe sub city. In connection with each specific objective under Research, the researcher has made conclusions as follows.
The overall descriptive statistics report shows poor practices of MSEs access to work premise, MSEs access to finance, MSEs access to marketing & MSEs access to government support in Kotebe sub city. Particularly, the MFI in Kotebe sub city was not providing adequate loan that would fulfill their enterprise demand. The enterprise did not conduct marketing research to sale their existing product. The enterprise did not sale large amount of their existing product to sale in the existing market in the Research area.
The regression coefficient result of access to work premise, access to finance, access to marketing & access to government support were significantly predicts annual MSEs employee growth. From these access to finance was find to be the dominant predictor of annual MSEs employee growth. The correlation coefficient result of access to work premise, access to finance, access to marketing & access to government support have strong and positive relation with annual MSEs employee growth in the Research area.
Recommendations
1. It is beneficial, if the concerned government body & other stakeholder of micro and small scale enterprises of Kotebe sub city has more increase the number of micro finance institution that might lead to increase annual employee growth or advised to give attention for better implementation of financial factors such as developing of their working capital, and government should facilitate loan application procedures of banks and other lending institutions for traders’ profitability; followed by have identify MSEs with the problem of work premise and give them adequate work premise that should meet their enterprise demand; and have also identify the problem of MSEs more likely requires immediate government support & provide them possible support, that might also lead to increase their annual employee growth.
2. The concerned government body should increase the number of micro finance institution that primarily established for MSEs financial need and ought to provide adequate loan that meet their demand in the Research area. The owners of micro and small scale enterprises should conduct practical marketing research to sale their existing product in collaboration with other stakeholder in the Research
3. The potential researcher are recommended to conduct research on factors affecting MSEs growth in Kotebe sub city by taking each SMEs sector annual profit and their asset size as secondary data.
References
Ababiya, A., Geta, E., & Lemecha, Z. (2015). Performance of Micro and Small Enterprises and Its Determinants: The Case of Hadiya Zone, Ethiopia. Bulletin of Business and Economics (BBE), 4(4), 214-222.
Abay, H.H., Tessema, F.G., & Gebreegziabher, A.H. (2014). External factors affecting the growth of micro and small enterprises (MSEs) in Ethiopia: a case study in Shire Indasselassie Town, Tigray. European Journal of Business and Management, 6(34), 134-145.
Abebe, T. (2011). Analysis of the success factors of micro and small business enterprises in Addis Ababa. Addis Ababa: Addis Ababa University.
Abebe, Z. (2014). Factors Affecting Women Entrepreneurs in Addis Ababa (Doctoral dissertation, St. Mary's University).
Admasu, A. (2012). factors affecting the performance of MSEs in case of textile and garment in Lideta sub-city. Ethiopia: Addis Ababa University.
Aremu, M.A., & Adeyemi, S.L. (2011). Small and medium scale enterprises as a survival strategy for employment generation in Nigeria. Journal of Sustainable Development, 4(1), 200.
Indexed at, Google Scholar, Cross Ref
Bereket, T. (2010). The Role of Micro and Small Enterprises in Employment Creation and Income Generation: A Survey Study of Mekelle City, Tigray Region, Ethiopia (Doctoral dissertation, Mekelle University).
Birdthistle, N. (2007). An examination of tertiary level students and their intention to found an enterprise. Institute for Small Business and Entrepreneurship, 7-9.
Bouazza, A.B., Ardjouman, D., & Abada, O. (2015). Establishing the factors affecting the growth of small and medium-sized enterprises in Algeria. American International journal of Social Science, 4(2), 101-115.
Ciemleja, G., & Lace, N. (2011). The model of sustainable performance of small and medium-sized enterprise. Engineering Economics, 22(5), 501-509.
Indexed at, Google Scholar, Cross Ref
Dereje, M. (2016). Factors affecting performance of micro and small scale enterprises. Nekemete,Ethiopia: Wollega university,graduate study, college of business & economics,department of management.
Drbie, M., & Kassahun, T. (2013). Deterrents to the success of micro and small enterprises in Akaki-Kality Sub-City. Journal of Business and administrative Studies, 5(2), 1-33.
Indexed at, Google Scholar, Cross Ref
Endalkachew, D. (2016). Assessment on the determinant factors on the performance of micro and small enterprises: The case of Hossana town in Hadiya zone. Haramaya.
Etzkowitz, H., & Roest, M. (2008). Transforming University-Industry-Government Relations in Ethiopia. Malmö: IKED.
Gedam, M. (2010). The role of ACSI in addressing financial needs of women clients engaged in micro and small enterprises: the case of Bahr Dar branch. A Master’s thesis. Addis Ababa University, Addis Ababa Ethiopia.
Getahun, M. (2016). The challenge and prospects of small scale enterprise in Ethiopia: A survey of some selected small scale enterprise in Addis Ababa City. International Journal of Scientific and Research Publications, 6(5), 617-626.
Gujarati, D.N. (2004). Gujarati: Basic Econometrics, Fourth Edition. The McGraw−Hill Companies.
Gujarati. (2004). Basic Econometrics, Fourth Edition. The McGraw−Hill Companies.
Jasra, J., Hunjra, A.I., Rehman, A.U., Azam, R.I., & Khan, M.A. (2011). Determinants of business success of small and medium enterprises. International Journal of Business and Social Science, 2(20).
Kamunge, M.S., Njeru, A., & Tirimba, O.I. (2014). Factors affecting the performance of small and micro enterprises in Limuru Town Market of Kiambu County, Kenya. International journal of Scientific and Research Publications, 4(12), 1-20.
Karl, E.C. (2012). Principles of economics. Prentice Hall Boston Columbus Indianapolis New York San Francisco Upper Saddle River.
Kebede, M., & Simesh, G. (2015). The impact of environmental factors on the performance of micro & small-scale enterprises in East Gojjam Zone, Ethiopia. International Journal of Science and Research, 6(3), 1619-1629.
Kimuru, P.M. (2018). Determinants of growth in youth owned micro and small enterprises in Kenya (Doctoral dissertation, JKUAT-COHRED).
Komppula, R. (2004). Success factors in small and micro business: a study of three branches of industry in North Karelia.
Lema, J.P. (2013). Assessment of the Factors Affecting Perfomance Of Small And Medium Enterprises (SBEs). The Case of Kilimanjaro Region. Published MSc Dessertation, Mzumbe University, Tanzania.
Mulugeta, C.W. (2010). Factors affecting the performance of women entrepreneurs in micro and small enterprises. The Case of Dessie Town.
Munyaka, F.G. (2010). Factors affecting the performance of small and medium scale poultry farming enterprises in Karuri, Kenya (Doctoral dissertation).
Muthini, R. (2015). Factors influencing performance of micro, small and medium entreprises (msme) owned by women in Muthurwa market in Nairobi county, Kenya (Doctoral dissertation, University of University).
Mwangi, B.W. (2011). Accounting systems in small and micro enterprises in Kenya. Journal of Language, Technology & Entrepreneurship in Africa, 3(1), 78-98.
Indexed at, Google Scholar, Cross Ref
Naing, L., Winn, T.B.N.R., & Rusli, B.N. (2006). Practical issues in calculating the sample size for prevalence studies. Archives of orofacial Sciences, 1, 9-14.
Netsaalem, B. (2011). Factors Affecting The Performance Of Micro And Small Enterprises: The Case Of Harar, Ethiopia (Doctoral dissertation, Master’s thesis). Haramaya University. Ethiopia).
Okungu, K.O. (2012). Factors influencing performance of youth group micro and small enterprises in Kisumu West District, Kisumu County. Unpublished Master thesis). Kenyatta University.
Payangan, O.R., Taba, M.I., & Pabo, M.I. (2016). Factors Affecting the Business Performance of the Micro, Small and Medium Enterprises in Creative Economic Sector in Makassar, Indonesia.
Saunders, M., Lewis, P., & Thornhill, A. (2009). Research methods for business students. Pearson education.
Tarfasa, S., Ferede, T., Kebede, S., & Behailu, D. (2016). Determinants of growth of micro and small enterprises (MSEs): Empirical evidence from Ethiopia. Swiss Programme for Research on Global Issues for Development.
Werotaw, B. (2010). Entrepreneurship: an engine for sustainable growth, development, prosperity and good governance; genius training and consultancy service. Amen Business Group press, Addis Ababa, Ethiopia.
Worku, E.B. (2008). Efficiency and social capital in Micro, Small and Medium Enterprises: the case of Ethiopia (Doctoral dissertation, University of the Western Cape).
Zemenu, A., & Mohammed, M. (2014). Determinant of growth of micro and small enterprises in Ethiopia (a case of MSEs in Mekelle City, Tigray). International Journal of Advance Research in Computer Science and Management Studies, 2(6), 149-157.
Received: 03-May-2022, Manuscript No. AAFSJ-22-11891; Editor assigned: 04-May-2022, PreQC No. AAFSJ-22-11891(PQ); Reviewed: 11-May-2022, QC No. AAFSJ-22-11891; Revised: 15-Jun-2022, Manuscript No. AAFSJ-22-11891(R); Published: 22-Jun-2022