Research Article: 2019 Vol: 23 Issue: 3
Factor's Affecting The Public Hospital's Cost Management Accounting System
Ta Quang Binh, Thuongmai University
Vu Thi Thanh Thuy, FPT University
Abstract
This research aims to quantify the impact of factors on the use of cost management accounting systems in public hospitals that belong to the Ministry of Health in Hanoi. The study is conducted in 25 public hospitals in Hanoi, Vietnam. Quantitative analysis was performed based on a survey questionnaire distributed to 260 respondents. Primary data collected was analyzed and synthesized for the research. Researching on public hospitals for the period of 2015-2017 and the subjects were leaders, department managers of functional departments, accounting departments at public hospitals in Hanoi.
Keywords
Cost Management Accounting, Public Hospital, Impact Factors
Introduction
In recent years, along with the dynamic development of enterprises throughout the country, public hospitals which are public health care units - have also grown in size and quality. The whole country has 1,451 public hospitals, of which there are 39 central hospitals (directly under the Ministry of Health), 492 provincial hospitals, 645 district hospitals and 72 sector hospitals together with about 11,100 health center centers. In the private sector, the country has 219 private hospitals, 31,594 private clinics (Thach, 2018).
In this way, the financial autonomy mechanism has allowed public hospitals to take the initiative in using the state funding and the revenues left to perform the medical examination and treatment on the basis of cost savings, autonomy in the distribution of revenue differences to gradually improve facilities and staff life of the hospital.
In order to re-examine the factors affecting the cost management accounting system in public hospitals in Hanoi, the authors investigated the factors affecting 7 independent variables and 19 component variables.
Literature Reviews
Eldenburg and Kallapur (1997) in their research at hospitals of the State of Washington indicate that the cost accounting systems at these hospitals must comply with available regulations of the government, do not arbitrarily increase the cost of services of the patient. Jackson (2001), meanwhile, indicates that hospitals can adjust the cost system to be more suitable for the hospital's internal decisions. According to Hill (2000), the author on cost systems at hospital, indicates that it is possible to change with a more modern cost system - ABC's cost system, to increase revenue, competition and control the cost better, but only a few of hospitals change with this new cost system due to concern about the cost system according to the government.
Cardinels et al. (2004) researched the state of the cost management accounting system development in three stages as follows:
Stage 1: Hospitals only apply the cost system according to regulations of the State/government.
Stage 2: Hospitals apply the cost system according to regulations of the State/government but with improvements.
Stage 3: Hospitals apply the ABC method.
On the factors affecting the cost management accounting system application in the hospital, Krumwiede (1998) and Gupta & King (1997), shown that differences of direct and indirect costs are factors affecting the cost management accounting system application, The more different the more effective (Table 1). Estrin et al. (1994), the importance of cost is a factor affecting the cost management accounting system application. Cooper (1988) researched the state of the information technology system, the details built and integrated in the system are the factors affecting the cost management accounting system application. Complexity in the hospital was also reported by Udpa (1996); Lowson (2003) in their research. Shields (1995) researched the support of the hospital toward the use of cost management accounting systems, in which strong support from doctors is an important factor for increasing the cost management accounting system in the hospital. On the factor of the satisfaction of the government's regulated cost system, according to Innes & Mitchell (1995), has the opposite effect to the change of the cost system. Jackson (2001) argued that the level of the cost management accounting system use in accordance with government regulations is guaranteed to provide information for decision making. However, if usefulness of decisions are made by a number, the hospitals should review. According to Cardinels et al. (2004), the group of factors affecting the development of cost management accounting systems include: Cost variation, importance of cost, system state , the perceived complexity, the satisfaction of the legal system, the use of the legal system, organizational support.
| Table 1 A Summary of the Factors Affecting the Cost Management Accounting System Application From Previous Researches | ||||
| STT | Researched variable | Tendency of effect | Author/year of research | Expected results of the author |
| 11 | An increase of the treatment cost for patients | (+) | Krumwiede (1998); Gupta, King (1997); Cardinels et al. (2004) | (+) |
| 22 | The importance of cost information in the hospital | (+) | Estrin et al. (1994); Cardinels et al. (2004) | (+) |
| 3 | The complexity of the cost system in the hospital | (+) | Cooper R (1988); Cardinels et al. (2004) | (+) |
| 44 | Complexity in the hospital | (+) | S.Udpa (1996); Lowson (2003); Cardinels et al. (2004) | (+) |
| 55 | The support of the hospital | (+) | Shields (1995); Cardinels et al. (2004) | (+) |
| 66 | Satisfaction of the cost system as prescribed by the State | (-) | Innes and Mitchell (1995); Cardinels et al. (2004) | (-) |
| 77 | The level of use of the cost system in accordance with the regulations of the State | (-) | Jackson (2001); Cardinels et al. (2004) | (-) |
The research of Cardinels et al. (2003) is more comprehensive and is an important basis for identifying the factors affecting the cost management accounting system application. In their study, author group of Cardinels et al. (2003) used the Logistic regression model to analyze the factors affecting the cost management accounting system application in the hospital.
As research is carried out under different spatial and temporal conditions, the factors and effect tendencies of the factors may be also different. We use the Logistic regression model to research the factors affecting the cost management accounting system application in the hospitals.
Reseach Method
Quantitative research methods are used research the factors affecting the cost management accounting in public hospitals of the Ministry of Health in Hanoi.
Currently, the total number of public hospitals in the area of Hanoi is 25 hospitals. In which, the general hospital has 4 hospitals; 21 specialized hospitals. The number of leaders in charge of management, functional departments, the number of staff implementing directly accounting work of 25 public hospitals in the area of Hanoi is 739 people. In which, the number of leaders, managers of functional departments is 284 people, and the number of staff implementing accounting work is 455 people. Therefore, the number of forms surveyed for this research is determined by the author according to the Yamane formula (1967):
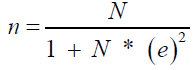 (1)
(1)
n: Number of forms are selected
N: Number of accountants, vice-heads of functional departments/ divisions
e2: Error 5%
N: The number of leaders in charge of management, functional departments, the number of staff implementing directly accounting work.
According to this formula, number of minimum forms identified in this research would be:
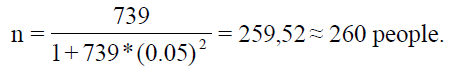
So, number of minimum forms identified in this research is 260 people.
The quantitative interview form is selected by the method of forms allocation.
Data Processing and Analyzing Method
The collected information will be checked to detect errors in the recording process, add missing information before being synthesized and analyzed. The author uses SPSS 22 software to process, synthesize and analyze data for research.
Assess the Reliability of the Scale
The authors use the Cronbach’s alpha coefficient to evaluate the reliability of scales built from qualitative research. Nunnally & Bernstein (1994) suggest that a scale with a Cronbach’s Alpha coefficient of nearly 1 is a good scale, and 0.7 to 0.8 is usable. Studies where the concept is new to respondents, the Cronbach’s alpha coefficient of 0.6 or higher is acceptable (Hair et al., 1998). On the other hand, Cronbach's Alpha coefficient measures the reliability of the whole scale, not for each observed variable (Tho, 2011), so it is necessary to check the correlation of each observed variable with the total variable through the total variable correlation (Correted item- Total Correlation). Observed variables are retained if Cronbach’s Alpha coefficients are correlated with Correted item (Total Correlation) greater than 0.3 (Nunnally and Bernstein, 1994).
Thus, according to this method, the Cronbach's alpha coefficient of the observation variable is satisfied with the given requirements. As a result, the scales of the observation variables are guaranteed to be reliable and retained in the survey form to carry out next analysis.
This study uses the extraction method of PCA (Principal Component Analysis), with the principle of relying on Eigenvalue to determine the number of factors (only those with Eigenvalue> 1 are retained) and Varimax factor rotation; at the same time, keeping only variables with loading factor greater than 0.5, variables with loading factor less than 0.5 or converging on many factors will be eliminated (Tho, 2011). However, in order to apply EFA, the variables must be correlated with each other and the KMO value (Kaiser-Meyer-Olkin) must be greater than 0.5 and less than 1 (Tho, 2011), so Bartlett testing is used to consider the correlation relationship between variables. The authors also used the coefficient of variance extracted to evaluate the degree of explanation of factors when implementing EFA. Accordingly, factor analysis is appropriate when observed variables explain more than 50% of the factors (Figure 1).

Figure 1 Research Model of the Factors Affecting the Cost Management Accounting System Application in public hospitals (Source: Self-Built Author)
To analyze the factors affecting the cost management accounting system application in public hospitals, the author uses the Logistic regression model.
From the research overview, determine the factors affecting the cost management accounting system application in public hospitals, the authors propose a research model as follows:
Explain The Research Model
Regression analysis, the author uses the Logistic regression model to analyze the factors affecting the cost management accounting system application in public hospitals, in which:
Y: Dependent variable is the state variable of using the cost management accounting system, measured by two factors, in which:
+0: The state of using the cost management accounting system in accordance with the regulations of the State and the Ministry of Health.
+1: The status of use of cost management accounting system in accordance with the regulations of the State and Ministry of Health with improvement
And 7 independent variables, specifically:
+X1: An increase of the treatment cost for patients, X1 is made up of two component variables:
1. Costs for patients in special care procedures (DRG's) are higher than for other procedures.
2. Indirect costs account for a large proportion of total costs.
+X2: The importance of cost information in the hospital, X2 is made up of two component variables:
1. Cost information is important to maintain the competition of the hospital.
2. Accurate cost data is important for hospitals
+X3: The complexity of the cost system in the hospital, X3 is made up of three component variables:
1. The cost system is linked to measures of accessing operation effect.
2. Many IT systems (electronic data warehouse and patient records rooms) are integrated in the hospital.
3. It is difficult to use the cost system to determine the standard cost for a patient.
+X4: Complexity in the hospital, X4 is made up of two component variables:
1. Hospital care procedures are complex.
2. For hospitals, it is difficult to allocate appropriate costs.
+X5: Support of hospitals, X5 is made up of four component variables:
1. The Board of Directors supports activities of cost allocations (management level).
2. The specialist department supports activities of uses of cost systems.
3. Doctors strongly support the use of cost systems.
4. Dean of nursing department supports cost control (nurse).
+X6: Satisfaction with the cost system as prescribed by the State, X6 is made up of three component variables:
1. It is satisfied with the cost calculation system in accordance with the State regulations.
2. The factors promote legal system, which helps to allocate logical costs.
3. Costs are calculated based on government regulations, which accurately reflects actual costs.
+X7: The level of use of the cost system as prescribed by the State, X7 is made up of three component variables:
1. The cost system as prescribed by the State is easy to use.
2. The cost system as prescribed by the State is not optimal but helps meet the needs of decision making.
3. The cost system as prescribed by the State is often used in the decision-making process.
+(+): Same direction effect
+(-): The opposite effect
On the above presented model theory basis and in the research of Cardinels et al. (2004) also attached the dependent variable Y with two values of 0 (Only one system used according to regulations, and 1 (with change, improvement, enhancement), author built the expected research equation:

In which:
+Y: There are 2 values of 0 (the hospital applies the cost system according to the regulations of the State) and 1 (the hospital applies the system according to the State’s regulations with improvement). X1, X2, X3, X4, X5, X6, X7 are mentioned above.
+ε: Random error
Based on the research’s overview, affected factors presented in Table 2 and the proposed research model of factors affecting the cost management accounting system application, The author shown the effect tendencies of variables in the model in the following hypotheses:
| Table 2 Synthesis of Author’s Expectations Hypothese on Variables in the Proposed Research Model | ||
| No. | Researched variable | Effect tendency of independent variables to dependent variable (Y) |
| 1 | X1 | (+) |
| 2 | X2 | (+) |
| 3 | X3 | (+) |
| 4 | X4 | (+) |
| 5 | X5 | (+) |
| 6 | X6 | (-) |
| 7 | X7 | (-) |
Source: Self-built author
Specifically, the hypothese are presented by the author as below:
Hypothesis H1: The increase in patient treatment costs has same direction relation with the use of cost management accounting systems in hospitals.
Hypothesis H2: The importance of hospital cost information has same direction relation with the use of cost management accounting systems in hospitals.
Hypothesis H3: The complexity of the hospital cost system hass same direction relation with the use of cost management accounting systems in hospitals.
Hypothesis H4: The level of complexity in the hospital has same direction relation with the use of cost management accounting systems in hospitals.
Hypothesis H5: Hospital support has same direction relation with the use of cost management accounting systems in hospitals.
Hypothesis H6: Satisfaction with the state's cost system has opposite direction relation with the use of costaccounting accounting systems in hospitals.
Hypothesis H7: The level of use of the cost system in accordance with the regulations of the State has opposite direction relation with the use of cost management accounting system in hospitals.
To test the hypotheses given by the author, the author uses the correlation coefficient (r). The correlation coefficient reflects the strength of the relationship between the two variables. The correlation coefficient always accepts values in the range (-1; 1). Positive correlation coefficient, which reflects that the two variables are related in the same direction. The negative correlation coefficient reflects that two variables that are inversely related.
According to the article of Hoang Trong and Chu Nguyen Mong Ngoc (2008), the logistic multivariate regression model is statistically significant when the model has the appropriate, accurate and meaning regression coefficients in the model. Correlation in the Logistic multivariate regression model is shown by -2LL (-2 log likelihood). The smaller the -2LL, the better the appropriateness. The smallest value of -2LL is 0 (means there are no error), then the model has perfect appropriateness. The accuracy of the model is reflected through the correct predictive rate of the whole model. The model is highly accurate when the predictive rate of the whole model is high. Use the Wald test (regression hypothesis test with difference of 0) to test the statistical significance of the regression coefficients in the model.
The conclusions of the tests are used with alpha significance of 5%.
Results
Assess the Reliability of the Scale
In order to measure the factors that influence the use of the cost management accounting system in the hospital, the author uses seven factors with 19 component variables. These factors before being used for analysis will be assessed using the Cronbach's alpha coefficient to measure reliability. Accordingly, factors are considered to be reliable when the Cronbach's alpha coefficient is large or equal to 0.6 and the correlation coefficient of each component variable is greater than or equal to 0.3.
+Factor 1: X1-An increase in the cost of treating patients
This element is made up of two component variables. The analysis shows that Cronbach's alpha of factor X1 is 0.620; The correlation coefficient of each component variable with this factor is more than 0.3. Thus, these component variables are statistically significant.
Factor 2: X2-The importance of cost information in the hospital
This element is made up of two component variables. The analysis results show that Cronbach's alpha of factor X2 is 0.821; The correlation coefficient of each component variable with this factor is more than 0.3. Thus, having this variable is statistically significant.
Factor 3: X3-The complexity of the cost system in the hospital
This element is made up of 3 component variables. The analysis shows that Cronbach's alpha of factor X3 is 0.769; The correlation coefficient of each component variable with this factor is more than 0.3. Thus, having this variable is statistically significant.
Factor 4: X4-The complexity of the hospital
This element is made up of two component variables. The analysis shows that Cronbach's alpha of factor X4 is 857; The correlation coefficient of each component variable with this factor is more than 0.3. Thus, having this variable is statistically significant.
Factor 5: X5-The support of the hospital
This element is made up of four component variables. The analysis shows that Cronbach's alpha of factor X5 is 0.878; The correlation coefficient of each component variable with this factor is more than 0.3. Thus, having this variable is statistically significant.
Factor 6: X6-satisfaction of the cost system as prescribed by the state
This element is made up of 3 component variables. The analysis shows that Cronbach's alpha of factor X6 was 0.757; the correlation coefficient of each component variable with this factor is more than 0.3. Thus, having this variable is statistically significant.
This element is made up of 3 component variables. The analysis shows that Cronbach's alpha of factor X6 is 0.890; the correlation coefficient of each component variable with this factor is more than 0.3. Thus, these component variables are statistically significant.
Subsequently, the author uses the EFA factor analysis to test the fit between the theoretical model and the surveyed reality.
Based on the analysis results, the KMO coefficient is 0.691 and the significance level of the Bartett test is less than 0.05, showing that the factor analysis is fit and the component variables have linear relationship.
In EFA analysis, component variables are retained for factor analysis when factor loading is greater than or equal to 0.5. According to the analysis results, all component variables have a factor loading which is greater than 0.5. Therefore, these component variables are involved in the factor analysis.
The analysis results also show that the total variance extracted of the factors is 77.55. This reflects that the factor analysis is explained by 77.55% of the component variables.
Therefore, these factors are fit with the theoretical model presented by the author.
Under Hypotheses Testing
Pearson's R coefficient is used to test the hypotheses presented below:
Research hypotheses are accepted when the significance level of the correlation coefficient is less than or equal to 0.05.
Hypothesis H1: An increase in the cost of treating patients has positive relationship with the use of the cost management accounting system in hospitals.
According to the results, the correlation coefficient between Y1 and X1 is 0.401, which indicates that the two variables are marginally related, move in the same direction and the relation is statistically significant since the sign P=0.000 less than the standard error of 5%. Therefore, this hypothesis is accepted.
Hypothesis H2: The importance of hospital cost information is closely related to the use of cost management accounting systems in the hospital.
According to the results, the correlation coefficient between Y1 and X2 is 0.459, which indicates that the two variables are marginally related, move in the same direction and the relation is statistically significant since the sign P=0.000 less than the standard error of 5%. Therefore, this hypothesis is accepted.
Hypothesis H3: The complexity of the hospital cost system and the use of cost management accounting systems in the hospital move in the same direction.
According to the analysis results Table 3, the correlation coefficient between Y1 and X3 is 0.380, which indicates that the two variables are marginally related, move in the same direction and the relation is statistically significant since the sign P=0.000 less than the standard error of 5%. Therefore, the hypothesis is accepted Table 3.
| Table 3 Correlation Matrix | |||||||||
| Correlations | |||||||||
| Y1 The current use of cost management accounting system |
X1 | X2 | X3 | X4 | X5 | X6 | X7 | ||
| Y1 The current use of cost management accounting system | Pearson Correlation | 1 | 401** | 0.459** | 0.380** | 0.362** | 0.716** | -0.510** | -0.523** |
| Sig. (2-tailed) | 0.000 | 0.000 | 0.000 | 0.000 | 0.000 | 0.000 | 0.000 | ||
| N | 260 | 260 | 260 | 260 | 260 | 260 | 260 | 260 | |
| X1 | Pearson Correlation | 1 | 0.006 | 0.102 | 0.119 | -0.211** | 0.002 | -0.019 | |
| Sig. (2-tailed) | 0.925 | 0.101 | 0.055 | 0.001 | 0.976 | 0.765 | |||
| N | 260 | 260 | 260 | 260 | 260 | 260 | 260 | ||
| X2 | Pearson Correlation | 1 | 0.507** | 0.629** | 0.489** | -0.605** | -0.397** | ||
| Sig. (2-tailed) | 0.000 | 0.000 | 0.000 | 0.000 | 0.000 | ||||
| N | 260 | 260 | 260 | 260 | 260 | 260 | |||
| X3 | Pearson Correlation | 1 | 0.653** | 0.403** | -0.818** | -0.356** | |||
| Sig. (2-tailed) | 0.000 | 0.000 | 0.000 | 0.000 | |||||
| N | 260 | 260 | 260 | 260 | 260 | ||||
| X4 | Pearson Correlation | 1 | 0.304** | -0.512** | -0.336** | ||||
| Sig. (2-tailed) | 0.000 | 0.000 | 0.000 | ||||||
| N | 260 | 260 | 260 | 260 | |||||
| X5 | Pearson Correlation | 1 | -0.577** | -0.622** | |||||
| Sig. (2-tailed) | 0.000 | 0.000 | |||||||
| N | 260 | 260 | 260 | ||||||
| X6 | Pearson Correlation | 1 | 0.452** | ||||||
| Sig. (2-tailed) | 0.000 | ||||||||
| N | 260 | 260 | |||||||
| X7 | Pearson Correlation | 1 | |||||||
| Sig. (2-tailed) | |||||||||
| N | 260 | ||||||||
(Source: Survey Results)
Hypothesis H4: The level of complexity in the hospital and the use of cost management accounting systems in the hospital move in the same direction.
According to the analysis results, the correlation coefficient between Y1 and X4 is 0.362, which indicates that the two variables are marginally related, move in the same direction and the relation is statistically significant since the sign P=0.000 less than the standard error of 5%. Therefore, this hypothesis is accepted. Therefore, this hypothesis is accepted.
Hypothesis H5: The support of hospital and the use of cost management accounting systems in the hospital move in the same direction.
According to the analysis results, the correlation coefficient between Y1 and X5 is 0.716, which indicates that the two variables are marginally related, move in the same direction and the relation is statistically significant since the sign P=0.000 less than the standard error of 5%. Therefore, this hypothesis is accepted. Therefore, this hypothesis is accepted.
Hypothesis H6: Satisfaction with the cost system under State’s regulation and the use of the cost management accounting system in the hospital move in opposite directions.
According to the analysis results, the correlation coefficient between Y1 and X6 is -510, which indicates that the two variables are marginally related, move in the opposite direction and the relation is statistically significant since the sign P=0.000 less than the standard error of 5%. Therefore, this hypothesis is accepted.
Hypothesis H7: The level of use of the cost system under State's regulation and the use of the cost management accounting system in the hospital move in opposite directions.
According to the analysis results, the correlation coefficient between Y1 and X7 is - 0.523, which indicates that the two variables are marginally related, move in the opposite direction and the relation is statistically significant since the sign P=0.000 less than the standard error of 5%. Therefore, this hypothesis is accepted.
Stepwise conditional method was used to analyze the logistic regression model. Accordingly, five models were proposed to analyze the factors affecting the application of the cost management accounting system in public hospitals belonged to the Ministry of Health in Hanoi city. In this study, model 5 was the chosen model because of the lowest - 2 Log likelihood coefficient. Coefficient of -2 Log likelihood of this model is 90.665.
In model 5, the Y1 variable is influenced by X1, X4, X5, X6 and X7 variable. The correct prediction rate for this model is 92.7%. The results of the test on general fit of the model and the significance level of the Wald test for regression coefficients in the model are less than 0.05, which indicates that the model is statistically significant Table 4.
| Table 4 Regression Model Analyzes the Factors Affecting the Cost Management Accounting System in Public Hospitals Belonged to the Ministry of Health in Hanoi City | ||||||
| B | S.E. | Wald | df | Sig. | ||
| Step 5e | X1 | 7.886 | 1.868 | 17.814 | 1 | 0.000 |
| X4 | 1.829 | 0.684 | 7.145 | 1 | 0.008 | |
| X5 | 2.581 | 0.838 | 9.488 | 1 | 0.002 | |
| X6 | -3.099 | 1.097 | 7.976 | 1 | 0.005 | |
| X7 | -3.005 | 0.892 | 11.341 | 1 | 0.001 | |
| Constant | 36.577 | 9.849 | 13.792 | 1 | 0.000 | |
(Source: Survey Results)
This model is as follows:

According to analysis results, X1 factor, the increase in treatment cost for patients, had the greatest impact because of the highest regression coefficient at 7,886 and the correlation coefficient of X1 at 0.401. In factor analysis, X1 is made up of two component variables:
• d1: Cost for patients in the special care process (DRG's) is higher than other processes.
• d2: Indirect cost accounts for a large proportion of total costs.
The most influential component variable of X1 is d2 because the regression coefficient is 0.623.
Thus, X1 is the greatest impact variable in the model, which tends to have the positive correlation: when the cost of treatment for patients increases, the ability to apply the cost management accounting system increases in accordance with the State's regulation (with higher improvement).
Conclusion
Nowadays, while financial autonomy and self-responsibility are applied to all hospitals,the public hospitals belonged the Ministry of Health (Vietnam) must make greater efforts to provide good service and cost-effective management. Therefore, the cost management accounting is a useful tool for hospital managers in order to make the right decisions.
The authors investigated the factors affecting the cost management accounting system in public hospitals belonged to the Ministry of Health in Hanoi city and found that and found that X1 factor, the increase in treatment cost for patients,had the greatest impact because of the highest regression coefficient at 7,886 and the correlation at 0,401. These results will be further investigated in the near future.
References
- Atkinson, A.A., Banker, R.D., Kaplan, R.S., & Young, S.M. (2001). Management Accounting (Thirth Edition). Prentice Hall International.
- Basu, D., Croce, D., Porazzi, E., Restelli, U., & Naidoo, S. (2010). Introduction of Concept of Cost Centre Management in a Public Hospital in South Africa. Journal Health Care Finance, 36(3), 88-92.
- Cooper, R. (1988).The rise of Activity-based costing part two: When do I need an activity-based costing system?Journal of Cost Management, 41-48
- Northcott, D., & Llewellyn, S. (2005). The balancing act in hospital performance measurement: A comparison of UK and New Zealand approaches. Research executive summaries series, 5(2), 1-9.
- Young, D. (2013). Management Accounting in Health Care Organizations. Jossey-Bass A Wiley Brand.
- Cardinels, E., Roodhooft, F., & Herck, G.V. (2004). Drivers of cost system development in hospitals: results of a survey. Health Policy, 69(2), 239-52.
- Estrin, T., Kantor , J., & Albers, D. (1994). Is ABC suitable for your company? Management Accouting, 40-45.
- Garison, R.H., Norreen, E.W., & Brewer, P.C. (2008). Managerial Accouting. MC GrawHill.
- Hoang Trong và Chu Nguyen Mong Ngoc (2008), Research Data Analysis with SPSS (episodes 1), Hong Duc Publishing House
- Trong, H., & Ngoc, C.N.M. (2008). Research Data Analysis with SPSS (Episodes 1). Hong Duc Publishing House.
- Innes, J., & Mitchell, F. (1995). A survey of activity-based costing in the U.K.’s largest companies. Management Accouting Research,6(2), 137-153.
- Sutherland, J. (2011). Hospital Payment Mechanisms: Options for Canada. Retrieved from http://healthcarefunding2.sites.olt.ubc.ca/files/2011/12/Mar11-Hospital-Payment-Mechanisms.pdf
- Krumwiede, K.R. (1998). The implementation steps of activity-based costing and the impact of contextual and organizational factors. Journal of Management Accounting Research, 10, 239-277.
- Eldenburg , L., & Kallapur , S. (1997). Changes in hospital service mix and cost allocations in response to changes in Medicare reimbursement schemes.Journal of Accounting and Economics, 23(1),31-51.
- Thach, L. (2018). Ministry of Health conducts hospital division.Retrieved fromlink: https://vtv.vn/suc-khoe/bo-y-te-tien-hanh-phan-tuyen-benh-vien-20180408011204322.htm
- Smet, M. (2002). Cost characteristics of hospitals.Social Science & Medicine, 55(6), 895-906.
- Kludacz, M. (2013). Cost accounting as a base of valuation of medical services in European hospitals. Conference: Proceedings in Conference of Informatics and Management Sciences.
- Younis, M.Z., Jaber, S., Mawson, A.R., & Hartmann, M. (2013).Estimating the unit costs of public hospitals and primary healthcare centers. Intternational Journal of Health Plann Manage, 28(4), 320-32.
- Gupta, M., & King, R. (1997). An experimental investigation of the effect of cost information and feedback on product cost decisions.Contemporary Accounting Research, 14(1), 99-127.
- Shields, M. (1995). An empirical analysis of firms’ implementation experiences with activity-based costing.Journal of Management Accounting Research.
- Tho, N.D. (2011). Methods of scientific research in business. Social Labor Publishing House.
- Hill, N.T. (2000).Adoption of costing systems by U.S. hospitals.Journal of Accounting and Public Policy, 19(1), 41-71
- Partners for Health Reformplus Project (2002). The Management Accounting System for Public Hospitals in Jordan,(Spreadsheet Version 1.2). PHRplus, Abt Associates Inc.
- Partners for Health Reformplus (2004). Management Accounting System for Hospital (MASH) Manual. Abt Associates Inc. Retrieved from https://www.hfgproject.org/management-accounting-systems-hospitals-mash-manual/
- Kaplan, R., & Atkinson, A.A. (2014). Advanced management Accounting (Third Edition).Pearson
- Lawson, R. (2003). Development of an HMO cost management system. Research in Healthcare Financial Management, 8(1), 31-41.
- Jackson, T. (2001).Using computerised patient-level costing data for setting DRG weights: The Victorian (Australia) cost weight studies. Health Policy, 56(2), 149-63.
- Udpa, S. (1996). Activity-based costing for hospital. Health Care Management Review, 21(3).
- Yamane, T. (1967). Statistics: An Introductory Analysis, (Second Edition). New York, NY: Harper and Row.