Research Article: 2022 Vol: 26 Issue: 5S
Factors Influencing the Selection of Methods and Determination of Transfer Pricing In Multinational Companies: A Case Study of Ghana
Mohammed Issah, University of Professional Studies
Samuel Antwi, University of Professional Studies
Zingteng Amatus, University of Professional Studies
Haruna Abdul-Razak Borawa, University of Professional Studies
Citation Information: Issah, M., Antwi, S., Amatus, Z., & Borawa, H.A.R. (2022). Factors influencing the selection of methods and determination of transfer pricing in multinational companies: a case study of ghana. Academy of Accounting and Financial Studies Journal, 26(S5), 1-15.
Abstract
Multinational corporations avoid international taxes through transfer pricing manipulation, thin capitalization, tax haven utilization, payment of intangibles, income shifting, and the financing structure of affiliate firms. Questionnaires and interviews were the main data collection instrument used to solicit information from 45 respondents comprising of 15 staff of the transfer pricing unit, 15 staff of the tax unit of tax multinationals and 15 multinationals. Descriptive statistics and logistic regression model were used to analyzed the responses. Hosmer's and Lees' Hawn Tests were adopted for the test and evaluation of the logistical regression model's fitness between several statistical methods (including pseudo R2, Deviance, Pearson fitness and information criteria). The study revealed that consideration should be given to the differences in income tax between countries, import and export duties, interest and participation of local partners, restriction on profit and repatriation of dividends, exchange rates risk, political risk for nationalization of foreign companies, and host relationship in the formulation and decision which transmission pricing policies and method to adopt.
Keywords
Transfer Pricing, Tax Avoidance, Multinational Enterprises, Logistic Regression.
Introduction
Emerging economies benefit from the flow of financial resources from developed countries (Tomedi & Schreiber, 2014). Due to the flexibility of transfer pricing and its role in avoiding taxes by redirecting public revenue to shareholders, globalization has driven the concept of nations and states (Sikka & Willmott, 2010). Globalization has come to wipe out the restrictions of the regional ward of organizations and has cleared a simpler method of setting up auxiliaries, associate joint endeavors, specific reason substances and trusts in purviews with good conditions to profit with low expense havens. Multinational corporations (MNCs) benefit from international trade in a variety of ways, according to (Chan et al., 2015). These benefits include trade expansion, job creation, technology transfer, and flow of international market information.
To maximize global profits and minimize global taxes, multinational corporations (MNCs) locate their affiliates in countries with very low or no tax rates. Multiple tax avoidance mechanisms have been employed by multinational corporations to maximize profits and minimize taxes globally, leading to revenue losses for both taxes have countries and developing countries attempting to operate as a low-tax haven. MNEs are hosted by several emerging economies, including Ghana, in the hopes that they will honor tax obligations and meet the expectations of all stakeholders. As a result of their size and complexity, a large number of MNEs influence and subsequently deprive many developing nations of tax revenues that could be used to advance their development agenda of accelerated and sustainable economic growth.
Multinational Enterprises conduct over 60% of global trade and business activities, with 70% of these transactions involving related parties (GRA 2013 TP Regimes; Osei, 2010). The majority of trade between developing countries and the international community is carried out by multinational enterprises and other businesses. Consequently, there is a risk of revenue losses due to the manipulation of transfer pricing (Osei, 2010; Amidu et al., 2019; Addo et al., 2017).
International tax avoidance practices are studied, and it is found that multinational corporations avoid international taxes through transfer pricing manipulation, thin capitalization, tax haven utilization, payment of intangibles, income shifting, and the financing structure of affiliate firms (Jacob, 1996; Taylor & Richardson, 2012; Henn, 2013; Brock & Pogge, 2014). Transfer pricing manipulation is a major method of tax avoidance used by these corporations, according to the majority of these studies (Gravelle, 2009; Pendse, 2012; Jansk, et al., 2013). Transfer pricing is manipulated when a company tries to purchase or sell a good or service to an affiliated entity at a lower or higher price because the two companies are located in different tax jurisdictions (Clausing, 2003; Dyreng & Lindsey, 2009; Slemrod & Wilson, 2009; Cristea & Nguyen, 2013; Brock & Pogge, 2014). As a result of the manipulation, multinational corporations have the opportunity to move their profits from countries where they were earned to countries with lower taxation rates. These transactions all result in income tax avoidance.
Multinational corporations lose far more money by abusing transfer pricing than they do by providing development aid to developing countries each year. Using transfer pricing, Osei, (2010) found that over $400 billion in the capital was transferred from developing countries to developed countries each year. Both developed and developing countries are adversely affected by price manipulation. There is a reduction in tax revenue for the government, resulting in a burden on the country from over-taxation of the population and government borrowings as a result. For more information, please see (Sikka & Willmott, 2010; Nakyea, 2012; & Addo et al., 2017). Multinational Enterprise (MNE) sophistication and size make it possible to manipulate a country's balance of payments and thereby threaten Ghana's economic independence. There is also a shift in international employment and production. Using transfer pricing, multinational enterprises (MNEs) can reduce their tax obligations by moving the capital to more advantageous locations. To minimize tax and maximize group profits, multinational enterprises (MNEs) establish subsidiaries and branches in low-tax jurisdictions where production is most profitable. This has an impact on how much investment a country receives from foreign investors (Sikka & Willmott, 2010; Nakyea, 2012, Amidu et al., 2019).
The mobilization of transfer pricing for tax avoidance, and sometimes evasion, is largely invisible to the public and is difficult and expensive for regulatory authorities to detect. There is indeed a complex game involving numerous actors’ corporations, accountants, lawyers, consultants, governments, tax authorities, multinational agencies (e.g. OECD), NGOs and so on\engaged in establishing and revising the rules of the game with regard to which method(s) of calculating prices is acceptable, and also developing and detecting ways of manipulating, escaping or subverting these rules and methods. As means of enhancing divisional, segmental, product and global profits, the unimpeded use of transfer pricing matters to stock markets as earnings, dividends, share prices and return on capital are all affected. It also matters to company executives because their financial rewards are frequently linked to corporate earnings. Transfer pricing practices matter to the state because they affect the taxes that it can levy upon corporate profits to finance public goods and thereby secure legitimacy.
There has been a dramatic increase in MNE complexity, as well as in the quest to maximize shareholder value while still meeting their tax obligations. As a result, Ghana and other developing nations can no longer ignore the issue. Following a study by Tax Justice Network-Africa (TJN-A), Ghana lost an estimated GHS2.0 billion due to transfer pricing abuses in the extractive sector, as reported in paragraph 289 of the 2017 Budget Statement and Economic Policy of the Ghanaian government. Ghana must stop the abuse of transfer pricing, and this cannot be overstated.
Osei, (2010) notes that MNEs account for 60% of all international and world trade. Countries around the world must scrutinize these increases in cross-border trade to prevent transfer pricing abuses (Ernst & Young, 2006). MNEs charge related parties for services such as technical and management fees and royalties. In addition to exporting goods and raw materials, the company exports finished products to associates in other jurisdictions. The result of this is that multinational enterprises (MNEs) adopt an abusive transfer pricing scheme to maximize their global profits at the expense of Ghana's tax revenue (GRA, 2013 TP Regimes).
"Companies or other entities established in more than one country" is what the OECD defines as a multinational enterprise (MNE). In addition to their home countries, MNEs also have subsidiaries abroad. Market access and return on investment are top priorities for the company. To meet the expectations of their shareholders, multinational companies use transfer pricing strategies to predict their profit levels. According to the report, they also used transfer pricing tools to shift income and returns from high-tax jurisdictions to low-tax jurisdictions. It is estimated that more than 100 multinational enterprises (MNEs) have set up shop and begun operations in Ghana. These companies rely on the government to create a conducive environment for their businesses to run smoothly. Because of the difficulties in starting a business, the government grants these companies several years of tax holidays. Large corporations employ a variety of tax planning strategies to avoid paying the required amount of taxes. The following are examples. Profits are transferred from Ghana to other countries, including their home country, by mispricing goods and services.
Compared to high-tax countries, where most business operations are conducted, low-tax countries report large profits on which either little or no corporate tax is due, while high-tax countries report relatively small profits. It is called Action (Aid, 2011). There are several limitations for developing countries, including the absence of comprehensive transfer pricing legislation. There is also limited availability of comparable data and limited skills of tax authorities to conduct pricing audits in some countries (Heggmair et al., 2013, Addo et al., 2017). The number of cross-border related party transactions is expected to increase in the coming years. More training will be needed for tax officials to understand the rules, says Price Waterhouse Coopers (Coopers, 2011).
Developed countries such as the US and others are making serious progress in the fight against transfer mispricing and profit shifting among related parties. They have developed extensive and sophisticated transfer pricing regulations, effective transfer pricing audit mechanism, and a well-trained and resources public (Tax official) and judiciary system that support enforcement of tax regulations (Action Aid, 2011; Osei, 2010). The study is different from other previous studies in the area of international transfer pricing methods effectiveness in the prevention of tax avoidance by Multinationals in Ghana in terms of arm’s length principle and methodologies. To assess the effectiveness of international transfer pricing methods in Ghana's Transfer Pricing Regulations 2012 (LI 2188), the researcher will examine the effectiveness of the methods in preventing tax avoidance by Multinational Enterprises in Ghana. In order to comply with the Regulation, taxpayers must demonstrate that all transactions between them and their related entities are conducted at arm's length.
One might ask: “Can’t the taxing authorities track these transfers and sniff out any improprieties?” The answer is yes, and they do. The taxing authorities are able to identify and “clamp down” on these practices when the fair values of these goods and services are easily determinable, but these practices are not as detectible when the goods and/or services do not have a market in which to compare. Therefore, the IRS requires that the business transactions between related parties mimic that of an unrelated genuine business transaction. That is to say, the same price an unrelated customer would pay should be the price the affiliates offered. This rule, called the “Arm’s-Length” principle, is designed to prevent tax avoidance.
The main objective of the study is to examine the factors that influence the choice of international Transfers pricing methods, in preventing tax avoidance by Multinational Enterprises (MNE’s) in Ghana. Specifically, the study seeks to:
1. Examine the factors that influence the choice of a particular Transfer pricing method by MNEs.
2. Examine how MNEs transfer pricing decision are taken.
Hyppotheses Development
Factors That Influence the Choice of a Particular Transfer Pricing Method by MNEs
Var1: Difference in income tax rates
Difference in corporate tax rates between countries in which multinationals operates provides incentives for multinationals to deploy transfer pricing mechanism to minimize the overall tax burden (Patel, 1981; Taylor, 2011). The higher the difference in corporate tax rates the greater the incentive for multinationals to shift profit from higher tax jurisdiction to the lower tax jurisdiction through various means including transfer pricing (Action Aid, 2011; Sikka & Willmott, 2010).
For example, as the Mauritius corporate tax rate is about 3% as compare to 25% tax rate in Ghana, procurement of Accra Brewery’s procurement through Mauritius have resulted to over invoicing of the raw materials prices due this tax differences there shifting Accra Brewery’s profit to Mauritius leading to loses by Accra Brewery’s for three years between 2007 and 2010 (Action Aid, 2011).
H1: The more the difference in tax rates between countries is perceived by management of Multinationals Enterprises, the more likely that the transfer pricing method that would be adopted will be cost based.
Var2: Minimization of custom duties
Customs duties/tariffs in developing countries including Ghana are always higher than that of the developed countries where the parent companies of most multinationals are located. The essence of high import duties in most developing countries is to help raise revenue for the government as the import always exceeds that of export. Also it is to serve as an anti-dumping measure to restrict the importation of foreign goods at cheaper prices that may be harmful to the citizens. It is further meant to protect local industries from cheap and inferior products which are meant to out compete local manufacturers.
All things being equal, the higher the import duties or tariff, the more multinationals will find ways of underpricing their raw materials and final products to their subsidiaries in the developing countries in order to minimize import duties or circumvent quota restriction on import (Wai, 2004). However, since underpricing and under invoicing will lead to higher profit being reported by subsidiaries, multinationals would normally balance the importance of their import duties minimization objective with the country’s corporate tax rates, restriction on profit repatriation and the exchange rate volatility.
H2: The higher the customs duties/tariff is perceived by management of Multinational Enterprises, the more likely that the transfer pricing method that would be adopted will be cost based.
Var3: Interest of local partners
Multinationals with local shareholders as part of the business would have an effect on the transfer pricing decisions of firms. Where multinationals use transfer mispricing such as over invoicing it has an effect on the profitability of the subsidiary which will subsequently affect the local partners’ share of profit in the business. Local partners would resist any transfer pricing abuses that will affect the profitability of the business and the profit that will come to them. They will therefore have keen interest and participate in transfer pricing decisions of the business where the memoranda of understanding permit them to take an active part in the financial policy decisions of the business.
It can therefore be said that multinational enterprises with high local partners’ interest and role in the management will have an impact on the transfer pricing decision to be taken.
H3: The more important local partners’ interest is perceived by management of Multinationals Enterprises, the more likely that the transfer pricing method that would be adopted would be market based.
Var4: Foreign exchange control and risks
The risks of foreign exchange control play a major role in the transfer pricing decision making of multinationals. However, many developing countries have tighter exchange control regimes. Fewer opportunities also exist in the developing countries to hedge against exchange loss. Developing countries including Ghana also have restriction on the amount of exchange losses on debt allowed as deductible expenses. In fact, section 33 of the Income Tax Act, 2015(ACT 896) indicates that the ratio of exchange losses should not exceed 3:1 of debt to equity. However, considering the extent to which developing countries’ currency depreciates against the currencies of the developed countries, multinationals will be induced to use transfers policies to shift liquid assets from their volatile developing countries’ subsidiaries.
The policy of exchange rate in Ghana is the flexible exchange rate which is aimed at providing incentives for increased production of exportable goods as well as enhancing Ghana’s competitiveness on the international market.
Going by the above, the study hypothesized that:
H4: The more important foreign exchange control and risk is perceived by management of Multinational Enterprises, the more likely that the transfer pricing method that would be adopted would be cost based.
Var5: Restrictions on profit repatriation
The extent of restriction placed on repatriation of dividend, royalties and management is an important decision affecting the transfer pricing policies of multinational enterprises. Many developing countries impose strict requirements for repatriating profit to parent companies including imposition of higher withholding tax. This is to ensure profit made by multinationals are retained in the country and used for expansion of the business in the country in order to create more job opportunities. Also because of scarcity of the foreign exchange, multinational repatriation of profit, dividend, management fees and royalties are subject to the availability of foreign exchange that a multinational has.
The level of importance that management of multinationals place on these conditions will determine the extent of the inducement to use transfer pricing policies to shift profit out of the host countries.
H5: The more important profit repatriation restriction is perceived by management of Multinationals Enterprises, the more likely that the transfer pricing method that would be adopted would be cost based.
Var6: Political Risks
Multinationals are always very skeptical about the political stability of their subsidiaries. Where a country has a history of political instability and forceful nationalization of foreign companies, investors in such countries use transfer pricing to ensure that they recoup their investment by diverting liquid funds out of these countries.
However, many developing countries are entering into international trade treaties that serve to protect the interest of these multinationals against political interferences and risk of potential forceful nationalization.
H6: The more important political risk is perceived by management of Multinational Enterprises, the more likely that the transfer pricing method that would be adopted would be cost based.
Var7: Good relationship with the Ghanaian government institutions
The extent of relationship that a multinational has with the host country government and its institutions influences the kind of transfer pricing decision it would take. Many multinationals try to have good relationship with the government in power, the main opposition government and other relevant state institution like the Ghana Revenue Authority, Ghana Investment Promotion Council etc. This is to ensure that disputes or bureaucratic huddles encountered by them are resolved amicably in the earliest time. Also, the extent of confidence that the multinational have in a country’s judicial system has effects on its transfer pricing policies.
H6: The more important management of Multinational Enterprises perceive relationship with host country (Ghana) to be good, the more likely that the transfer pricing method that would be adopted would be market based.
Methodology
Research Design and Data Set
Thus the study adopted the mixed methods which combine numeric and narrative properties was employed to obtaining statistical quantitative results using questionnaire with follow up interview to explore and get other qualitative information about MNEs behavior that could not be obtained through the use of the questionnaire.
The study population includes staff of Ghana Revenue Authority, (2013) Tax practitioners, Firms and Multinational Enterprises. The target populations are the Transfer pricing unit of the GRA, the tax unit of the Tax practitioners and the Tax and Finance unit of the Multinationals. This is due to the assumption that they have the requisite knowledge to enable the researcher meet the research objectives. It is also to ensure that staff of the population studied during the period whose work have no link with transfer pricing are excluded from the study.
Purposive sampling technique, (a non-probability sampling technique), was used to select staff of the Ghana Revenue Authority (GRA) and respondents from the tax practitioners.
Convenient sampling technique on the other hand will be used to select the respondents from the MNEs. This is because MNEs would not normally and easily grant interviews on sensitive issues like transfer pricing without prior personal contacts (Saunders, et al., 2009).
A sample size of 50 respondents was selected from a population because the area of study required persons/respondents with skills and knowledge in transfer pricing. The 50 was made up of 15 staff of the transfer pricing unit of the large tax payer unit of the Ghana Revenue Authority (GRA), 15 staff (tax unit) from the selected tax practitioners firms, 20 staff (tax and finance unit ) and 10 (2 from each MNE) MNEs.
The research instruments employed in this study is a set of structured and unstructured questionnaire. This was followed by semi structured interviews with the Managing Director or the Finance Director of MNE’s and the Tax managers of the tax practitioners/consultants to clarify, corroborate information obtained from staff through the structured questionnaires and find other qualitative information that could not be obtained through the questionnaires. All items were considered as approximately equal attitude value to which participants responded with degree or intensity of agreement and disagreement.
Structured questionnaires were given to two staff of the finance/tax unit of the MNE’S and the tax unit of the tax practitioners/consultants to answer for collection later by the researcher because of their expertise in dealing with transfer pricing on behalf of their organizations and clients. The researcher’s contact details were made available to the respondents to enable them clarify any questions or issues relating to the study.
The questionnaires were collected one week after they were delivered. A reminder was sent to respondents two days before the collection date.
Data Analysis and Statistical Model
The data was collected from the staff of the Ghana Revenue Authority, selected tax practitioner firms and MNEs. The data collected was organized in two stages. The data was organised and subsequently coded and entered into the Statistical Package for Social Sciences (SPSS), 20.0 versions to facilitate data analysis and description.
Both descriptive and inferential statistics was computed during the analysis of the data using both SPSS and Microsoft Excel. The descriptive aspect employed frequency tables whilst the inferential aspect of the analysis employed logistics regression model. The objective of the logistic regression is to correctly estimates the category of outcome for individual cases using the closest model that include the predictor variables that are useful in predicting the response variable. In this study, the probability of a transfer price method being effective is influenced by Staff Knowledge of TP Methods, Experience on TP methods application, Resources assigned to TP audit, Availability of comparables, and Frequency of TP Audit by the tax auditors among others (Drumm, 1983).
To this end, the logistic regression in this study uses the maximum likelihood estimation techniques to estimate the coefficients. This method yields the values of α and β which maximize the probability of obtaining the observed set of data by constructing a likelihood function which expresses the probability of the observed data as a function of the unknown parameters α and β.
Thus, the likelihood function for a given value of the Predictor X in a univariate case is given by

However, the likelihood function of a data is the product of the individual contributions thus
Likelihood function (L)
Taking the natural Logarithm of the likelihood function gives the log likelihood function as
The log likelihood function is differentiated in respect of α and β and equated to zero in order to get the values of the parameters that maximize the log likelihood function. The resultant equation is solved using iteration method to get the values of α and β which are referred as the maximum likelihood estimates (Cuthill, 2002).
Once the model fit the given set of data, its adequacy was determined using goodness of -fit –test and examination of influential observations. A model is consider fit when the difference between the observed and fitted values are small and if there is no systematic contribution of differences to the error structure of the model.
Several statistical methods have being developed to determine the fitness of a chosen model (The pseudo R2, scale Deviance, Pearson goodness of fit chi-square test and information criteria among other), however the study adopted the Hosmer and Lemeshow test which divides the range of probability values into groups based on covariate pattern and compared the observed and the expected counts within these groups using the chi-square statistic test. The smaller, the expected and the observed counts, the smaller the overall variance and thus the test statistic value. Therefore, a large p-value indicates a good fit.
The hypothesis of the model fitness was measured by Hosmer and Lemeshow test as follows.
H1: the model fits the data
H0: the model does not fit the data data.
Data Presentation and Analysis
Logistic Regression Results
The computation of the crude odds ratio for risk factors, X, is given by the estimate Exp (B). The crude odds ratio of factor determines the influence it has on the choice of a particular transfer pricing method. The Wald’s and log likelihood ratio tests are also performed to ascertain the significant effect of the factors. A probability value of less than or equal to 0.050 was considered to be statistically significant. Hence the inclusion of that factor is important in determining the choice of a particular transfer pricing method Y= 0 or 1.
The parameters of the model were estimated using maximum likelihood approach. The estimates for each independent variable are interpreted relative to the referenced category.
Factors Influencing the Choice of MNE’s Transfer Pricing Method-MNEs View
The Omnibus test of model coefficient gives an indication of how well the model performs, with predictors entered into the model. This is referred to as a “goodness of fit test”. From Table 1, the omnibus test results gave a highly significant value of 0.022 (the significant value must be less than 0.05) and a chi-square value of 9.008 with 7 degrees of freedom. Since our omnibus test is significant we can conclude that adding the predictors to the model has significantly increased our ability to predict effective transfer pricing method.
| Table 1 Omnibus Tests Of Model Coefficients |
||||
|---|---|---|---|---|
| Chi-square | Df | Sig. | ||
| Step 1 | Step | 9.008 | 7 | 0.022 |
| Block | 9.008 | 7 | 0.022 | |
| Model | 9.008 | 7 | 0.022 | |
The model summary provides information about the usefulness of the model. The Cox and Snell and Nagelkerke R-square values of 0.451 and 0.830 respectively indicated that the proportion of variation in the outcome variables being explained by the model is between 45.1% and 83% of the time in the Table 2. Therefore, the Nagelkerke R-square test was more acceptable and preferable for the model built as it shows more than half of the overall data (83%) were represented in the model.
| Table 2 Model Summary |
|||
|---|---|---|---|
| Step | -2 Log likelihood | Cox & Snell R Square | Nagelkerke R Square |
| 1 | 2.773a | 0.451 | 0.830 |
The Hosmer-Lemeshow test is a test for goodness of fit for logistic regression models in which the significance test should be greater than 0.05. From Table 3 above, the chi-square value for the Hosmer-Lemeshow test is 1.693 with a significant value of 0.638 which is greater than 0.05, indicating support for the model. This is a strong indication of a good model fit.
| Table 3 Hosmer And Lemeshow Test |
|||
|---|---|---|---|
| Step | Chi-square | Df | Sig. |
| 1 | 1.693 | 5 | 0.638 |
The Contingency Table 4 for Hosmer & Lemeshow Test simply shows the observed and expected values for each category of the outcome variable as used to calculate the Hosmer & Lemeshow chi-square. A better model fit is indicated by a smaller difference between the observed and predicted classification as evident in the table above. That is the insignificant differences remain between actual and expected values. This shows that the prediction is acceptable.
| Table 4 Contingency Table For Hosmer And Lemeshow Test |
||||||
|---|---|---|---|---|---|---|
| TP Method = Market based | TP Method = Cost based | Total | ||||
| Observed | Expected | Observed | Expected | |||
| Step 1 | 1 | 2 | 2.000 | 0 | 0.000 | 2 |
| 2 | 2 | 2.000 | 0 | 0.000 | 2 | |
| 3 | 3 | 3.000 | 0 | 0.000 | 3 | |
| 4 | 2 | 2.000 | 0 | 0.000 | 2 | |
| 5 | 2 | 2.000 | 0 | 0.000 | 2 | |
| 6 | 2 | 2.000 | 1 | 1.000 | 3 | |
| 7 | 0 | 0.000 | 1 | 1.000 | 1 | |
The classification Table 5 above gave an indication of how well the model is able to predict the correct category (market based or cost based) for each attribute. From Table 5 above, the percentage of accuracy in classification (PAC) is 93.3%. This implies that the model correctly classified 93.3% of cases overall. That is 100% of the outcome market based on the variable cost method to be selected is predicted correctly while 50% of the outcome cost based of the variable cost method to be selected is predicted correctly by the fitted model.
| Table 5 Classification Table |
||||
|---|---|---|---|---|
| Observed | Predicted | |||
| TP Method | Percentage Correct | |||
| Market based | Cost based | |||
| TP Method | Market based | 13 | 0 | 100.0 |
| Cost based | 1 | 1 | 50.0 | |
| Overall Percentage | 93.3 | |||
Table 6 gives the information about the contribution or importance of each predictor variables. The test that is used here is known as the Wald test and the test statistic for each predictor variable is shown in the column labeled Wald. The significance of the Wald statistic for each independent variable indicates the overall factors influencing the choice of MNE’s Transfer Pricing Method-MNEs View (P<0.05). The significance of the variables are assessed by the p-value (represented in the table by “sig.”), the Wald’s statistic value or the odd ratios represented by
| Table 6 Factors Influencing The Choice Of Mne’s Transfer Pricing Method-Mneview |
|||||||
|---|---|---|---|---|---|---|---|
| B | S.E. | Wald | df | Sig. | Exp(B) | ||
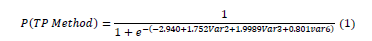
| Step 1a | Difference in income tax rates | 0.171 | 0.218 | 0.616 | 1 | 0.433 | 1.187 |
| Minimization of custom duties | 1.752 | 0.581 | 7.047 | 1 | 0.008 | 4.674 | |
| Interest of local partners | 1.998 | 0.203 | 0.238 | 1 | 0.000 | 0.906 | |
| Foreign exchange control and risks | 1.062 | 0.579 | 3.365 | 1 | 0.067 | 2.891 | |
| Restrictions on profit repatriation | 0.681 | 0.513 | 1.762 | 1 | 0.184 | 1.976 | |
| Risks of expropriation and nationalization | 0.801 | 0.341 | 5.508 | 1 | 0.019 | 2.229 | |
| Good relationship with the Ghanaian Government | 0.021 | 0.425 | 0.002 | 1 | 0.960 | 1.021 | |
| Constant | -2.940 | 2.327 | 6.516 | 1 | 0.011 | 0.003 | |
From the table, column five (5) determines the significant predictor variables at 0.05 level of significance. The three-significant variables are Minimization of custom duties (Var 2), Interest of local partners (Var 3) and Risks of expropriation and nationalization (Var 6)
Thus, the logistic function is given by equation a below:
Factors Influencing the Choice of MNE’s Transfer Pricing Method- Tax practitioners’ perspectives
The Omnibus test of model coefficient gives an indication of how well the model performs, with predictors entered into the model. This is referred to as a “goodness of fit test”. From Table 7, the omnibus test results gave a highly significant value of 0.036 (the significant value must be less than 0.05) and a chi-square value of 15.012 with 7 degrees of freedom. Since our omnibus test is significant we can conclude that adding the predictors to the model has significantly increased our ability to predict transfer pricing method.
| Table 7 Omnibus Tests Of Model Coefficients |
||||
|---|---|---|---|---|
| Chi-square | Df | Sig. | ||
| Step 1 | Step | 15.012 | 7 | 0.036 |
| Block | 15.012 | 7 | 0.036 | |
| Model | 15.012 | 7 | 0.036 | |
The model summary provides information about the usefulness of the model. The Cox and Snell and Nagelkerke R-square values of 0.468 and 0.74 respectively in Table 8 indicated that the proportion of variation in the outcome variables being explained by the model is between 46.8% and 74% of the time. Therefore, the Nagelkerke R-square test was more acceptable and preferable for the model built as it shows more than half of the overall data (74%) were represented in the model.
| Table 8 Model Summary |
|||
|---|---|---|---|
| Step | -2 Log likelihood | Cox & Snell R Square | Nagelkerke R Square |
| 1 | 5.545a | 0.468 | 0.74 |
The Hosmer-Lemeshow test is a test for goodness of fit for logistic regression models in which the significance test should be greater than 0.05. From Table 9 above, the chi-square value for the Hosmer-Lemeshow test is 0.0 with a significant value of 1.0 which is greater than 0.05, indicating support for the model. This is a strong indication of a good model fit.
| Table 9 Hosmer And Lemeshow Test |
|||
|---|---|---|---|
| Step | Chi-square | Df | Sig. |
| 1 | 0.0 | 6 | 1.00 |
Source: Author’s Field Study, July 2016.
The Contingency Table for Hosmer and Lemeshow Test simply shows the observed and expected values for each category of the outcome variable as used to calculate the Hosmer and Lemeshow chi-square. A better model fit is indicated by a smaller difference between the observed and predicted classification as evident in the Table 10 above. That is the insignificant differences remain between actual and expected values. This shows that the prediction is acceptable.
| Table 10 Contingency Table For Hosmer And Lemeshow Test |
||||||
|---|---|---|---|---|---|---|
| TP Method = Market based | TP Method = Cost based | Total | ||||
| Observed | Expected | Observed | Expected | |||
| Step 1 | 1 | 2 | 2 | 1 | 1 | 3 |
| 2 | 1 | 1 | 1 | 1 | 2 | |
| 3 | 0 | 0 | 2 | 2 | 2 | |
| 4 | 0 | 0 | 1 | 1 | 1 | |
| 5 | 0 | 0 | 3 | 3 | 3 | |
| 6 | 0 | 0 | 4 | 4 | 4 | |
The classification Table 11 above gave an indication of how well the model is able to predict the correct category (market based or cost based) for each attribute. From Table 9 above, the percentage of accuracy in classification (PAC) is 80.0%. This implies that the model correctly classified 80.0% of cases overall. That is 0.0% of the outcome market based on the variable cost method to be selected is predicted correctly while 100.0% of the outcome cost based of the variable cost method to be selected is predicted correctly by the fitted model.
| Table 11 Classification Table |
||||
|---|---|---|---|---|
| Observed | Predicted | |||
| TP Method | Percentage Correct | |||
| Market based | Cost based | |||
| TP Method | Market based | 0 | 3 | 0.0 |
| Cost based | 0 | 12 | 100.0 | |
| Overall Percentage | 80.0 | |||
Table 12 gives the information about the contribution or importance of each predictor variables. The test that is used here is known as the Wald test and the test statistic for each predictor variable is shown in the column labeled Wald. The significance of the Wald statistic for each independent variable indicates the overall factors influencing the choice of MNE’s Transfer Pricing Method- Tax practitioners’ perspectives (P<0.05). The significance of the variables are assessed by the p-value (represented in the table by “sig.”), the Wald’s statistic value or the odd ratios represented by
| Table 12 Tax Practitioners View On Factors Influencing The Choice Of Mne’s Transfer Pricing Method |
|||||||
|---|---|---|---|---|---|---|---|
| B | S.E. | Wald | Df | Sig. | Exp(B) | ||
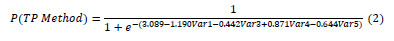
| Step 1a | Difference in income tax rates | -1.190 | 0.178 | 44.678 | 1 | 0.000 | 0.304 |
| Minimization of custom duties | 0.293 | 0.223 | 1.727 | 1 | 0.189 | 1.341 | |
| Interest of local partners | -0.442 | 0.181 | 6.008 | 1 | 0.014 | 0.642 | |
| Foreign exchange control and risks | 0.871 | 0.151 | 1.652 | 1 | 0.000 | 2.389 | |
| Restrictions on profit repatriation | -0.644 | 0.151 | 18.272 | 1 | 0.000 | 0.525 | |
| Risks of expropriation and nationalization | -0.024 | 0.243 | 0.010 | 1 | 0.920 | 0.976 | |
| Good relationship with the Ghanaian Government | .021 | .425 | .002 | 1 | .960 | 1.021 | |
| Constant | 3.089 | 1.883 | 2.690 | 1 | 0.101 | 21.952 | |
From the table, column five (5) determines the significant predictor variables at 0.05 level of significance. The four variables which were significant are Difference in income tax rates (Var 1); Interest of local partners (Var 3); Foreign exchange control and risks (Var 4) and Restrictions on profit repatriation (Var 5).
Thus, the logistic function is given by equation a below:
Multinational Enterprise Transfer Pricing Decision Making Process
The ability to fixed transfer pricing to a large extent depend on the interest of the parent company. This section presents the results of data collected from both the multinationals and tax practitioners on whether their transfer pricing are taken by subsidiaries alone, in consultation with parent companies or they adopts the world policies of the parent company.
Table 13 showed that 12 (40%) participants which comprised 8 (66.7%) MNES and 4 (33.3%) Tax practitioner indicated that transfer pricing decisions are taken in consultation with parent company. Also, 5 (17%) of them which comprised 4 (80%) MNES and 1 (20%) Tax practitioner indicated that transfer pricing decisions are taken by subsidiary company without direct influence from parent company. Finally, 13 (43%) participants which comprised 3 (23.1%) MNES and 10 (76.9%) Tax practitioner indicated that transfer pricing decisions are taken based on worldwide policy.
| Table 13 How Transfer Pricing Decisions Are Taken |
||||
|---|---|---|---|---|
| Variables | MNES perspective | Tax practitioner perspective | Total | Percentage (%) |
| Taken in consultation with parent company | 8 | 4 | 12 | 40 |
| Taken by subsidiary without direct influence from parent company | 4 | 1 | 5 | 17 |
| Based on worldwide policy | 3 | 10 | 13 | 43 |
| Totals | 15 | 15 | 30 | 100 |
Discussion
We conclude by first discussing our findings in relation to our research objectives that motivated our research.
Discussion of Findings
The result from the analysis shows that most of these multinationals transfers pricing decision are taken in consultation with parent company even though some of them take their transfer pricing decision without consulting their parent company but based on worldwide policies. This means that parent companies could have greater influence in the transfer pricing method to apply since they would want to maximize their group profit at the detriments of tax revenue to the Ghana Government. Also, most of the multinationals that the tax practitioners consult on are wholly owned foreign subsidiaries who take their transfer pricing decisions using worldwide policies. The dominant transfer pricing methods used by the multinational that they consult on adopt the Transaction net margin method; follow by the comparable uncontrolled price method (CUP). Others adopt the cost plus, the resale price method and the profit split.
In selecting a method that would be effective and in arm’s length application, certain factors must be taken into consideration. The tax practitioners and tax officials all noted that transaction functionality, availability of arm’s length comparable, tax official knowledge and experience, resource (human, financial, and materials) allocation to the unit, the frequency of transfer pricing audit that officials undertake, the knowledge of the multinationals, are key determinants for selecting or applying the right or effective method that will curb transfer mispricing by multinationals thereby preventing any disagreement between the tax officials and the MNE’s.
The ability of staff of the revenue collecting agencies to identify transfer pricing risk through general audit and flag them with the transfer pricing unit depends on the sufficiency of knowledge acquire (Read head, 2016). Thus, knowledge could be acquired through training locally and internationally with the support of international partners. Equally the experience one has in the job is important in choosing or applying any effective transfer pricing method for a transaction. Experience could be gotten through job rotations, enlargement or enrichment.
The tax officials equally revealed that multinationals are always unwilling to revealed their actual transfer pricing transaction. This is due to inadequate education and training of multinationals, non-enforcement of the law through transfer price audit as a result of the smaller number of staff at the unit. In order to improve tax compliance, the head of the transfer pricing unit noted that, continuous education, enforcement of the law through transfer price and general tax audit and refresher training for the MNE’S, Tax consultants (Tax practitioners) and the judiciary would help (interview report of head of transfer pricing unit, July 2016).
The tax practitioners and the MNE,s study also revealed that, difference in income tax among countries, import and export duties, interest and participation of local partners, restriction on profit and dividend repatriation, exchange rate risk, political risk of nationalization of foreign companies and the relationship with host government at a time are important variables/factors that MNE’s consider when formulating transfer pricing policies and in deciding which transfer pricing method to adopt. Tax officials must therefore be alert in their audit as a change in any of these variables would impact the kind of methodology that the MNE’s will use.
Conclusion
This study provides comprehensive analysis of the factors that influence the choice of international transfer pricing methods in preventing tax abuses by multinationals in Ghana.
The study also indicated that certain economic, social and political variables or risk affects MNEs in their transfer pricing methods selection process. The greater management of MNEs perceived that the risk of exchange control, import and export duty, income tax rate profit/dividend repatriation and nationalization of foreign companies are high the more likely that the cost based transfers pricing method will be used. Likewise, the greater the interest of local partners in the business and good relationship with government the likelihood that the transfer pricing methods that will be adopted would be market. Local partners serve as monitors themselves in the business in order to protect their interest. MNEs that have good relationship with the government will seek to reduce confrontation with the state and the tax authorities hence the adoption of the market based transfer pricing methods.
It importance to note that cost based methods such as the CUP, Resale price method and the cost-plus method allows more flexibility for dealing with restrictive laws and regulation. Market based methods on the other hand are considered more objective and fairer to both the tax authority and the MNEs.
Policy makers should therefore make policy that will reduces exchange rate risk, reduce political interference in the management of MNEs, reduces import and export duties and the tax rates between it and the parent countries of their MNEs in order to reduce the incentives to shift profit out of Ghana through transfer mispricing.
The results also show that multinational decision-making processes are influence by their parent companies. There is therefore, the likelihood that export oriented MNEs would use abusive transfer prices to move profits out from Ghana to achieve their organizational objectives. These empirical results are consistent with the theoretical predictions.
References
Addo, E.B., Salia, H., & Ali-Nakyea, A. (2017). Transfer pricing abuse: the Ghanaian perspective and the role of the accountant in tax compliance. Journal Akuntansi and Bussiness Research, 5(2), 83-91.
Indexed at, Google Scholar, Cross Ref
Action Aid. (2011). Multinational enterprises must stop profit shifting and pay their corporate income taxes. Accessed at http://www.actionaid.org/ghana/2011/12/multinational-enterprises-must-stop-profit-shifting-and-pay-their-corporate-income-tax.
Amidu, M., Coffie, W., & Acquah, P. (2019). Transfer pricing, earnings management and tax avoidance of firms in Ghana. Journal of Financial Crime.
Indexed at, Google Scholar, Cross Ref
Aid, C. (2011). False profits: robbing the poor to keep the rich tax-free.
Brock, G., & Pogge, T. (2014). Global tax justice and global justice. Moral Philosophy and Politics, 1(1), 1-15.
Indexed at, Google Scholar, Cross Ref
Chan, K.H., Lo, A.W., & Mo, P.L. (2015). An empirical analysis of the changes in tax audit focus on international transfer pricing. Journal of International Accounting, Auditing and Taxation, 24, 94-104.
Indexed at, Google Scholar, Cross Ref
Clausing, K.A. (2003). Tax-motivated transfer pricing and US intrafirm trade prices. Journal of Public Economics, 87(9-10), 2207-2223.
Indexed at, Google Scholar, Cross Ref
Cristea, A.D., & Nguyen, D.X. (2016). Transfer pricing by multinational firms: New evidence from foreign firm ownerships. American Economic Journal: Economic Policy, 8(3), 170-202.
Indexed at, Google Scholar, Cross Ref
Cuthill, M. (2002). Exploratory research: citizen participation, local government and sustainable development in Australia. Sustainable Development, 10(2), 79-89.
Indexed at, Google Scholar, Cross Ref
Drumm, H.J. (1983). Transfer pricing in the international firm. Management International Review, 32-43.
Dyreng, S.D., & Lindsey, B.P. (2009). Using financial accounting data to examine the effect of foreign operations located in tax havens and other countries on US multinational firms' tax rates. Journal of Accounting Research, 47(5), 1283-1316.
Indexed at, Google Scholar, Cross Ref
Ernst, & Young. (2006). Global Transfer Pricing Surveys: Tax Authority Interviews: Perspectives, Interpretations, and Regulatory Changes.
Ghana Revenue Authority. (2013). Practice Note on Transfer Pricing Regulations 2012 (L.I 2188): Methodologies and related issues.Accessed at http://www.drtp.ca/wpcontent/uploads/2015/02/Ghana_Transfer_pricing_regulations_-2012L.I2188.pdf.
Gravelle, J.G. (2009). Tax havens: International tax avoidance and evasion. National Tax Journal, 62(4), 727-753.
Indexed at, Google Scholar, Cross Ref
Heggmair, M., Bandoehlke, N., & Nakyea, A. (2013). International Transfer Pricing in Developing Countries: Ghana Rising. International Transfer Pricing Journal, 20(6).
Henn, M. (2013). Tax havens and the taxation of transnational corporations. Friedrich-Ebert-Stiftung.
Jacob, J. (1995). Taxes and transfer pricing: Income shifting and the volume of intra-firm transfers (Doctoral dissertation, Northwestern University). Journal of Accounting Research, 34(2), 301-312.
Indexed at, Google Scholar, Cross Ref
Jansk, P., Prats, A., & Aid, C. (2013). Multinational corporations and the profit-shifting lure of tax havens. Christian Aid Occasional Paper, 9.
Nakyea, A. (2012). Transfer pricing-The comfort or pain of the Multinationals. WTS-CITG.
Osei, E.K. (2010). Transfer Pricing in Comparative Perspective and the need for Reforms in Ghana. Transnat'l L. & Contemp. Probs., 19, 599.
OECD. (2012). Dealing Effectively with the Challenges of Transfer Pricing, OECD Publishingcccc.
OECD. (2010). OECD Transfer Pricing Guidelines for Multinational Enterprises and Tax Administrations 2010: (Serbian version), SFS, Belgrade.
OECD. (2008). Guidelines for Multinational Enterprises. Accessed at OECD website at www.oecd.org/daf/investment/guidelines
Patel, M. (1981). A Note on Transfer Pricing by Transnational Corporations. Indian Economic Review, 16(1/2), 139-152.
Pendse, S.J. (2012). International transfer pricing: A review of non-tax outlook. Procedia-Social and Behavioral Sciences, 37, 337-343.
Indexed at, Google Scholar, Cross Ref
Coopers, P. (2011). International transfer pricing 2011. Accessed at https://www.pwc.com/gx/en/international-transfer-pricing/assets/itp-2011.pdf.
Saunders, M., Lewis, P., & Thornhill, A. (2009). Research methods for business students. Pearson education. 130.
Sikka, P., & Willmott, H. (2010). The dark side of transfer pricing: Its role in tax avoidance and wealth retentiveness. Critical Perspectives on Accounting, 21(4), 342-356.
Indexed at, Google Scholar, Cross Ref
Slemrod, J., & Wilson, J.D. (2009). Tax competition with parasitic tax havens. Journal of Public Economics, 93(11-12), 1261-1270.
Indexed at, Google Scholar, Cross Ref
Taylor, V.A. (2011). The Transfer Price Conundrum. International Business & Economics Research Journal (IBER), 5(11).
Indexed at, Google Scholar, Cross Ref
Taylor, G., & Richardson, G. (2012). International corporate tax avoidance practices: Evidence from Australian firms. The International Journal of Accounting, 47(4), 469-496.
Indexed at, Google Scholar, Cross Ref
TOMEDI, A.C., & Schreiber, D. (2014). Transfer pricing in the context of the management of earnings. Business Management Dynamics, 3(7), 28-39.
Received: 06 Oct 202 1 , Manuscript No. AAFSJ 21 8708 ; Editor assigned: 08 Oct 202 1 , PreQC No. AAFSJ 21 8708 (PQ); Reviewed: 22 Oct 202 1 , QC No. AAFSJ 21 8708 ; Revised: 18 Mar 2022 , Manuscript No. AAFSJ 21 8708 ( R); Published: 26 Mar 2022