Research Article: 2019 Vol: 23 Issue: 5
Financial Constraints, Investment Opportunity Set, Financial Reporting Aggressiveness, Tax Aggressiveness: Evidence from Indonesia Manufacturing Companies
Amrie Firmansyah, Polytechnic of State Finance STAN
Reza Bayuaji, Polytechnic of State Finance STAN
Abstract
This study is aimed to investigate the effect of financial constraints, investment opportunity set, and financial reporting aggressiveness on tax aggressiveness. This research uses the quantitative method. Analysis of this research is conducted by using a multiple linear regression model. The sample used in this study is a non-financial company listed on the Indonesia Stock Exchange (IDX). The type of data used in this study is secondary data in the form of financial statements of companies listed on the Indonesia Stock Exchange from 2011 to 2015. Selected companies data amounted to 88, so the total samples in this study are 440 firms-years by using purposive sampling. The data examined in this study uses multiple regression analysis with panel data. The result of this study suggests that financial constraints are positively associated with tax aggressiveness. Meanwhile, the investment opportunity set is negatively associated with tax aggressiveness. Furthermore, financial reporting aggressiveness is not associated with tax aggressiveness.
Keywords
Financial Reporting Aggressiveness, Tax Planning
Introduction
Corporate tax is a significant source of government revenue across the world. However, the release of the Panama Papers has highlighted the vast and many deficiencies in the tax and regulatory, especially in developing countries. Prior studies suggested tax aggressiveness is not exclusive to the Organisation for Economic Co-operation and Development (OECD) countries and seriously harm developing economies (Christensen & Kapoorii, 2005). Developing countries, including those in Asia, are struggling to strengthen their tax systems and counter tax aggressiveness. According to a report by Global Financial Integrity (2015), Asia is the highest region as accounted for 38.8% of the estimated $7.8 trillion that developing countries lost due to illicit financial outflows in 2004-2013. However, major resource drainage from India, Malaysia, Thailand, and Indonesia also boosted the region’s global ranking in illicit outflows. According to the International Monetary Fund (2016), in Southeast Asia, Indonesia considered the country that has the lowest tax ratio, far below the average ratio of OECD countries. In the last ten years, the tax ratio in Indonesia is only in the range of 11% -13%.
Meanwhile, the average tax ratio in developed countries is about 24% and in other middle-income countries ranges from 16%-18%. However, low tax ratio indicates that the tax received by the government is much lower than the potential. In the last ten years, based on the Indonesia Central Government Financial Statements the realization of the tax revenue only exceeds the target once, and the rests were never achieved. One of the obstacles to optimizing tax revenue is the existence of tax aggressiveness conducted by companies. As an effort to maximize the firm’s value, the owner intends management to reduce tax payments more aggressively (Chen et al., 2010). Therefore, companies tend to minimize tax expenses through various ways of tax avoidance or tax savings. The attempts to minimize this tax burden are called tax aggressiveness (Hanlon & Slemrod, 2009; Chen et al., 2010). This opinion is supported by Frank et al. (2009) who stated that corporate tax aggressiveness is an act to manage taxable income, conducted by the companies through tax planning activities, both using legal (tax avoidance) and illegal (tax evasion). Tax planning action is considered to be divided into normal tax planning and aggressive tax planning. According to Edward et al. (2016), normal tax planning is a tax strategy that is carried out legally which fully complies with tax laws, while aggressive tax planning is a tax strategy that is carried out very aggressively caused by aggressive interpretations of the rules of tax law that are ambiguous. The company may be more aggressive if it interprets more gaps in the rules of tax law. Hanlon & Heitzman (2010) defined tax aggressiveness as the ultimate level of tax planning behaviors. This statement is relevant to Taylor & Richardson (2012) which argued that companies classified as tax aggressive pay fewer taxes than other similar companies, both industrial and size. The company conducts tax planning which may or may not is considered fraud or tax evasion.
Tax aggressiveness can provide both marginal benefit and marginal cost (Chen et al., 2010). Marginal benefits that may be obtained as summarized by Hidayanti (2013) are tax savings paid by the company to the government, managers who are compensated by the owner/shareholder for aggressive tax action undertake, and an opportunity for managers to do rent extraction. Furthermore, the marginal cost of aggressive tax action, among others, is the possibility of companies getting a penalty from tax authorities, and the decline in stock prices of companies. Stock price will decline because other shareholders consider that tax aggressiveness activity conducted by managers for rent extraction could disappoint shareholders (Desai & Dharmapala, 2006).
Furthermore, one of the hypotheses in Positive Accounting is the firm’s political cost theory (Watts & Zimmerman, 1990). This theory explains that the greater political cost, the more likely managers choosing accounting policies that shift their current earnings into the upcoming period. Political costs such as regulatory changes, changes in tax rates, and other policy changes related to the existence of the company. The hypothesis is consistent with the reason why the company chooses an accounting policy that minimizes income tax. Taxes are a political cost that can reduce corporate profits (Watts & Zimmerman, 1990). Therefore, managers tend to take opportunistic actions in choosing accounting policies to decrease the company’s taxable income. It is relevant with agency relationship perspective which is mainly used to understand the conflict of interest faced by management in manipulating corporate earnings, through the practice of tax aggressiveness. An agency relationship is a contract between the manager (agent) and the investor (principal). In such relationships the owner delegates some authority or decision-making rights to management as an agent. Conflicts of interest between owner and agent occur because there is such possibility of an agent does not always act by the interests of the principal, thus triggering agency costs (Jensen & Meckling, 1976). Motivated principal parties established contracts to prosper themselves through the distribution of dividends or increases in the company's stock price while agents are motivated to improve their welfare through increased compensation.
Tax aggressiveness could be conducted due to financial constraints. According to Fazzari et al. (1988), financial constraints are a condition of companies that are experiencing difficulties in obtaining funding sources, resulting from the high cost of debt, as well as the expensive cost of equity, which appears from their low market to book ratio and cash flow. Financial constraints are, therefore, specifically defined as the limitations that firms derive from increasing funding from external sources (Kaplan & Zingales, 1997). Related to tax aggressiveness, Edwards et al. (2016) stated that companies experiencing financial constraints would maximize new internal funding sources, by reducing the costs incurred. Cutting tax costs does not affect long-term corporate performances, so companies will be motivated to practice tax aggressiveness. In line with that, Chen & Lai (2012) stated that operating cash flow is crucial for companies that are experiencing financial constraints. Therefore, they have more incentives to practice tax aggressiveness to generate higher operating cash flow. The companies experiencing financial constraints tend to save cash by practicing tax aggressiveness to increase investment in the future (Chen & Lai, 2012). Reducing the number of tax payments significantly and substantially increases the operating cash flows of companies experiencing financial constraints (Edwards et al., 2013; Edwards et al., 2016). It is closely related to the economic condition of companies in Indonesia.
Chen & Lai (2012) explained that internal funding sources of the company with financial constraints could be conducted through the practice of tax aggressiveness. By engaging in aggressive tax avoidance practices, companies with limited financing will save more cash efficiently and then the company will use austerity cash to help solve underinvestment problems experienced by financially constrained companies. The study concluded that companies experiencing financial constraints are more aggressive in tax avoidance than companies without financing constraints. Furthermore, Edwards et al. (2013) examined the impact of financial constraints on tax aggressiveness. Companies experiencing limited funding will find ways to increase internal funding sources through tax planning such as deductions of tax expense paid, with a reason that deductions do not have a negative impact on long-term company performances. Furthermore, Edwards et al. (2016) refined their previous research with a focus on saving cash tax payments when the company experiences financial constraints. The company will increase the cash savings of tax payments through tax deferral strategy.
The studies were supported by Law & Mills (2014) and Akamah et al. (2016).All previous studies employed US data as one of the developed counties. It is essential to re-examine the effect of financial constraints on tax aggressiveness in developing countries to compare the result of studies. Therefore, this study uses data from Indonesia as one of the developing countries. Based on the literature review, there is no research in Indonesia that discussed the effect of financial constraints on tax aggressiveness, so that this study is important to use one of developing countries context. The weakening of the global economy and the reducing of capital flows to emerging markets is putting pressure on domestic economic growth (Bank Indonesia, 2009). In real sectors, weakening of Indonesia currency, inflation, and difficulties on working capital incited banks to tighten their lending policies. Also, bank lending rates also rose, along with rising interest rates of the central bank. For the companies, the increase in lending rates could lead them difficult to invest. Furthermore, poor economic performance has an impact on the decline in business profitability, which is one of the primary sources of company financing. These conditions lead to the occurrence of financial constraints that will hold the company in investment and business expansion (The Bank of Indonesia, 2009). Thus, Indonesian companies experiencing financial constraints tend to have more motivation to do such tax aggressive practices. However, there is no research in Indonesia explains that companies experiencing financial constraints tend to do tax aggressiveness as an effort to save cash for investment purposes in the future. This study contributes to research literature of taxation by adding determinant of corporate tax aggressiveness.
In line with financial constraints, financial ratios that represent an investment opportunity set (IOS) are also expected to affect tax aggressiveness. IOS is an indicator of company growth rate. A growing company is a company that has future investment options (Smith & Watts, 1986). According to Myers (1977), IOS is a combination of assets in place with investment options in the future. While Gaver & Gaver (1993) stated that IOS is the firm’s value whose size depends on future expenditures, which at present is an investment alternative for generating greater expected returns. IOS includes capital expenditures for new product introductions or expanding the range of existing product markets, alternative expenditures to reduce corporate restructuring costs, and favorable accounting policy options (Adam & Goyal, 2008). Myers (1977) found that firms with high growth rates are more likely not increasing debt due to underinvestment and asset substitution issues. In this case, managers are more likely to invest in projects that have a positive net present value, which can increase the firm’s value because debtholders are the party that has the first claim to cash flow generated from the project.
Furthermore, by adding debt, assets owned are used as collateral. Asset-substitution problems occur when opportunistic managers replace higher variance assets with lower variance assets, once debt or bonds are issued. Therefore, companies with high IOS tend to decrease leverage levels (Gaver & Gaver, 1993). Companies that are growing tend to use less funding from external parties in the form of debt. The company prefers to use internal financing so that the profits from the investment will maximize shareholder value (Jaggi & Gul, 1999). From an investment portfolio perspective, firms with high IOS have a smaller probability of conducting tax aggressiveness because the company already has investment alternatives which return exceeding the benefits from the tax aggressiveness itself (McGuire et al., 2014). Also, firms with high IOS tend to have a lower proportion of debt, so the company may not take advantage of debt interest that could reduce corporate tax expenses (Rubai, 2009). While interest on the debt as a tax deduction should be an incentive for a company in conducting tax aggressiveness (Cheng et al., 2012). Rubai (2009) found that IOS has a positive effect on the company's effective tax rate, which is one of the tax aggressiveness proxies. The study is different from Handayani (2013) who found that IOS does not affect the company's effective tax rate. Differences in these studies lead further research on IOS is interesting to do.
Research in Indonesia by Rubai (2009) found that IOS has a positive effect on corporate tax burden as reflected by the value of the company's Effective Tax Rate (ETR). The companies with high IOS are also more likely to optimize their investment and use less debt. That means the company will miss the opportunity to save on its tax burden (ETR) through interest expense. Utilization of debt interest is a common mode used in tax aggressiveness practices. However, this is in contrast to Handayani (2013) which stated that IOS does not affect the company's effective tax rate. Allegedly the different findings may cause the study employed only one ratio as the proxy, while Rubai (2009) employed five IOS proxies. Therefore, this inconsistency result needs to be examined in this study.
Furthermore, financial reporting aggressiveness is essential to be examined with tax aggressiveness as well. The financial reporting aggressiveness is an activity of improving accounting profit through earnings management, which may or may not violates the generally accepted financial accounting principles (Frank et al., 2009). According to Scott (2015), several things can motivate companies to practice aggressive financial reporting, such as bonus motivation, long-term debt agreement, politics, fulfillment of investor expectations and reputation. To maintain a good reputation from stakeholders or to obtain an injection of funds from investors or shareholders companies tend to demonstrate high profits. Furthermore, Healy & Wahlen (1999) explained that earning management occurs when managers use their opinions in the preparation of corporate financial statements and manage transactions that occur to alter financial statements, either to mislead stakeholders or to influence users of other financial statements depending on figures listed in the financial statements. Activities to increase corporate profits through earning management, whether appropriate or not, by generally accepted accounting principles known as financial reporting aggressiveness (Frank et al., 2009). Companies can also avoid taxes by utilizing aggressive financial reporting practices associated with the discretionary (policy) of accrual earnings management (Dechow et al., 1995; Healy & Wahlen, 1999; Jones, 1991).
Research related to this financial reporting aggressiveness begins from Shackelford & Shevlin (2001) who conducted review literature on tax research in accounting. They found that financial reporting aggressiveness and tax aggressiveness are two mutually trade-off decisions. This study was later supported by Erickson et al. (2004) with the same result. Ideally, earnings management cannot be conducted simultaneously. If the company raises profits, then the tax would increase whereas if the company decreases profits then tax will decrease. However, Hanlon & Shevlin (2005) found that companies do not always face a trade-off in financial and tax reporting because companies may increase book-tax difference or the difference between earnings in financial statements with taxable income. The amount of book-tax difference indicates the occurrence of aggressiveness of financial and tax reporting simultaneously. Frank et al. (2009) found that tax aggressiveness and financial reporting aggressiveness can be conducted within the same period, so there is no trade-off between the decisions. Companies could increase the number of tax loopholes utilized by companies due to differences (nonconformity) between accrual accounting principles and taxation regulations (Frank et al., 2009; Hanlon & Heitzman, 2010).
Logically, financial reporting aggressiveness that generates high profits can also increase the tax expenses. This statement is considered as the book-tax trade-off (Shackelford & Shevlin, 2001). However, Frank et al. (2009) found that firms could report high earnings to shareholders, but they pay a low tax burden to tax authorities in the same period. The relationship between the aggressiveness of financial and tax reporting has been investigated by Kamila & Martani (2014) and Ridha & Martani (2014) previously in Indonesia. The results suggested that there is a strong positive influence between financial reporting aggressiveness and tax aggressiveness. It means that the increasing number of loopholes could be utilized by companies due to differences in accounting principles and tax regulations. Nevertheless, research on the effect of aggressive financial reporting and tax aggressiveness in Indonesia is also conducted by Geraldina (2013) which found that financial reporting aggressiveness is negatively associated with tax aggressiveness. Therefore, this study tries to reexamine the inconcistency result especially in Indonesia context.
This study attempts to examine the effect of financial constraints, investment opportunity set, and financial reporting aggressiveness on tax aggressiveness. This study employs Lim (2011) model as tax aggressiveness proxy. While financial constraints are measured using the Whited & Wu indices (2006), IOS is measured using composite or combined measurements of five proxies as Gaver & Gaver (1993). Furthermore, financial reporting aggressiveness is proxied by Jaggi et al. (2009) model.
Chen & Lai (2012) explained internal funding sources of the company with financial constraints could be conducted through the practice of tax aggressiveness. By engaging in aggressive tax avoidance practices, companies with limited financing will save more cash efficiently and then the company will use austerity cash to help solve underinvestment problems experienced by financially constrained companies. Based on previous studies that have consistently provided the direction of financial constraints influence is positive on tax aggressiveness, the hypothesis in this study is set in a positive direction as well, so the first hypothesis in this study is:
H1:Financial constraints is positively associated with tax aggressiveness.
McGuire et al. (2014) examined the effect of IOS on tax sheltering activity, which is classified as an aggressive tax practice. The study explained that companies that have many investment alternatives in the future would invest less in tax sheltering activities. The company already has an investment alternative which returns exceed the benefits from tax aggressiveness. Therefore, companies with high IOS have a smaller probability to practice tax aggressiveness. Based on these studies can be concluded that IOS has a positive effect on tax aggressiveness. Therefore, growing companies are more concerned with good accounting figures than tax savings. Therefore, the second hypothesis of this research is:
H2: Investment Opportunity Set is negatively associated with tax aggressiveness.
Furthermore, the company is also able to avoid tax by utilizing financial reporting aggressiveness practices. Shackelford & Shevlin (2001) found that financial reporting aggressiveness and tax aggressiveness are two mutually trade-off decisions. The study was then supported by Erickson et al. (2014). If the company raises the profits, then the tax will be increase whereas if the company decreases profit then the tax will automatically decrease. However, Frank et al. (2009) found that tax aggressiveness and aggressiveness of financial reporting can be conducted within the same period, so there is no trade-off between the decision. This is allegedly due to the increasing number of tax loopholes, used by companies due to differences (nonconformity) between accrual accounting principles and tax principles. Therefore, it is expected that there is a positive association between aggressive financial reporting to tax aggressiveness, so the third hypothesis in this study is:
H3: Financial reporting aggressiveness is positively associated with tax aggressiveness.
The objects of this study are secondary data, such as financial statements of manufacturing companies obtained from the Indonesia Stock Exchange (IDX) from 2011 to 2015. This study employs the manufacturing sector companies as the object of research because the manufacturing sector is the most dominant sector in IDX as well as requires great funding and has a great investment opportunity. Thus, it is relevant with the research variables, specifically financial constraints and investment opportunity set. Moreover, the manufacturing sector also has a large discretional accruals in its financial statements to support financial reporting aggressiveness variable.
Sampling was conducted by purposive sampling which is part of non-probability sampling method, that sample selection is not random with specific criteria. Criteria used in the selection of this study as samples are the company is engaged in the manufacturing sector, the company is listed on BEI prior to January 1, 2011, the company has complete data, related to the variables of this study from 2011 to 2015.
The dependent variable in this research is tax aggressiveness, whereas independent variables are financial constraints, investment opportunity set, and financial reporting aggressiveness. Control variables used in this research are profitability, inventory intensity, and firm size. The proxy of these variables is as follow:
Tax Aggressiveness
Tax aggressiveness in this research uses Lim (2011) proxy who used discretionary accrual to separate components of book-tax different caused by earnings management for tax purposes. The procedure for calculating tax aggressiveness by Lim (2011) uses two steps. The first step is to estimate the discretionary accrual, by searching for total accrual. Total accrual is calculated by:
TACCit = NIit - CFOit
The total accrual for each company and each year is regressed using the formula from Dechow et al. (1995) to obtain residuals that are discretionary accruals.
TACCit / TAit-1 = α1 + β1 ((ΔREVit - ΔRECit)/ TAit-1) + β2 (PPEit / TAit-1) + eit
Where:
TACCit = Total accruals of firm i in year t, i.e. difference between earnings before extraordinary items and discontinued operations with cash flow from operations.
NIit= Net profit of company I in year t
CFO = cash inflows operating on firm I year t
ΔREVit = change of company earnings i in year t with t-1
ΔRECit = change of account receivable of company i in year t with t-1
PPEit= Gross fixed assets of company i in year t
eit = the residual value of firm i in year t
Residual value or eit of the above equation is discretionary accrual (DACCit) and will be included in the next step. Residual value is obtained from the regression results of the cross-section each year in manufacturing industry because there could be differences in results in different years due to changes in the industry conditions and policies in that current year.
The second step, separating book tax different components caused by earnings management for tax purposes to identify these components as tax avoidance. Performed by doing OLS regression on the equation as follows:
BTDit = b1 DACCit + Ui + eit
Where:
BTDit = Book-Tax Difference company i in year t scaled by the lagged asset.
BTD = Commercial profit – Tax Expense / Tax rate
DACCit = Discretionary accrual company i in year t scaled by lagged asset
Ui = average value of residual of company i
eit = deviation from average residual Ui company i in year t
Tax Aggressiveness (TAGit) in the company (i) in year (t) obtained by summing Ui with eit. The proxy of financial constraints in this study employs Whited & Wu (2006) indices, as has also been used by Chen & Lai (2012) and Edwards et al. (2013). Measurement of the level of financial constraints experienced by a company can be measured using the formula in the WW index as follows:
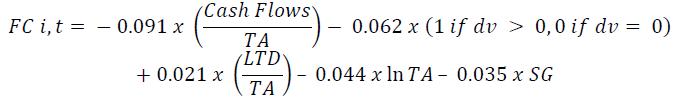
Where:
TA = Total Assett
dv= Dividend paidt
LTD = Total Long Term Debtt
SG (Sales Growth) = (Salest - Salest-1) / Salest-1
Where the greater score of FC, it will show the higher level of financial constraints experienced by the company.
Proxies for describing the size of a company's IOS are so diverse that it allows some researchers to use various ratios as IOS proxies. Some researchers mostly use IOS variable ratios in the form of single ratios. However, some other researchers used a composite or combined measurement approach that was considered to be better in measuring IOS variables. The combined size proxy will reduce errors in measurements, since a single proxy may cause measurement and classification errors because IOS can not be observed and measured by single proxy (Kallapur & Trombley, 2001). Therefore, this study employs a composite measurement approach, which combines five variables of IOS proxy which is widely used by previous researchers as follows:
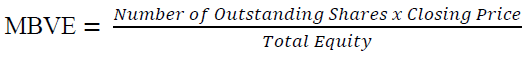
1. Market to book value of equity (MBVE)
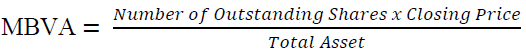
2. Market to book value of assets (MBVA)
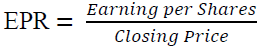
3. Earning to price ratio (EPR)
4. The ratio of capital expenditure to book value of the asset (CAPBVA)

5. Ratio of capital expenditure to market value of assets (CAMVA)

As Gaver & Gaver (1993), all the above IOS ratios will be reduced by using factor analysis to obtain a factor score representing IOS variables. Variables used are variables that have a significant correlation. From general factor formed by the analysis of these factors, only the factors that have eigenvalues more than one are used (Hair et al., 2010). Elements that have such eigenvalues are fit to represent the entire variables. If the resulting factor is more than one then to form an IOS score, the value of each element will be summed together. Scores generated from this factor analysis will be included in the regression equation. The process of factor analysis includes the following:
Conduct KMO Testing and MSA Measurement
Further analysis is conducted using the Bartlett Test of Sphericity method and measurement of MSA (Measure of Sampling Adequacy). The value of KMO is used to determine whether factor analysis is used or not in the data held. A good KMO score is more than 0.50.
KMO and Bartlett's test value is 0.507 with a significance of 0.000. The result suggests that the value is above 0.5 with the significance of 0.000 (0,000 <0.05) then the variables can be analyzed further (Table 1).
| Table 1 KMO and Bartlett’s Test Result | ||
| Kaiser-Meyer-Olkin Measure of Sampling Adequacy. | 0.507 | |
| Bartlett's Test of Sphericity | Approx. Chi-Square | 958.292 |
| Df | 10 | |
| Sig. | 0.000 | |
Based on the above Table 2 MSA results, MBVE, MBVA, and CAPBVA variables can be analyzed further because each variable has MSA value greater than 0.5. However, MSA values for EPR and CAPMVA variables are below 0.5. Therefore the two variables are excluded from further analysis.
| Table 2 Anti-Image Matrices Result | ||||||
| MBVE | MBVA | EPR | CAPBVA | CAPMVA | ||
| Anti-image Covariance | MBVE | 0.148 | -0.134 | 0.021 | -0.001 | -0.017 |
| MBVA | -0.134 | 0.145 | -0.023 | -0.032 | 0.042 | |
| EPR | 0.021 | -0.023 | 0.969 | -0.044 | 0.133 | |
| CAPBVA | -0.001 | -0.032 | -0.044 | 0.785 | -0.340 | |
| CAPMVA | -0.017 | 0.042 | 0.133 | -0.340 | 0.779 | |
| Anti-image Correlation | MBVE | 0.511a | -0.918 | 0.055 | -0.002 | -0.050 |
| MBVA | -0.918 | 0.508a | -0.062 | -0.094 | 0.126 | |
| EPR | 0.055 | -0.062 | 0.465a | -0.050 | 0.153 | |
| CAPBVA | -0.002 | -0.094 | -0.050 | 0.527a | -0.435 | |
| CAPMVA | -0.050 | 0.126 | 0.153 | -0.435 | 0.473a | |
Factoring
Once some eligible variables are obtained, the further process is the core process of factor analysis namely factoring; a process of extracting variables that previously have passed the test. Component ranges from 1 to 3 representing the number of independent variables. The table below Table 3 shows that only one element appears with eigenvalues above 1, so factoring stops on one factor only.
| Table 3 Total Variance Explained Result | ||||||
| Component | Initial Eigenvalues | Extraction Sums of Squared Loadings | ||||
| Total | % of Variance | Cumulative % | Total | % of Variance | Cumulative % | |
| 1 | 1.984 | 66.128 | 66.128 | 1.984 | 66.128 | 66.128 |
| 2 | .939 | 31.294 | 97.422 | |||
| 3 | .077 | 2.578 | 100.000 | |||
| Extraction Method: Principal Component Analysis. | ||||||
Component matrix Table 4 is a matrix that contains component loaded from all proxies, on all selected component models. By looking at this matrix component, it can be seen the relation of each proxy to its component.
| Table 4 Component Matrix | |
| MBVE | 0.966 |
| MBVA | 0.967 |
| CAPBVA | 0.341 |
| Extraction Method: Principal Component Analysis. | |
For factor rotation, no rotation appears because the rotation process requires at least two factors. After factor formed and validated, it is stated that one factor can be conducted to provide score factor for Investment Opportunity Set (IOS) variable, and it could be included in the regression of this research model (Table 5).
| Table 5 Rotated Component Matrixa |
| Only one component was extracted. |
| The solution cannot be rotated. |
Financial Reporting Aggressiveness
In this study, aggressive financial reporting follows Jaggi et al. (2009). The calculation steps are as follows:
Calculating Total Accrual

Incorporating Coefficients Generated From Previous Calculations to Predict NDA

Detecting Total Discretionary Accruals

Where:
TACCit = Total accruals for firm i in year t, i.e., net profit before extraordinary items and discontinued operations plus depreciation and amortization minus cash flows from operating activities.
TAit-1 = total asset of the previous year
ΔREVit = Change of company earnings i in year t with t-1
ΔRECit = Change of account receivable of company i in year t with t-1
PPEt = Fixed assets of company i in year t
NDAit = Nondiscretionary accruals value company i in year t
TDAit = Total discretionary accruals value company i in year t
The value of TDAit represents a variable of Financial Reporting Aggressiveness and will be included in the regression of this research model as FRAit. TDAit is obtained from residual value of the regression results of the cross-section each year in manufacturing industry because there could be differences in results in different years due to changes in the industry conditions and policies in that current year.
This research employs three control variables, e.g., profitability, inventory intensity, and company size. Profitability is a measure to assess the efficiency of capital used in a company by comparing it with operating profit achieved. This study follows the measurement of firm characteristics by Taylor and Richardson (2012) using return on assets (ROA) to control a company's performance & exclude certain consequences of tax avoidance. ROA is calculated from pre-tax profit divided by total assets.
Inventory intensity describes the behavior of firms regarding the recognition of inventories in the tax year. INVINT negatively associates with tax aggressiveness through the recognition of inventories in the current year (Taylor & Richardson, 2012). INVINT is measured by dividing inventory by total assets.
Company size variable is used to control the effects of the economic scale. The larger the size of the company, they will have a growing business activity and financial transactions that provide various opportunities for tax aggressiveness (Taylor & Richardson, 2012). In this study, firm size (SIZE) is measured by natural logarithm (ln) of total assets. The research model in this study is as follows:

Abbreviations:
TAGi,t = Tax Aggressiveness company i in year t
FCi, = Financial Constraints company i in year t
IOSi,t = Investment Opportunity Set company i in year t
FRAi,t = Financial Reporting Aggressiveness company i in year t
ROAi,t = Return on Asset ratio company i in year t
INVINTi,t = Inventory Intensity ratio company i in year t
SIZEi,t = Natural logarithm from total asset company i in year t
? = Error
β = Constants
Results and Discussion
Data used in this study is all financial data of manufacturing companies listed on the Indonesia Stock Exchange, with the sample selection criteria (Table 6).
| Table 6 Selection Process of Research Samples | ||
| Criteria | Total | Measurement |
| the company is engaged in the manufacturing sector | 147 | Firm |
| companies listed on BEI before January 1, 2011 | (21) | Firm |
| the company has incomplete data | (8) | Firm |
| the company uses currencies other than rupiah | (27) | Firm |
| Total Sample | 88 | Firm |
| Year | 5 | Year |
| Observation | 440 | Firm-Years |
This statistical analysis is used to see the full picture of how the data observed is distributed using mean, maximum, minimum, and standard deviation. A descriptive statistical summary is shown in Table 7 below.
| Table 7 Statistical Descriptive | |||||
| Mean | Median | Maximum | Minimum | Std. Dev. | |
| TAG | 5.5 x 10⁻¹⁸ | 0.00182 | 0.29320 | -0.24150 | 0.05303 |
| FC | -0.58344 | -0.61833 | 1.91584 | -0.81627 | 0.27600 |
| IOS | 2.27 x 10⁻⁸ | -0.33283 | 8.80482 | -1.22263 | 1.00000 |
| FRA | 0.030745 | 0.02534 | 0.86717 | -0.54261 | 0.10830 |
| ROA | 0.062783 | 0.04523 | 0.42677 | -0.27917 | 0.09477 |
| INVINT | 0.216682 | 0.18652 | 0.71683 | 0.00303 | 0.13116 |
| SIZE | 28.09735 | 27.89205 | 33.13405 | 25.19398 | 1.60397 |
Furthermore, to conduct multicollinearity tests, the method is conducted by analyzing the correlation matrix between independent variables. The summary of the correlation test between variables in this study as Table 8.
| Table 8 The Correlation Test | |||||||
| TAG | FC | IOS | FRA | ROA | INVINT | SIZE | |
| TAG | 1.00000 | -0.07741 | 0.07316 | -0.00867 | 0.43735 | -0.08853 | -0.06588 |
| FC | -0.07741 | 1.00000 | -0.05647 | 0.00302 | -0.13938 | -0.13640 | 0.30876 |
| IOS | 0.07316 | -0.05647 | 1.00000 | -0.03125 | 0.69663 | -0.00875 | 0.41726 |
| FRA | -0.00867 | 0.00302 | -0.03125 | 1.00000 | 0.12996 | 0.10151 | -0.00100 |
| ROA | 0.43735 | -0.13938 | 0.69663 | 0.12996 | 1.00000 | 0.02531 | 0.24712 |
| INVINT | -0.08853 | -0.13640 | -0.00875 | 0.10151 | 0.02531 | 1.00000 | -0.10946 |
| SIZE | -0.06588 | 0.30876 | 0.41726 | -0.00100 | 0.24712 | -0.10946 | 1.00000 |
From the table above, there is no correlation between each other variables because there are no variables that have a correlation value of more than 0.9, so each value of proxies is considered different from others. Thus, all independent variables can be examined on the dependent variable.
Hypothesis Examining
To estimate a regression model with panel data, this study uses Ordinary Least Square (OLS) model, Fixed Effect Model (FEM), or Random Effect Model (REM). Selection of model in this research is conducted based on examination of regression method of panel data consist of three test, e.g., chow test, Hausmann test, and Lagrange multiplier test. Based on test it was decided that the most appropriate panel data regression model to be used in this research is a fixed effect model. Table 9 suggests that the regression result, as follows:
| Table 9 Regressiontest Result | |||
| Variable | Coefficient | T-statistic | Prob. |
| FC | 0.0075 | 2.40088 | 0.0085*** |
| IOS | -0.0116 | -2.14607 | 0.0163** |
| FRA | -0.0612 | -5.51499 | 0.0000*** |
| ROA | 0.7126 | 18.35758 | 0.0000*** |
| INVINT | -0.0863 | -3.63140 | 0.0000*** |
| SIZE | 0.0175 | 3.63140 | 0.0001*** |
| R-squared | 0.91068 | ||
| Adjusted R-squared | 0.88667 | ||
| F-Stat | 37.9326 | ||
| Prob(F-Stat) | 0.0000 | ||
The Effect of Financial Constraints on Tax Aggressiveness
This study suggests that that financial constraints of the company are positively associated with tax aggressiveness. This study proves an indication that internal funding sources of the company in financial constraints could be conducted through the practice of tax aggressiveness. By engaging in aggressive tax avoidance practices, companies with limited financing will save more cash efficiently and then the company will use austerity cash to help companies solve underinvestment problems experienced by financially constrained companies. This study is in line with Chen & Lai (2012); Edwards et al. (2016); Law & Mills (2014) and Akamah et al. (2016) who concluded that companies experiencing financial constraints are more aggressive in tax avoidance than firms with no financing limitations.
Companies experiencing limited funding will consider increasing internal funding sources through tax management. Companies that are financially constrained will seek to increase internal funding sources through a variety of ways. Most cost-saving options, such as reducing advertising costs, research and development, capital expenditure, or labor costs can often negatively impact on long-term corporate performance. However, savings through tax deductions paid will not have a negative impact on long-term corporate performance with the assumption that the company will not get a fine or sanction due to the tax strategy. Cash savings on tax payments are important as a source of internal funding to be used as a cash flow operating company. The strategy used to make savings is to delay the recognition of income and accelerate the recognition of expenses.
This study concludes that companies will tend to conduct tax aggressiveness when companies experience financial constraint. Thus, the companies require additional funding. In addition to the withholding of tax payments, retained earnings are one of the most important internal funding sources to finance corporate growth. If the company chooses to distribute profits as dividends, it will reduce retained earnings and subsequently reduce total internal funding or internal financing resources.
The Effect of Investment Opportunity Set on Tax Aggressiveness
The result of the study suggests that the investment opportunity set is negatively associated with tax aggressiveness. This study is relevant wth Rubai (2009) who found that IOS has a positive effect on corporate tax burden (ETR). However, this result of the study is different form Handayani (2013). Handayani argued that differences could occur due to differences in years of research with Rubai (2009), where there has been a change in corporate tax rates. However, this study uses longer period years of research than Handayani (2013). Therefore, it can be indicated that another possibility why IOS is not influential against tax aggressiveness.
Companies with high IOS are more likely to use internal funding so that the return on investment will maximize shareholder value (Jaggi & Gul, 1999). Therefore, companies with high IOS will be more likely to optimize their investment by using less debt. The company will lose the opportunity to save on its tax burden through interest expense. While interest on the debt as a tax deduction should be an incentive for a company in conducting tax aggressiveness (Cheng et al., 2012). Growing companies are more concerned with good accounting figures than tax savings. Companies with high IOS attempt to take more advantage of investment opportunities and try to obtain a big profit from the investment. Also, the result of this study also supports McGuire et al. (2014) research which explained that companies with many investment alternatives in the future would invest less in tax sheltering activity. The company already has investment alternatives which return exceed the benefits of tax aggressiveness. Therefore, companies with high IOS have a smaller probability to practice tax aggressiveness. Companies with high investment opportunity set are growing companies, and tend to be large companies. In the meantime, larger companies tend to get considerable attention and oversight from tax authorities. Therefore, companies with high IOS will have a higher probability of detection in the case of a tax audit. The companies with high IOS tend to be less aggressive in tax reporting because they have a higher risk of sanctions and tax audit penalties when compared to other companies with low IOS.
The Effect of Financial Reporting Aggressiveness on Tax Aggressiveness
The result of the study suggests financial reporting aggressive is negatively associated with tax aggressiveness. The company can not engage in tax aggressiveness while engaging in financial reporting aggressiveness by increasing profits. This kind of relationship indicates a trade-off in decisions for financial reporting aggressiveness and tax aggressiveness. The result of this study is also different to Kamila & Martani (2014) and Ridha & Martani (2014) who used Indonesia data as well. The result of this study is relevant with Shackelford & Shevlin (2001) who conducted review literature on tax research in accounting. The study found that financial reporting aggressiveness and tax aggressiveness are two mutually trade-off decisions. The study is later supported by Erickson et al. (2004) with the same result. Ideally, aggressive financial reporting cannot be conducted simultaneously with tax aggressiveness. In other words, a trade-off occurs because tax aggressiveness is an activity that lowers earnings while aggressive financial reporting is an activity that tends to increase profit. Both of these activities cannot be done simultaneously. In Indonesia, research with similar result has also been conducted by Geraldina (2013) which also stated that aggressive financial reporting has a significant negative effect on tax aggressiveness.
This study does not support Frank et al. (2009) who found that tax aggressiveness and financial reporting aggressiveness can be conducted in the same period, so there is no trade-off between the decisions. This is allegedly due to the increasing number of tax loopholes utilized by companies because of differences (nonconformity) between accrual accounting principles and taxation regulations (Frank et al., 2009; Hanlon & Heitzman, 2010). In the United States, it is indicated by the growing book-tax difference or the difference between earnings in financial statements and taxable income (Hanlon & Shevlin, 2005). The amount of book-tax difference indicates the occurrence of aggressiveness of financial and tax reporting simultaneously.
The result of this study suggests that the practice of aggressive financial reporting by using accrual discretion decreases the possibility of companies engaged in tax aggressiveness activities. In other words, there is a trade-off in tax planning between minimizing tax payments by reporting low profits. Companies tend to choose accounting methods and estimates that minimize profits to minimize taxpayer reporting. Many financial contracts with third parties such as regulators, creditors, suppliers, managers, and other stakeholders use accounting figures as terms of trade, affecting managers to report lower profits. Therefore, various options in accounting, finance, marketing, and other business functions are used as a considered element in a trade-off that occurs between incentives to financial reporting aggressiveness and incentives to tax aggressiveness. Contractual pressure with the creditor is the most likely pressure that occurs. Interest payments substitute tax payments, so companies use less aggressive financial reporting to lower tax payments. Also, contractual pressures with regulators may also occur because firms with high profits tend to be growing companies, which are firms with higher supervision by the tax authorities. Therefore, to reduce the probability of detection from tax authorities, the company becomes less aggressive in its financial reporting.
Control Variables
Based on the results of testing the hypothesis, it is known that profitability (ROA) and company size are positively associated with tax aggressiveness. The results of this study are in line with Taylor & Richardson (2012). Of all the variables tested against tax aggressiveness, profitability has a high degree of influence in the activity of tax aggressiveness. The behavior of manufacturing companies in Indonesia that have high-profit rates tends to conduct increasingly tax aggressiveness.
Furthermore, companies are negatively associated with tax aggressiveness. The result of the study is different from Taylor & Richardson (2012) who found that inventory capacity does not affect tax aggressiveness. Manufacturing companies in Indonesia that have high inventory capacity levels tend to avoid tax aggressiveness. If it is associated with profitability, this study concludes that companies that succeed in selling their inventory in large capacity will obtain high profits. This condition triggers companies to carry out tax aggressiveness, but conversely, if the company saves more inventory, it is considered to have low profits or even losses, so that the provisions of the tax rules are actually followed by manufacturing companies.
Conclusion
This study concludes that there is a direct in-line relationship between the level of financial constraints with tax aggressiveness. The companies experiencing limited funding would consider conducting tax aggressiveness. Secondly, there is an inverse relationship between investment opportunities set with tax aggressiveness. The company is more likely to optimize their investment tend to apply tax aggressiveness. Thirdly, financial reporting aggressiveness is not a factor for management to conduct tax aggressiveness. Financial reporting aggressiveness and tax aggressiveness are two mutually trade-off decisions because tax aggressiveness is an activity that lowers earnings while aggressive financial reporting is an activity that tends to increase profit.
Based on the findings, this study recommends for Indonesia Tax Authority to regulate policies related to special training for Indonesia tax office employees who tied up with an account representative and tax audit. By analyzing the financial statements of the company, then the company with high financial constraints condition needs to get more attention as an early warning for them. Furthermore, Indonesia Tax Authority needs to continue intensifying the examination of annual income tax returns with the status of loss no more pays.
This study still has limitations. Data in this study only employs manufacturing companies listed on the Indonesia Stock Exchange during from 2011 to 2015. The results of this study may be different when using research data from other sectors, different developing countries, different periods. Furthermore, tax aggressiveness measurement in this study only uses BTD discretionary accrual proxy as Lim (2011). The study has not used the measurement of tax aggressiveness with other proxies, so the results cannot be compared. The results may vary in different tax aggressiveness proxies are used.
For future studies could use samples instead of the manufacturing sector, to be able to obtain and complete the figures of tax aggressiveness in various industries or use all sectors of companies listed on the Stock Exchange so that the results obtained can be implied to the company as a whole. Also, financial reporting aggressiveness discussed in this study is limited in earnings management with accrual discretion so that in the future studies could use real earnings management or Beneish model (1999) as financial reporting aggressiveness proxies.
References
- Adam, T., & Goyal, V.K. (2008). The investment opportunity set and its proxy variables. The Journal of Financial Research, 31(1), 41 -63
- Akamah, H., Omer, T., & Shu, S.Q. (2016). Financial constraints, cash tax savings, and tax outcome variability. Univesity of Nebraska & San Diego State University, Working Paper
- Bank Indonesia (2009). Indonesian Economic Outlook 2009-2014: Global Financial Crisis and Its Impact on the Indonesian Economy. Retrieved from https://www.academia.edu/30955133/Outlook_Ekonomi_Indonesia
- Beneish, M.D. (1999). The detection of earnings manipulation. Financial Analysts Journal, 55(5), 24-36.
- Chen, C., & Lai, S. (2012). Financial constraints and tax aggressiveness. Univesity of Auckland and Chinese University of Hong Kong, Working Paper.
- Chen, S., Chen, X., Cheng, Q., & Shevlin, T. (2010). Are family firms more tax aggressive than non-family firms? Journal of Financial Economics 95, 41–61
- Cheng, C.S.A., Huang, H.H., Li, Y., & Stanfield, J. (2012). The effect of hedge fund activism on corporate tax avoidance. The Accounting Review, 87 (5), 1493-1526
- Dechow, P.M., Sloan, R.G., & Sweeney, A.P. (1995). Detecting earning management. The Accounting Review, 70 (2), 193-225.
- Desai, M.A., & Dharmapala, D. (2006). Corporate tax avoidance and high-powered incentives. Journal of Financial Economics, 79, 145–179.
- Edwards, A., Schwab, C., & Shevlin, T. (2013). Financial constraints and the incentive for tax planning. The university of Toronto, University of Georgia, & University of California at Irvine, Working Paper
- Edwards, A., Schwab, C., & Shevlin, T. (2016). Financial constraints and cash tax savings. The Accounting Review, 91(3), 859-881
- Erickson, M., Hanlon, M., & Maydew, E.L. (2004). How much will firms pay for earnings that do not exist? evidence of taxes paid on allegedly fraudulent earnings. The Accounting Review, 79(2), 387-408.
- Fazzari, S.M., Hubbard, G.R., & Petersen, B.C. (1988). Financing constraints and corporate investment. Brookings Papers on Economic Activity, 1, 14-195
- Frank, M.M., Lynch, L.J., & Rego, S.O. (2009). Tax reporting aggressiveness and its relation to aggressive financial reporting. The Accounting Review, 84(2), 467-496
- Gaver, J.J., & Gaver, K.M. (1993). Additional evidence on the association between the investment opportunity set and corporate financing, dividend, and compensation policies. Journal of Accounting and Economics, 16, 125-160
- Geraldina, I. (2013). Accrual earnings management preferences or real earnings management in tax shelter activities. Indonesian Journal of Accounting and Finance , 10 (2), 206-224.
- Hair, J.F., Black, W.C., Babin, B.J., & Anderson, R.E.(2013). Multivariate data analysis seventth edition. New Jersey: Pearson Education Inc.
- Handayani, D. (2013). Effects of managerial skills, investment opportunity sets and government ownership on effective tax rates. Journal of Financial and Business Accounting, 6, 26 - 35.
- Hanlon, M., & Heitzman, S. (2010). A review of tax research. Journal of Accounting and Economics, 50, 127–178.
- Hanlon, M., & Shevlin, T. (2005). Book-tax conformity for corporate income: An introduction to the issues. Tax Policy and the Economy, 19, 101-134.
- Hanlon, M., & Slemrod, J. (2009). What does tax aggressiveness signal? Evidence from stock price reactions to news about tax aggressiveness. Journal of Public Economics, 93, 126-141.
- Healy, P., & Wahlen, J. (1999). A review of the earning management literature and its implications for standard setting. Accounting Horizon, 13(4), 365-383.
- Hidayanti, A. (2013). The influence between family ownership and corporate governance on tax aggressive actions. Thesis. Diponegoro University's Faculty of Economics and Business.
- International Monetary Fund (2016). World Economic Outlook Database. Retrieved from https://www.imf.org/external/pubs/ft/weo/2016/02/weodata/index.aspx
- Jaggi, B., & Gul, F. (1999). An analysis of joint effects of investment opportunity set, free cash flows and size on corporate debt policy. Review of Quantitative Finance and Accounting , 12, 371-381
- Jaggi, B., Leung, S., & Gul, F. (2009). Family control, board independence and earning management: evidence based on Hong Kong Firms. Journal of Accounting and Public Policy, 28(4), 281-300
- Jensen, M.C., & Meckling, W.H. (1976). Theory of the firm: Managerial behavior, agency costs and ownership structure. Journal of Financial Economics, 3(4), 305-360.
- Jones, J.J. (1991). Earnings management during import relief investigations. Journal of Accounting Research, 29(2), 193-228.
- Kallapur, S., & Trombley, M., (2001). The investment opportunity set: Determinants, consequences and measurement. Managerial Finance, 27, 3-15.
- Kamila, P.A., & Martani, D. (2014). Analysis of the relationship of financial reporting aggressiveness and tax aggressiveness. Journal of Finance and Banking, 16(2), 228-245.
- Kaplan, S., & Zingales, L. (1997). Do investment cash flow sensitives provide useful measure of financing constraints? Quarterly Journal of Economics 112(1), 169-215.
- Law, K., & Mills, L. (2014). Taxes and financial constraints: Evidence from linguistic cues. Tilburg University & The University of Texas, Working Paper
- Lim, Y. (2011). Tax avoidance, cost of debt and shareholder activism: Evidence from Korea. Journal of Banking and Finance, 35, 456-470.
- Christensen, J., & Kapoorii, S. (2005). Tax avoidance, tax competition and globalization: Making tax justice a focus for global activism. Accountancy Business and the Public Interest, 3(2), 1-13.
- McGuire, S.T., Omer, T.C., & Wilde, J.H. (2014). Investment opportunity sets, operating uncertainty, and capital market pressure: Determinants of investments in tax shelter activities? The Journal of American Taxation Association, 36 (1), 1 -26.
- Myers, S.C. (1977). Determinants of corporate borrowing. Journal of Financial Economics, 5, 145-175.
- Ridha, M., & Martani, D. (2014). Analysis of tax aggressiveness, aggressive financial reporting, family ownership, and corporate governance in Indonesia. National Symposium on Accounting XVII. Mataram. 1–22.
- Rubai, A. (2009). Effect of Managerial Skills and Investment Opportunities (IOS) Sets on Effective Tax Rates. Thesis. Yogyakarta: Gadjah Mada University.
- Scott, W.R., (2015). Financial Accounting Theory, (7th edition). Pearson Canada Inc.
- Shackelford, D., & Shevlin, T. (2001). Empirical tax research in accounting. Journal of Accounting and Economics 31 (1-3), 321–387.
- Smith Jr., C.W., & Watts, R.L., (1986). The investment opportunity set and corporate policy choices. University of Rochester Library.
- Taylor, G., & Richardson, G. (2012). International Corporate Tax Avoidance Practices: Evidence from Australian Firms. The International Journal of Accounting , 47, 469 -496.
- Watts, R., & Zimmerman, J. (1990). Positive accounting theory: A ten year perspective. The Accounting Review, 65(1), 131-156.
- Whited, T., & Wu, G. (2006). Financial Constraints Risk. Review of Financial Studies, 19(2), 531-559.