Research Article: 2017 Vol: 20 Issue: 1
Financial Implications of Seasonal Variability in Demand for Tourism Services
Clement A Tisdell, University of Queensland
Abstract
Background information is provided on seasonal variability of tourism demand giving examples of within year fluctuations in prices for tourism services. Existing views about the economic (financial) effects on businesses of this variability are outlined. Reasons why the theory outlined here is an important contribution to the literature are given. Using Jensen’s inequality (and its mathematical generalization), this contribution shows how increased seasonal (periodic) variability of demand for tourism services can increase the annual profit of a tourism enterprise and the producers’ surplus of a corresponding competitive segment of the tourism industry experiencing this increased variability. These financial consequences are at odds with those usually assumed in the tourism literature and support a different set of policy conclusions. Conditions are identified which result in these effects being magnified and account is taken of the fact that a tourism business’ supply of services is often subject to capacity utilization constraints. A novel feature is that allowance is made in the theory for the possibility that variations in the market demand for tourism services may alter the prices of factors of production.
Keywords
Demand Variability, Jensen’s Inequality, Price Instability in Tourism, Profitability in Tourism and Demand Variability, Producers’ Surplus and Demand Variability.
JEL Classifications
C02; D20; D41; L83
Introduction
The demand for many tourism services alters throughout the year mainly due to changing seasons and variations in the pattern of public holidays. As a result, the extent to which tourism services are utilized normally varies throughout the year and affects the annual profits of tourism enterprises. In the low season, they often find that they have considerable excess capacity whereas in the high season their capacity is fully utilized. Koenig-Lewis and Bischoff (2005) point out that “seasonal demand variations represent a central theme not only in the academic literature on tourism, but also in the domains of policy-making and practical tourism management”. An interesting question is: Would the annual profits of a tourism business (and the corresponding segment of the tourism industry) be increased by reducing the variability of demand for its services? It will be shown that this may actually reduce the firm’s profits and the economic surplus of the corresponding segment of the tourism industry. This is an important financial result because most of the available academic literature assumes that it is desirable to reduce variability in the seasonal demand for tourism services in order to increase the profits of tourism enterprises and the financial returns of segments of the industry experiencing this seasonality.
This major result is demonstrated by adapting the findings of Walter Oi (1961) to this case and mathematically extending his results by making use of Jensen’s inequality (Jensen, 1906; Anon, 2016) and its generalization presented by Hardy, Littlewood & Polya, (1934, theorem). The generalization by Hardy, Littlewood & Polya (1934) covers the extension of Jensen’s inequality by Karamata (1932). A purely (perfectly) competitive economic model is assumed of the standard type first developed by Alfred Marshall (1890). After providing some empirical background on the importance of seasonal variability of tourism and pointing out why the theory outlined here is of considerable significance (given widely expressed views in the relevant literature), a diagrammatic exposition (similar to that used by Oi) is employed to show how known seasonal variations in the demand for tourism services add to focal enterprises’ annual profit and the producers’ economic surplus in the corresponding segment of the tourism industry experiencing these fluctuations compared to a stationary level of demand throughout the year. The mathematical generalization of this result follows. Subsequently, attention is given to how capacity considerations might influence the results. This is followed by a discussion of the findings, paying attention to qualifications and ways in which the analysis might be extended. Of course, seasonal fluctuations in tourism have socio-economic implications well beyond the type of financial implications considered here (Koenig-Lewis and Bischoff, 2005) but only the type of financial effects mentioned above will be considered here.
Background and Examples
Relatively regular patterns of variation in the demand for tourism services during the year are usually reflected in corresponding fluctuations in the prices of these services and often in the extent to which the capacity of tourism facilities are utilized. In addition to these seasonal variations, ‘peak-load’ pricing may occur during the week, for example, at some holiday resorts for accommodation bookings for Saturday nights and during long weekends.
Frequently, (in response to changing market supply and demand conditions) prices for tourism services are differentiated according to whether they are for the high, low or the shoulder season. However, each of these periods is not necessarily continuous; each may consist of several sub-periods occurring at different times of the year. Alterations in demand for tourism services during the year depend on such factors as seasonal weather patterns, the occurrence of community-wide vacation periods (such as the pattern of school holidays), religious festivals and observances (religious tourism), special events and so on. Global differences occur in these patterns. For example, ‘long’ vacation periods occur in the Northern Hemisphere in its summer but about six months later in the Southern Hemisphere when it is summer there. Consequently, when the price of tourism services is at a high point in the European summer, they are around their lowest point in Australia. Regional differences in seasonal patterns of demand can also occur within individual countries and this can result in regional within-year differences in pricing patterns.
It is worthwhile considering some Australian examples of seasonal changes in prices of tourism services. Examples follow for return airline fares between Los Angeles and Australia and for tourist accommodation at Noosa (a popular beach resort) on the Sunshine Coast of Queensland. The prices quoted should be regarded only as indicative of disparities. However, they demonstrate that these disparities can be considerable. For 2016, the standard published economy air fare from Los Angeles to Sydney was reported to be in the low season US $2000 including tax, US $2200 in the shoulder season and US $2700 in the peak season but the seasonality dates for Qantas, Virgin Australia and Air New Zealand are broader, broken in to several sub-periods except for the peak season, 11 December through to 31 January (About Australia, undated). Breakaway Travel Club Australia (2016) also reported a similar pattern of industry fares for flights by Virgin Australia from Los Angeles to Sydney, Brisbane or Melbourne return. These fares are restricted to personnel associated with the tourism industry. For example, the economy fare (inclusive of taxes) for the low season was US $1340, for the shoulder season US $1529 and for the high season US $1697.
Now consider examples of seasonal variability in prices for tourist accommodation in the Noosa area. The Royal Automobile Club of Victoria operates the RACV Noosa Resort and a sample of its indicative accommodation rates for the period July 1, 2016 to June 23, 2017 are given in Table 1. Rates differ depending on whether the client is a member of the RACV (including other specified clubs) or a non-member. Because the pattern of seasonal differences is similar for members and non-members, only daily rates for non-members are shown in Table 1 along with the percentage difference between the low and the peak season per diem rate. The seasonal differences in these rates are moderate compared to those for accommodation close to Noosa beach. For example, Sea haven Beachfront Apartments quoted, on 16 August, 2016, a rate of AUD540 for a 1 bedroom beachfront apartment for 27 August, 2016 and for 7 January, 2017, AUD840 and the hotel Sofitel Noosa quoted for the same dates, AUD505 and AUD925, respectively for a superior room with two double beds and a pool view. These are samples of respective rates in the low and the high season for this accommodation. The percentage excess of the high season rate over the low season rates for these businesses are respectively 56 and 83 and the difference is therefore, quite substantial.
| Table 1: Indicative Daily Accommodation Rates In Australian Dollars At The Racv Noosa Resort For The Period July 1, 2016 To June 23, 2017.(Royal Automobile Club Of Victoria, 2016) | |||||
| Type of Apartment | Low Season | Shoulder Season | High Season | Peak Season | % Excess of Peak over Low(a) |
|---|---|---|---|---|---|
| 1.Bedroom Resort | 287 | 313 | 367 | 417 | 45 |
| 2.Bedroom Sanctuary | 325 | 352 | 405 | 455 | 40 |
| 3.Bedroom Resort | 399 | 425 | 499 | 549 | 37 |
| 4.Bedroom Sanctuary | 452 | 479 | 562 | 602 | 33 |
| 5.Bedroom Sanctuary | 519 | 545 | 619 | 669 | 29 |
Depending on the location of tourist attractions there can be major swings in the extent to which their capacity is utilized during the year. Some tourist businesses even cease operations during periods of low seasonal demand or reduce the hours or days of their opening. Regular seasonal variations in the number of bed nights for hotels in Israel are clear for example from Figure 1 in Krakover (2000). Seasonal demand for tourism is concentrated in the summer season in Alaska (Snepenger, 1990) but that is the low season in the far north of Australia (for example in the Kakadu National Park in the Northern Territory) due to the occurrence of the wet season and high humidity and heat. Seasonal differences in climate are major influences (but not the only ones) on within-year variations in tourist activity in a geographical area (Goh, 2012). A useful list of the causes of tourism seasonality is given in Koenig-Lewis and Bishchoff (2005) along with a valuable discussion of the causal factors involved and how they might change.
Literature Review
Why is the Theory Outlined Here Important?
The review by Koenig-Lewis and Bischoff (2005) points out that “the majority of the academic literature dealing with the issue of seasonality (in tourism) identifies these systematic demand fluctuations as a problem which has to be overcome or, at least, modified and reduced in effect”, particularly from an economic point of view. Jang (2004) states: “Tourism seasonality has been held responsible for difficulty in gaining access to capital for fluctuating returns on investment and for subsequent high risk of investment, primarily due to the instability of tourism services over seasons and under-or-over utilization of the same resources and facilities…”. Accordingly, great efforts should be made to mitigate troublesome seasonality in destinations through a variety of approaches.” He argues in favour of policies which (from a financial viewpoint) will help to smooth out seasonal fluctuations in seasonal tourism demand.
However, these assessments of the financial effects of seasonal tourism variability seem to be misleading and are not based on solid analysis. As shown in this exposition, seasonal tourism variability can add to the annual profit of tourism enterprises, even though it may have negative social and environmental effects.
A long and continuous low season of demand for tourism services can create cash management challenges for a tourism business because its receipts during the low season may fail to cover its on-going expenses. Even if it closes down during the low season, it will still need to meet its overhead expenses. There will be additional expenses if (as is commonly the case) it uses the low season to refurbish and renovate its facilities. Therefore, the firm will need to retain sufficient funds from periods of higher demand to meet its financial commitments during the low season or borrow funds to do so, repaying these possibly when seasonal demand is high. No allowance is made in the subsequent analysis for the possible extra financial cost which this can entail. However, this aspect does not alter the basic conclusion drawn from the subsequent analysis, because it seems highly unlikely that these costs will be of the magnitude and nature suggested by Jang (2004).
The main relevant point to keep in mind is that if it is possible to increase the demand for tourism in periods of lower demand without reducing that in higher periods of demand significantly (and this can be achieved at little cost), the firm’s profit will rise. However, this is only because overall tourist demand for the year is elevated by this action. If the increase in demand in lower periods of demand is achieved at the expense of demand in high periods, that is, by an averaging or a smoothing process, the annual profit of tourist businesses which adopt this policy will decline, given the theory outlined below.
Note that it is also quite important that the consequences of demand variability be distinguished from those of uncertainty about levels of demand. Jang (2004) suggests a portfolio diversification approach to smoothing seasonal variability in tourist demand using Markowitz’s portfolio selection approach (Markowitz, 1952), he treats instability and risk as synonymous, which is incorrect (Tisdell, 1968). In fact, little attention appears to have been given in the tourism literature to the financial consequences of seasonal risk and uncertainty in tourism.
With this background in mind, some relevant basic theory will be outlined for the first time. It will not, however be extended to take account of risk and uncertainty.
Theoretical Example of How Seasonal Variability in Demand for Tourism can Increase the Profitability of a Firm and the Economic Surplus of the Corresponding Segment of the Tourism Industry
Suppose that the segment of the tourism industry under investigation is purely competitive. Businesses operating in this segment are consequently price-takers. Furthermore, for simplicity, imagine that for half of the year there is a high level of demand for the services of this segment of the tourism industry (for example, tourist accommodation) and for the other half, there is a low level of demand for these services. Consequently, in the case shown in Figure 1(b) (in which BS represents the supply schedule) this may result in market equilibrium in the relevant segment of the industry being established at E1 during the low season and at E2, in the high season. Then the market price of services (for example, accommodation) is P1 during the low season and is P2 in the high season. Therefore, the average price of these services for the year is 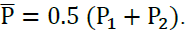 Note that the demand schedules are not shown in Figure 1(b). They can take any form and they need not shift in a parallel fashion. The relevant question is: If demand can be stabilized at
 , would the producers’ economic surplus in this segment of the tourism industry and the annual profit of enterprises operating in this segment be lower or higher than when seasonal variability of demand prevails?
Given the case illustrated in Figure 1, it can be shown that the annual profit of tourism operators rises with greater seasonal variability of demand and also producers’ surplus in the corresponding segment of the tourism industry. When the price of tourism services is , throughout the year, the annual operating profit of a representative firm is equal to twice the shaded plus the dotted area in Figure 1(a). In Figure 1(b), the annual producers’ surplus is also equal to twice the shaded area plus the dotted area. The annual profit of the representative firm rises by an amount equivalent to the hatched triangular area shown in Figure 1(a) when the price of tourism services is P1 for half the year and P2for the remainder. Producers’ surplus also increases by an amount equivalent to the hatched triangular area shown in Figure 1(b). The proof is the same for both cases so that for the representative firm need only be presented.

Figure 1: An Illustration To Show That An Increase In The Variability Of Demand For Tourism Services In A Segment Of The Tourism Industry raises the producers? economic surplus Obtained In This Segment And The Profitability Of Firms Operating In This Segment. Note That The Horizontal Scale Of Figure 1(b) Is Compressed Compared To That Of Figure 1(a).
In the low season (when price is P1), the profit of the representative firm is below that when price is stabilized at by an amount equivalent to the dotted area in Figure 1(a). On the other hand, when price is P2, profit in the high season exceeds that when price is stationary throughout the year by an amount equal to the sum of the flecked area plus the hatched area. The flecked area is the mirror image of the dotted area. Hence, the increase in annual profit of the firm as a result of seasonal variability in demand for its services is equivalent to the hatched area. Furthermore, as the difference in demand between seasons increases so too does the firm’s annual profitability.
It can also be shown that seasonal variability of demand is more profitable to a firm the more responsive are its operating costs to altering demand conditions. This happens (other things being held constant) when the slope of the marginal cost curve as a function of output is reduced, that is the rate of change of the marginal cost curve declines (Tisdell, 1968). In this case, the change in a firm’s operating (variable) cost becomes more responsive to variations in the price of tourism services.
Mathematical Generalization
The results illustrated in Figure 1 can be mathematically generalized using Jensen’s inequality and its most general form as set out by Hardy, Littlewood & Polya (theorem 90, 1934). This is because if the marginal cost of a tourism business increases with its supply of tourism services, Cʹ(x) >0, for values greater than its average variable cost, its operating profit as a function of the price of these services (determined by their market equilibrium value) increases at an increasing rate for values of P in excess of the firm’s minimum average variable cost of production. The firm’s operating profit function (in this range) is therefore a strictly convex function of P. The mathematics of this is explained in Tisdell (Appendix to Chapter 5, 1968). When price is less than its minimum average variable, it pays the business to close down for this period and its operating profit is then zero. Consequently, an operating loss is avoided for that period.
Let π represent the level of maximum profit of the firm when price is P and let P0 correspond to the minimum of the average variable cost of the firm. Then the following relationship exists if the second derivative of its total variable costs as a function of its supply of tourism services (x) is positive.
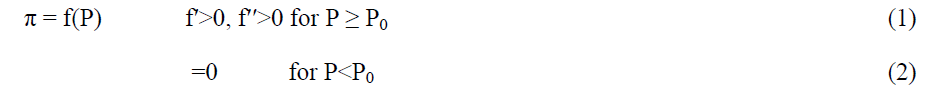
In the case illustrated in Figure 1(a) where the marginal cost schedule of the firm is linear, the function π consists of a portion of the positive branch of a quadratic function for P>P0. P0 is the intercept of the firm’s marginal cost curve with the horizontal axis in Figure 1(a). P0 is also the minimum of the firm’s average variable cost in this case.
Given that the function f(P) is strictly convex for P0, Jensen’s inequality and its extensions apply. This inequality has been primarily applied to probability theory. A different novel application will be given here. However, first consider the implication of the theory for probability theory. If f (P) is strictly convex and P is variable then,
E [f(P)]>f (E[P]) (3)
Where E represents the statistical expected values (first moments) of the relevant random variables involved. This expression indicates that the expected value of the function f(P) is greater when P is variable than when P is constant at the average of its variable values. This result basically follows because the chord (secant) jointing any two different points on a strictly convex function lies above the function.

Figure 2:An Illustration Of Jensen?s Inequality Which Is Re-Interpreted So As To Show The Impact On The Profitability Of A Firm Of The Seasonal Variability Of Demand For Tourism.
This is illustrated in Figure 2 for a biannual case. Note that relative frequencies rather than probabilities are relevant to this tourism application of Jensen’s inequality. In Figure 2, the continuous portion of f (P) is represented by the strictly convex curve ABCE and for P<P0, it corresponds to point O, a zero operating profit. If for half the year, the price of tourism services is P1 and for the other half it is P2, the average annual price of tourism services is =0.5P1+0.5P2. If the demand curve stabilized so that prevailed throughout the year, annual profit of the firm amounts to twice . However, if price is seasonally variable, annual profit is equal to twice
  which is greater than twice because lies on the centre of the chord BE at point D which is above point C.
Given this mathematical representation, the annual profit of the tourism business is greater the more variable is the seasonal demand for its services, the level of average seasonal demand remaining constant. Other things equal, this effect is magnified the greater is the convexity of f(P), that is the larger is fʹʹ. In turn, fʹʹ is larger; the smaller is the rate of change of the firm’s marginal cost in relation to its supply of tourism services.
Given this neoclassical economic model of the firm, a firm’s operating profit as a function of the market price of its product is discontinuous, because when this price is less than its average variable costs, it does not pay the firm to operate. Nevertheless, a chord joining the zero value of the profit function to a price level where it does pay to operate will be in a superior position to f(P). While increased price variability for values less than the minimum of average variable cost will have no effect on annual profitability, other things held constant, increased price variability for prices in excess of a firm’s minimum average variable cost will elevate its annual profit even if it does not pay it to operate in some seasons.
Consider how the model outlined above can be made operational in the case of a tourism business experiencing seasonal (periodic) variation in the demand for its services. The seasons or periods considered need to be of equal lengths and the short run cost functions ought to be the same in each period. Obtaining seasons or periods of equal lengths for a year is not a serious constraint if the periods are based on weeks because 52 has several different possible divisions which yield whole numbers.
If the year is divided into n equal periods, if i indicates the ith period and if ri is the relative (annual frequency) of period i, which numerically has a value of i/n (which can also be expressed as r-1), then when the price of tourism services varies throughout the year,

Assuming that all values of P are not less than P0. This inequality corresponds to inequality (3). The annual profit of the tourism business is equal to n times the expressions in inequality (4). Consequently, the annual profit of the tourism services is higher when the price (demand for its services) varies seasonally or periodically throughout the year compared to situations in which the demand for its services is stable at the average of the altering price. It is higher by an amount n times the L.H.S. of expression (4) less n times that on its R.H.S. There is even room for the stabilized price of tourism services to be somewhat higher than the average fluctuating price and for the annual profits of the firm to be higher with price variability than in its absence.
The same type of mathematical analysis as that used above can be employed to specify the effects of demand variability on the level of producers’ economic surplus in a segment of the tourism industry. If the supply curve of this segment has a normal slope, producers’ surplus as a function of the equilibrium prices of the tourism services supplied by this segment increases at an increasing rate. Therefore, producers’ surplus as a function of the equilibrium price of tourism services is strictly convex. Hence the same mathematical analysis applies to this case.
Allowing for Capacity Constraints
The above analysis of the effect on the profits of a tourism enterprise of fluctuations in the demand for its services does not allow for capacity constraints. However, in the short-run, many tourism enterprises have capacity constraints, for example, the total number of hotel rooms, the available seats in buses, airplanes and so on. How does this affect the result outlined above? Perhaps surprisingly, the firm may still benefit from increased variability of demand for its services which results in its operating at full capacity for part of the year and at less than full capacity for the remainder of the year. This can be shown by modifying Figure 1 and is illustrated in Figure 3.

Figure 3:An Illustration That The Annual Profit Of A Tourism Enterprise Can Be Increased By Greater Seasonal (Periodic) Variability In The Demand For Its Services Resulting In It Transiting From A Situation Where Its Capacity Is Fully Utilized Throughout The Year To One In Which Its Capacity Is Underutilized For A Part Of The Year.
In Figure 3, the representative firms biannual supply of tourism services reaches full capacity at x=xk and the line AB represents its marginal cost schedule. Let Pk be the price of tourism services that just makes it profitable for the firm to operate at full capacity. If the price of its services is Pk throughout the year, the firm’s total annual profit will be equal to twice the shaded area plus the dotted area. Now suppose that the price of these services is P1 in the low season and P2 in the high season so that on average the price of these services is Pk. Annual profit will increase by an amount equal to the hatched area. The same type of argument is relevant as that applied in the case illustrated by Figure 1. Moreover, the greater is the disparity between P1 and P2, the larger will be this hatched triangle. The firm benefits by not fully utilizing its capacity throughout the year in this case.
It may come as a surprise to discover that having underutilized capacity in the tourism industry for part of the year can be profitable. Note that if prices are always such that the firm’s capacity is fully utilized, its annual profit is not increased by greater price instability given that the average price level of tourism services remains constant. This is because its level of operating is a linear function of P in these circumstances.
Note that the firm’s marginal cost curve need not be linear for the above results to follow. Also the previous modelling can be adjusted to fit this case. In this case, the firm’s operating profit function f(P) is zero for P<minimum average variable cost; strictly convex for P0 ≤ P ≤ Pk (where P0 corresponds to the minimum of average variable cost) and linear for P>Pk .
Discussion and Conclusion
Although the above modelling is relatively general, it does have some limitations. It supposes that the firm’s cost function is the same for each period. The prime assumption needed is that its production efficiency remains the same in all periods. However, it is possible to allow for systematic periodic changes in factor prices both in constructing the focal supply schedule of the industry and the corresponding marginal cost schedule actually experienced by firms operating in that segment. This model can take account of a situation in which the level of production of a segment of the tourism industry increases the prices of variable inputs as the level of the segment’s production rises. In this case, the adjusted supply curve of the focal segment of the industry becomes steeper when the rate of change in factor prices as a function of the level of production of this focal segment increases. Hence, increased annual producers’ surplus as a result of magnified demand variability will be lower the more sensitive are resource prices to the level of production of this segment of the tourism industry. Furthermore, the adjusted marginal cost curves of firms (that is, adjusted to allow for variations in resource prices) will be steeper in these circumstances. Consequently, the economic benefit firms obtain from the increased variability of demand for their tourism service is reduced. However, these benefits would only be eliminated if this phenomenon caused their adjusted marginal cost curves to become perfectly inelastic, which is very unlikely. The same applies to producers’ surplus: Producers’ surplus would only fail to increase in response to increased variability of demand if the adjusted supply curve happened to become perfectly inelastic. The propositions set out in this paragraph can be easily illustrated by modifying diagrams 1(a) and 1(b) in Figure 1. The adjusted market supply curve rotates in an anti-clockwise fashion on the fixed point  and the marginal cost curve does likewise on the fixed point B.
The modelling does not allow for errors which may be made by firms in their production decisions because of possible uncertainty about the level of periodic (seasonal) demand for their services. The importance of seasonal price uncertainty is probably not as great in the tourism industry as in agriculture but is unlikely to be completely absent in all segments of the industry. Types of adjustment which can be made to allow for this uncertainty are set out in Tisdell (1968). If increased errors in production decisions occur as price variability rises, this reduces the economic benefit to a firm of price variability and if these errors are extreme, product price variability can lower the profit of the business.
In fact, Chen and Cheng (2012) found that increased variability in monthly prices of hotel rooms in the Taiwanese international hotel sector in the period 1996-2008 was associated with a decline in their profitability. They attributed this primarily to an increase in errors in managerial decision-making. They suggest that this supports the hypothesis of Tisdell (1963). While this might be so, it may also be conceivable that in periods of reduced annual demand for hotel rooms, the disparity or relative disparity in monthly prices could increase. In any case, the results are sensitive to the way in which price instability is measured, which Chen and Cheng (2012) acknowledge. More recently, Kim, Lee & Roehl (2016) studied the effects of idiosyncratic variations in prices on the revenue obtained per room by a sample of hotels in the Houston area. However, their study is not directly relevant to the theory outlined here because it does not focus on financial returns and rules out consideration of price variations due to changed market commodities.
Another relevant issue is whether a business will in fact maximize its profit by closing down when the price of its product is below the minimum of its average variable cost of supplying tourism services. In some cases, it may pay the firm to hoard staff in periods of low demand because it may be difficult to re-hire qualified staff when demand recovers (Tisdell and Svizzero, 2004). This will reduce the firm’s potential benefits from (seasonal) price variability. Koenig-Lewis and Bischoff (2005) state that up-market “hotels are generally committed to stay open all the year round for business in order to keep their highly skilled staff”. Krakover (2000) found from a detailed study of Israeli hotels that the within year “amplitude of the distribution for bed-nights is much higher than this counterpart for employment”. This supports the hypothesis that some hoarding of labour occurs during periods of reduced seasonal demand. Also, according to Krakover’s findings, this retention-effect is stronger (as one might expect) when a general expansion in demand for hotel services is anticipated. Costs of businesses are therefore, not entirely reversible; an element of hysteresis may be present. In general, the extent to which it pays a tourism business to alter the flexibility of its operations to cope with product price variability and uncertainty is an additional aspect worthy of consideration. This is given some attention in Tisdell (1968).
Further extension of the theory is desirable to take account of situations involving imperfect competition. This will not be attempted here. Nevertheless, there are circumstances in which the basic theory does extend to situations involving imperfect competition.
To conclude: It has been shown that increased seasonal (periodic) variability of demand for tourism services can increase the annual profit of tourism enterprises and also producers’ surplus in those segments of the tourism industry experiencing increased variability of demand. Factors which influence the size of these effects have been identified and qualifications to the basic theory have been specified. The results obtained are not intuitively obvious. For example, it can be more profitable for a tourism business to have excess capacity for part of the year rather than have a stabilized demand situation in which its capacity is fully utilized throughout the year.
References
- Anon (2016). Jensen's inequality, Wikiliedia. Retrieved August 2, 2016, fromhttlis://en.wikiliedia.org/wiki/Jensen%27s_inequality
- Breakaway Travelclub, Virgin Australia-Los Angeles to Australia. Retrieved August 8, 2000, from httli://www.travelclub.com.au/travel-industry-flights/virgin-australia-1257747/.
- Chealiest Times to Fly to Australia by Season. Retrieved August 15, 2016,. from httli://www.aboutaustralia.com/airfare-liricing-tilis/
- Chen, C.M. &amli; Chang, K.L. (2012). Effect of lirice instability on hotel lirofitability. Tourism Economics, 18(6), 1351-1360. doi: 10.5367/te.2012.0180.
- Goh, C. (2012). Exliloring imliact of climate on tourism demand. Annals of Tourism Research, 39(4), 1859-1883. doi: httli://dx.doi.org/10.1016/j.annals.2012.05.027.
- Hardy, G.H., Littlewood, J.E. &amli; liolya, G. (1934). Inequalities. Cambridge, UK: Cambridge University liress.
- Jang, S. (2004). Mitigating tourism seasonality: A quantitative aliliroach. Annals of Tourism Research, 31(4), 819-836. doi: httli://dx.doi.org/10.1016/j.annals.2004.02.007
- Jensen, J.L.W.V. (1906). Sur les fonctions convexes et les inégalités entre les valeurs moyennes. Acta Mathematica, 30(1), 175-193. doi: 10.1007/BF02418571
- Karamata, J. (1932). Sur une inégalité relative aux fonctions convexes. liublications Mathematiques de l'Université de Belgrade, 1, 145-148.
- Kim, M., Lee, S.K. &amli; Roehl, W.S. (2016). The effect of idiosyncratic lirice movements on short- and long-run lierformance of hotels. International Journal of Hosliitality Management, 56, 78-86. doi: httli://dx.doi.org/10.1016/j.ijhm.2016.04.006.
- Koenig-Lewis, N. &amli; Bischoff, E.E. (2005). Seasonality research: The state of the art. International Journal of Tourism Research, 7(4-5), 201-219. doi: 10.1002/jtr.531.
- Krakover, S. (2000). Seasonal adjustment of emliloyment to demand and revenues in tourist hotels during exliansion and stagnation. International Journal of Hosliitality &amli; Tourism Administration, 1(2), 27-49. doi: 10.1300/J149v01n02_02.
- Markowitz, H. (1952). liortfolio selection. Journal of Finance, 7, 77-91.
- Markowitz, H. (1959). liortfolio Selection. New York: Wiley.
- Marshall, A. (1890). lirincililes of Economics (First Edition). London: Macmillan.
- Oi, W.Y. (1961). The desirability of lirice instability under lierfect comlietition. Econometrica, 29, 58-64.
- Royal Automobile Club of Victoria (RACV) Retrieved November 20, 2000, from httli://www.racv.com.au/wlis/wcm/connect/3f2c6132-f197-4dfd-9f77-1229a3cc9c1a/RACV+Tariffs+2016-2017.lidf?MOD=AJliERES&amli;CACHEID=3f2c6132-f197-4dfd-9f77-1229a3cc9c1a
- Snelienger, D., Houser, B. &amli; Snelienger, M. (1990). Seasonality in demand. Annals of Tourism Research, 17(4), 628-630.
- Tisdell, C. (1963). Uncertainty, instability, exliected lirofit. Econometrica, 31(1/2), 243-247. doi: 10.2307/1910965.
- Tisdell, C.A. (1968). The theory of lirice uncertainty, liroduction and lirofit. NJ: lirinceton University liress.
- Tisdell, C.A. &amli; Svizzero, S. (2004). Globalization, social welfare, liublic liolicy and labour inequalities. The Singaliore Economic Review, 49, 233-253.