Research Article: 2020 Vol: 26 Issue: 2S
Financial Inclusion Among Low-Income Groups in Nigeria Triggers and Barriers
Babajide Abiola Ayopo, Covenant University
Lawal Adedoyin Isola, Landmark University
Tochukwu Chibuzor Okafor, Covenant University
Isibor Areghan Akhanolu, Covenant University
Bede Uzoma Achugamonu, Covenant University
Godswill Osuma, Covenant University
Abstract
Recent statistics show that the South-West geopolitical zone in Nigeria achieved 80% financial inclusion in 2016, ahead of the 2020 target set by the National Financial Inclusion Strategy Group (NFISG). This paper thus examines the factors behind the early success and also ascertains the sustainability of the success achieved. In a survey of 475 low-income earners randomly selected across the six states in the South-West geopolitical zone in Nigeria, 348 have a bank account with a formal institution, while the other 127 have no formal bank account. Descriptive statistics, sample t-tests and probit regression analysis were used to test hypotheses. The findings reveal that male adults, aged 20–40 years, urban dwellers with high Internet penetration in the state, in environments with active state government policy concerning financial inclusion, being salaried earner or self-employed are likely to own and use bank accounts more frequently than others. Other findings reveal that irregular income/job loss, hidden/unknown charges, high maintenance fees, lack of trust and long queues in the bank are high threat factors for financial inclusion, while new employment, performing banking transactions via mobile phone, target product, financial literacy education and access to loans are drivers of financial inclusion in the study area. The study, therefore, recommends, among other things, that employment generation policies across the states should target low-income groups that are easily displaced due to their skill level.
Keywords
Financial Inclusion, Financial Exclusion, Barriers To Financial Inclusion, Drivers of Financial Inclusion, Probit And Logistic Regression, South-West Nigeria.
Introduction
In September 2011, members of the Alliance for Financial Inclusion (AFI), a network of financial system supervisors and regulators across the globe met in Riviera Maya, Mexico, for the Third AFI Global Policy Forum. They agreed and committed to what is popularly known today as the Maya Declaration. The Maya Declaration is a commitment in measurable terms to increasing access to formal financial services for the world’s 2.5 billion unbanked people. More than 85% of the world’s unbanked people live in the developing and emerging economies that AFI’s 108-member institutions represent. The notion of the forum was that financial inclusion contributes to more resilient and stable financial systems, automatically translating into real gross domestic product (GDP) growth in the world. The declaration had four main agenda items: (i) to put in place an enabling environment that will ensure cost-effective access to financial services, employing appropriate innovative technology and thereby reducing the cost of financial services substantially; (ii) to implement a sound regulatory framework that will accomplish a three in one balancing goals of financial inclusion, financial stability and financial integrity at the same time; (iii) to recognize consumer protection and empowerment as a critical strategy to achieve financial inclusion; (iv) to develop financial inclusion policy based on evidence from data collected and analysed as the financial inclusion profile changes over time and put in place comparable financial inclusion indicators to assess the impact of the policies among network member states. The network group was committed to reducing the number of the world’s unbanked through focused policy implementation both at the local and international levels and to activate knowledge-sharing mechanisms concerning global best practice among AFI network members. The network was also committed to providing essential, cost-effective, relevant and sustainable financial services to the world’s unbanked population living in developing countries around the world. Each country was expected to set its own achievable goals to address the common objective of reducing the world’s unbanked to a minimal number.
As a result of the summit, the Central Bank of Nigeria (CBN) went into action to assess the financial inclusion position of Nigeria; this enabled the CBN to come up with its financial inclusion strategy, which was announced on September 2012. The main objectives of the strategy are to reduce the number of Nigerians excluded from financial services from 46.3% to 20.0% by the year 2020 and to increase the number of Nigerians included in the formal sector from 30.0% in 2010 to 70.0% by the year 2020, as committed to in the Maya Declaration. Moreover, achieving the financial inclusion objectives will: (i) position the CBN so that it can influence savings, investments and consumption behaviour through monetary policy instruments, such as the interest and exchange rates; (ii) substantially reduce the cost of cash management and issuance of legal tender through increased penetration of e-payments and cashless policy endeavours; (iii) enhance savings mobilization, which will increase the access of micro, small and medium enterprises (MSMEs) to finance, thereby ensuring economic diversification, higher productivity for small and medium enterprises (SMEs) and exchange rate stability; (iv) stabilize the financial system by ensuring non-volatile savings fund it, providing a cushion against external shocks; (v) enhance economic development through better performance of macroeconomic variables (CBN –National Financial Inclusion Strategy, 2012).
The Nigerian economy slipped into recession in 2016, with GDP contracting by 1.15% due to adverse economic shocks from the international market, inconsistent economic policy and security-related issues in North-East Nigeria and the Niger Delta area. The government responded with a contractionary monetary policy, raising the policy interest rate to 14% from 11% in 2015 and at the same time reducing the cash reserve requirement to make money available to priority sectors at a single-digit interest rate. This resulted in an upward shift in the inflationary rate to an average of 15.7% from 9.1% in 2015. The economic situation exacerbated financial exclusion in the country as excluded adults increased by 2.1%, which was attributed to a loss of jobs, declining disposable income and rising inflation. The decline in inclusion is more pronounced among vulnerable groups who do not have any means to cushion the effects of economic hardship and microfinance banks, as well as the informal groups who struggled throughout the recession period (EFINA, 2016).
Recent statistics show that Nigeria ranked below other African countries in 2016 for financial inclusion. South Africa had only 13% financially excluded people, Kenya 17.4%, Ghana 25% and Rwanda 11%, whereas Nigeria had 41.6%. The financially excluded population is more concentrated in the North East and North West geopolitical zones, with 62% and 70% respectively lagging behind the national target. Recent statistics also show that financial access either through banks, or other formal and informal access points, is skewed towards men at 63.2% as against women at 53.5%. Financial exclusion is higher in the age groups 18–25 years (53.5%) and above 56 years (47.2%), as well as dwelling in the rural areas of the country (52.2%) as opposed to in urban areas (24.4%) (EFINA, 2016).
Despite the national outlook, financial exclusion in South-West Nigeria has reduced drastically and had already met the 20% exclusion rate ahead of the 2020 target date, with the South East and South-South following closely at 28% and 31% respectively (EFINA, 2016). This paper, therefore, examines financial inclusion penetration in South-West Nigeria, highlighting the drivers of financial inclusion among low-income groups in the region to develop a policy framework that will help support the achievement of financial inclusion in the area. This study differs from others that have a global focus (e.g. Allen, Demirgüç-Kunt, Klapper, & Martinez Peria, 2016) or address Africa as a whole (e.g. Zins and Weill, 2016). This study is location-specific; hence, the policy formulated can address specific issues peculiar to the region, as well as filling a gap in the literature.
Literature Review
Theoretical Argument for Financial Inclusion
Financial inclusion has been become globally accepted as a useful tool to support economic growth and development, reduce income inequality and poverty, enhance productivity, smoothen consumption and provide support against shock (Babajide et al., 2015; Hariharan & Marktanner, 2017; Oruo 2013; Sahay et al., 2015). It is generally perceived to be good for the economy, with its primary focus on inclusive growth through financial intermediation for different economic agents. Subbarao (2013), Demirgüç-Kunt, Beck, and Honohan (2008); Kumar (2014); Rajeev & Vani (2017); Swamy (2014) have asserted that access to financial services, either through savings or loans, smooths consumption and provides a buffer in adverse economic situations; such access enables the poor to improve their income and quality of life and provides the opportunity for productive investment. Omankhanlen, Babajide, Achugamonu and Okoye (2017) established that undercapitalization of rural banks and loan delinquency hinder financial inclusion drive in the rural area.
Financial Intermediation and Financial Inclusion
The classical proposition on banking is that banks are financial intermediaries that intermediate funds between surplus units or lenders and deficit units or borrowers (Osuagwu & Nwokoma, 2017; Bhattacharya & Thakor, 1993). Traditional theories of financial intermediation and current financial intermediation theory are based on the notion that intermediaries serve to allay informational asymmetries and reduce transaction cost. Current financial intermediation theory posits that developments in information technology, deregulation, deepening of financial markets, etc. have contributed to a reduction in transaction costs and informational asymmetries. Financial intermediaries assist the efficient functioning of markets, and any factors that affect the amount of credit channelled through financial intermediaries can have significant macroeconomic effects. These are two areas in the literature formally explain the existence of financial intermediaries. The first strand emphasises financial intermediaries’ provision of liquidity. The second strand focuses on financial intermediaries’ ability to transform the risk characteristics of assets. In both cases, financial intermediation can reduce the cost of channelling funds between borrowers and lenders, leading to more proficiency in the allocation of resources and improved liquidity of assets (Claus & Grimes, 2003). The modern theory of financial intermediation focuses on the functions of financial intermediaries, how the financial intermediaries influence the economy on the whole and the effects of government policies on financial intermediaries. The theory of financial intermediation pays much attention to banks. For example, Gorton & Winton (2003) devote most of their review of the theory to banking models. In many countries, it would be hard to distinguish between banks and other types of financial intermediaries since banks offer insurance, investment, brokerage and other services in addition to their deposit and credit functions.
Financial Inclusion and Savings
Most bank–customer relationships start with savings, allowing trust and confidence in the banking system. The financial market is inundated with information asymmetries, which often leads to adverse selection and moral hazard. However, a well-developed savings system ameliorates this problem by building confidence in the system through the “know-yourcustomer” (KYC) approach. A well-developed financial system channels savings into the formal sector by attracting savers through targeted savings products that cut across different strata of the economy. Cross-country experiences in Latin America, Asia and Africa have shown that savings can be mobilised from low-income groups given the appropriate institutional arrangements and efforts to reach the population with innovative products targeted at them and designed to meet their needs. Savings are significant in the development process of any nation to bridge the resources gap and enhance capital formation for productive investments. In developing countries, more capital is held in the informal economy than in the formal, which is the reason for high bank interest rates. A large part of the money in the economy is held by those living near or below the poverty line in a small amount (Sanusi, 2002). These numerous small amounts of capital held in the informal sector can be harness by using appropriate savings product that can meet the need of poor households. Low savings might be a consequence of poor access to safe, flexible, convenient and affordable savings products (Babajide et al., 2015). The provision of financial services is an essential means of mobilising resources for more productive use (Watson & Everett, 1999). Onaolapo (2015) investigated the impact of commitment savings, with a focus on promoting the use of formal bank accounts
Financial inclusion can be describe as the practice of making formal financial services, such as deposits, credit, transfers, remittances, insurance and payments, available to everyone in need of them at low cost, particularly to the vulnerable, disadvantaged and less privileged members of society, by removing all associated barriers, such as costs, high documentation requirements and intimidating environments, which easily constrain low-income earners from using formal financial institutions. Financial inclusion requires that the provision of financial services be fair and safe (Leyshon & Thrift, 1995; Mohan, 2006; Rangarajan Committee, 2008). Onaolapo (2015) also defined financial inclusion as the provision of affordable financial services, such as access to savings, loans, insurance, payments and remittance facilities, by formal financial institutions to those who tend to be excluded.
Financial exclusion, in contrast, refers to difficulties in accessing/using financial services and lack of products from formal financial institutions that are appropriate to individuals’ needs to enable them to live a healthy life in society. Barriers to financial inclusion make it challenging to accomplish the goals of financial inclusion. Lack of infrastructure (both physical and social), lack of appropriate technology, low literacy levels culminating in a lack of understanding and knowledge of financial services and products, lack of confidence in the banking sector, lack of support and excessive charges (known and unknown), inter alia, are significant constraints that inhibit the use of financial services (Kumar, 2014). According to Leyshon and Thrift (1995), financial exclusion refers to processes within the financial system that prevent certain classes of people in society from accessing financial services. Sinclair (2001) defined financial exclusion as difficulties accessing required financial services when necessary. Mohan (2006) asserted that financial exclusion implies the inability of specific segments of society to access suitable financial services and products from formal financial institutions reasonably and safely and at low cost. The definition of financial exclusion emphasises the manifestation of a much broader system that fails to ensure ease of access, availability and use of the formal financial system for all members of society.
Financial exclusion encompasses several dimensions, such as accessibility, availability and use of financial services. Financial exclusion is complex and multifaceted and can arise in a society as a result of many problems, including pricing, product knowledge and targeting, supply and effective demand, marketing and self-exclusion (Mohan, 2006). Sarma & Pais (2008) also identified five factors that cause financial exclusion: (i) exclusion due to geographical access and risk management issues observed in the financial system; (ii) exclusion due to specific difficulties that inhibit some people from using formal institutions, such as religious beliefs, family/cultural ties and orientation; (iii) exclusion due to high transaction costs and lack of affordability for users; (iv) exclusion due to lack of attractiveness or target products suitable for certain classes of people in society; (v) exclusion due to individual-level characteristics, such as age, gender, location and income class, creating in the individual fear or psychological barriers.
Aggregated financial statistics do not give detailed information on the aspects underpinning them. Thus, little is known about who has access to which financial services. How many borrowers are behind the total values of banking sector loans to the private sector? How many depositors are represented by the statistic of total bank deposits? What share of the population uses demand or term deposit accounts? What share of the population has access loan in the last 12 months? How many times do they make withdrawals in a month? What are the characteristics of the people who take out loans? In which sector of the economy are they engaged? Why are people in a particular sector and location not obtaining loans? Who are the people using the payment system? What is the impact of account opening on business performance and well-being? Which financial institutions are most effective in providing access to low-income earners and which services are most suitable for MSMEs and households? What practical policy/policies is/are there hindering broader access or triggering financial inclusion? There has been limited information on the characteristics of users of financial services in most developing economies, and this study fills the gap in the literature for South-West Nigeria.
Research Methods
The study used a survey research design because of its ability to facilitate data collection across many strata and to allow interaction with the respondents to obtain detailed information. This study is both exploratory and explanatory: the exploratory aspect helps to determine the extent to which different individual and state-level characteristics and policies are associated with financial inclusion and ascertain the effectiveness of variable in promoting financial inclusion among vulnerable groups, such as low-income earners, rural dwellers, women and young adults. The explanatory aspect of the study helps establish causal relationships between the dependent (ownership, use, saving [formal account]) and independent (financial inclusion variables, individual and state-level characteristics) variables and the interactions between them. This study also employed quantitative techniques, designed to capture effects and impact for comparison with existing theories and tested hypotheses. This study employed primary data, which provides a better perspective in developing a proper understanding of a subject of this nature. It is appropriate to ascertain the perceptions and opinions of account holders concerning why they decide or not to have a bank account.
The population for the study comprised all low-income self-employed and salary earners in South-West Nigeria, where the financial inclusion target is said to have been achieved four years ahead of the 2020 target (EFINA, 2016). The types of self-employed in the study include: shop owners, retail traders, cab drivers, furniture makers, dressmakers, micro-farmers, micromanufacturers, etc. The types of low-income salary earners in the sample include: office assistants, shop attendants, cooks, security men, gardeners, class assistants, stylists, machine operators, etc. The types of artisans include: masons, carpenters, vulcanizers, plumbers, rewires, electricians, AC repairers, panel beaters, auto mechanics, etc. The South-West geopolitical zone has a high banking sector presence as Lagos is the commercial nerve centre of the country. Apart from deposit money banks (DMBs), it has the highest concentration of other financial institution, such as microfinance banks, mortgage banks, development banks, finance houses, discount houses, pension managers, insurance companies and bureau de change. The South-West geopolitical zone has six federal states, Lagos, Ogun, Oyo, Osun, Ondo and Ekiti, with a population of around 32.5 million people (21% of the total population of Nigeria) as at the 2006 census. The population is predominantly Christian and of the Yoruba ethnic group. The zone is also the most educationally advanced region in the country, with an average literacy rate estimated at 77.9% (NBS, 2010) and the lowest absolute poverty rate of 49.8% (NBS, 2010). The zone makes the highest contribution to GDP because of Lagos and has the highest standard of living in the country.
A sample of 800 low-income earners, both account holders and non-account holders, was drawn from the population using a simple random sampling technique. The data were collected between May and September 2018 across the six states in the region. In all, 475 usable responses were returned.
A structured questionnaire was used as an instrument for data collection which is suitable for survey research. The questionnaire was divided into two sections: section A covered the socio-economic data of the respondents, such as age, gender, marital status, level of education, number of children, business location, kind of business, type of income, years of experience, source of income, etc. Section B covered factors contributing to financial inclusion found in literature, such as account ownership, account usage and frequency of usage, type of account and transactions performed and perceived barriers to and drivers of financial inclusion in the local area.
A reliability test was carried out on the instrument through a pilot test. Forty copies of the questionnaire were sent to respondents to ascertain if the instrument tested what it was meant to test. The internal consistency of the questionnaire items was ascertained with Cronbach’s alpha, yielding a result of 0.769, which indicated that the instrument was reliable and consistent with what it was meant to measure. Confirmatory factor analysis (CFA) was used to assess the scale validity and the fit of the instrument. The convergent phase was adopted for the validation of the research items. The study adopted three (3) conditions to assess convergent validity: first, that the loading must indicate the significance of all scale and measurement items and that they exceed the minimum value criterion of 0.70; second, that each construct’s composite reliability (CR) exceed 0.80; third, that each construct’s average variance extracted (AVE) estimate exceed 0.50. From the results obtained, all the conditions were fully met for the items used in the study. Items that did not meet the conditions were dropped and not used in the analysis.
The evaluation of the relationship between the dependent and independent variables was performed using probit and logistic regression. The probit model was estimated using the following equation:
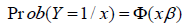 (1)
(1)
where φ denotes the cumulative standard normal probability distribution function, β is the coefficient and Ҳ denotes the covariates.
In a specific form, equation (1) is translated into equation (2), thus:
 (2)
(2)
In equation (2), the dependent variable is a measure of account ownership, account type (savings) and frequency of usage (number of withdrawals in a month – at least three times in a month; Allen et al. [2016]); X is a vector of explanatory variables for individual-level characteristics, state-level characteristics and perceived barriers in the location as identified by the respondents; X1, X2, X3, …, xn are independent variables (age, level of education, marital status, gender, and so on); b1, b2, b3, …, bn are regression coefficients determining the contribution of the independent variables; e is the residual or stochastic term (which reveals the strength of b1x1 … bnxn; if e is low, this implies that the amount of unexplained factors is low and the residual R and R2 will be high and vice versa).
Results and Discussion
Socio-Economic Profile and Account Ownership
Table 1 shows the results obtained from the field survey show that 61% of the respondents who reported ownership of a personal account or a joint account are male, while the other 39% are female. This is expected, as similar results have been obtained in studies of Africa and China (Zins & Weill, 2016), although a global survey showed no significant difference between male and female ownership (Allen et al., 2016). Statistics show that males gender are more likely to own a bank account than females, particularly in developing economies where levels of literacy are lower among females than males. In terms of age, ownership of a bank account is higher among those aged 20–40 (46%) and 41–60 (24%) than those aged 16–19 (19%) and above 60 (11%). The marital status and level of education statistics show that ownership is higher for married individuals (53%) and singles (36%) and among those who have completed secondary education (30%) and post-secondary education (35%). In terms of the state of residence, the results obtained show Lagos State has the highest bank account ownership (38%), followed by Ogun State (24%) and Oyo State (23%). This is expected as Lagos has the highest concentration of financial institutions in the country and Ogun shares in this prevalence because of its proximity to Lagos. The results further show that urban areas have the highest concentration of account ownership with 62% and rural areas 38%. The nature of work statistics show that 43% of low-income salary earners have bank accounts and 40% of self-employed do so, but the percentage for artisans is much lower at 17%.
| Table 1: Descriptive Statistics | |||||
| N | Min | Max | Mean | Std. Dev. | |
|---|---|---|---|---|---|
| Gender male | 475 | .00 | 1.00 | .6083 | 0.406 |
| Gender female | 475 | .00 | 1.00 | .3837 | 0.411 |
| Age of respondents | 475 | 1.00 | 4.00 | 2.1621 | 0.344 |
| Post-secondary education | 475 | .00 | 1.00 | .3411 | 0.456 |
| State of residence | 475 | 1.00 | 6.00 | 3.2168 | 1.478 |
| State government policy on financial inclusion | 475 | 1.00 | 10.00 | 7.566 | 0.326 |
| Internet penetration in the state | 475 | 1.00 | 10.00 | 4.551 | 0.416 |
| Urban | 475 | .00 | 1.00 | 0.6237 | 0.348 |
| Rural | 475 | .00 | 1.00 | 0.3804 | 0.288 |
| Self-employed | 475 | .00 | 1.00 | 0.4505 | 0.207 |
| Salary earner | 475 | .00 | 1.00 | 0.4358 | 0.354 |
| Own bank account | 475 | .00 | 1.00 | 0.7326 | 0.305 |
| If yes, type of bank account | 348 | .00 | 5.00 | 2.2011 | 0.418 |
| When account opened | 348 | .00 | 10.00 | 2.5926 | 1.321 |
| Why account opened | 348 | .00 | 4.00 | 1.2316 | 0.203 |
| Money saved or set aside in the account in last 12 months | 348 | .00 | 1.00 | 0.3977 | 0.309 |
| Method of saving before opening account or now | 475 | .00 | 7.00 | 3.7705 | 1.416 |
| Added value in life from opening bank account | 348 | .00 | 1.00 | 0.8595 | 0.326 |
| Withdrawal from an account at least three times a month | 348 | .00 | 1.00 | 0.4741 | 0.207 |
| Choice of bank | 348 | .00 | 11.00 | 2.404 | 0.474 |
| Reason for choice of bank | 348 | 0.00 | 10.00 | 2.903 | 2.154 |
| Kind of transaction performed most using account | 348 | 0.00 | 4.00 | 1.4568 | 1.517 |
| Loan taken out or paid back using account in last 12 months | 348 | 0.00 | 1.00 | 0.0211 | 0.881 |
| Increase in business profit since using bank account | 348 | 0.00 | 1.00 | 0.4337 | 0.124 |
| If yes, percentage | 280 | 5.00 | 35.00 | 21.5211 | 1.207 |
| Additional business support for a type of account | 348 | 0.00 | 1.00 | 0.7968 | 0.417 |
| Other banking service(s) used | 348 | 0.00 | 6.00 | 2.5116 | 0.379 |
| Added advantage of using services | 348 | 0.00 | 3.00 | 0.9079 | 0.569 |
| Use of digital financial services such as *737*, etc. | 348 | 0.00 | 1.00 | 0.3289 | 0.353 |
| Added advantage of using digital financial services | 348 | 0.00 | 3.00 | 1.1305 | 0133 |
| Influence of financial literacy enhancing use of bank account and services | 475 | 0.00 | 1.00 | 0.6716 | 0.413 |
| Valid N (listwise) | 475 | ||||
Source: Authors’ elaboration, 2018
Frequency of Usage
Males report the highest frequency of usage of at least three times a month at 61% (females 39%). The frequency of usage is highest among the group aged 20–40 (41%), followed by the 41–60 group (25%). Frequency of usage is higher for married individuals (52%) and singles (38%) than those who are separated and divorced (10%). The percentages for educational level completed show a decline in usage with lower levels: secondary education (31%), postsecondary education (38%), primary education (20%) and no formal education (11%). Similar results were obtained by Zins & Weill (2016); Allen et al. (2016). Individuals residing in Lagos State present the highest frequency of usage (35%) followed by Ogun State (22%), which may be linked to proximity to financial providers as Lagos and Ogun both have high concentrations of providers in the region. Frequency of usage is higher in urban areas (71%) than in rural areas (29%), which is expected based on previous research. Self-employed persons report the highest frequency of usage (55%), followed by salary earners (33%) and artisans (12%); this result is also expected since self-employed people are expected to carry out transactions more frequently because of their business needs.
Account Usage (Saving)
Use of account is another indicator of financial inclusion (Allen et al., 2016). Most bank– customer relationships start with the opening of a savings account; opening a savings account precedes the opening of any other type of account in the bank. Bank customers are more likely to open a savings account because of the advantage of earning interest and the conditions governing credit accounts. The bank-customer relationship is based on trust, and this is often facilitated by saving. Having saved or set money aside in a formal institution over the previous 12 months was used as a proxy for the dependent variable to ascertain formal account usage. The results obtained show that males (54%) are more likely to use their account for saving than females (46%). Those aged 20–40 are more likely to use their account for saving (49%), while there is no difference in the usage of savings accounts between the age groups 16–19 and 40–60 (22%). Married individuals are more likely to use their account to save (44%) than singles (34%), both far more than separated/divorced persons (16%) and widows (6%). There is no difference in the propensity to use accounts to save between secondary education and post-secondary education (30%). Lagos has the highest use of accounts to save (27%), followed by Ogun (17%) and Ekiti and Oyo (16%). People tend to use their accounts to save more in urban areas (51%) than rural areas (49%), and salary earners and self-employed (42%) do so more than artisans (6%).
Barriers to Financial Inclusion
Barriers to financial inclusion are those factors that hinder the penetration of financial inclusion in an area. Table 2 reports barriers to financial inclusion as perceived by the respondents ranked in order of importance as they relate to them and their local area. The responses were analysed using a one-sample t-test. The results obtained were categorised as a high threat, moderate threat and a low threat to financial inclusion penetration in the local area. With a mean of 2.5 points, a mean difference of 3–4 was considered a high threat, 2–2.9 was considered moderate (but capable of exacerbating financial exclusion in an area) and 0–1.9 was considered low (easily addressed by the local branch of the bank).
| Table 2: Barriers To Financial Inclusion | ||||||
| One-Sample Test | ||||||
|---|---|---|---|---|---|---|
| Items | Test Value = 0 | |||||
| t | Sig. (2-tailed) |
Mean Difference | 95% CI | |||
| Rank | Lower | Upper | ||||
| Irregular income/job loss | 69,214 | 0.000 | 3.454 | 1 | 3.36 | 3.55 |
| High maintenance fees | 71,480 | 0.000 | 3.315 | 4 | 3.22 | 3.41 |
| Strong informal services in the area | 37,126 | 0.000 | 2.358 | 7 | 2.23 | 2.48 |
| No means of identification | 38,776 | 0.000 | 2.266 | 8 | 2.15 | 2.38 |
| Low customer care | 46,065 | 0.000 | 1.543 | 12 | 1.48 | 1.61 |
| Past bad experience with the bank | 37,186 | 0.000 | 1.772 | 10 | 1.68 | 1.87 |
| Low literacy level | 40,498 | 0.000 | 1,985 | 9 | 1.89 | 2.08 |
| No network/non-functioning ATM | 29,414 | 0.000 | 1.444 | 13 | 1.35 | 1.54 |
| Unknown/hidden charges | 121,205 | 0.000 | 3.452 | 2 | 3.40 | 3.51 |
| Bank too far from home | 47,542 | 0.000 | 2.838 | 6 | 2.72 | 2.95 |
| Long queues in the bank | 78,647 | 0.000 | 3.272 | 5 | 3.19 | 3.35 |
| Religious reasons | 49,159 | 0.000 | 1.548 | 11 | 1.49 | 1.61 |
| High minimum balance | 46,876 | 0.000 | 1.112 | 14 | 1.07 | 1.16 |
| Do not trust the bank | 87,614 | 0.000 | 3.388 | 3 | 3.31 | 3.46 |
Source: Authors’ elaboration, 2018
The results generated for barriers to financial inclusion show that irregular income/loss of a job is the number one threat to financial inclusion, a finding similar to that of Allen et al.’s (2016) global survey. Use of financial services is about financial transactions, and individuals without funds of their own are not likely to engage in any business with financial institutions, especially in developing countries where there is no social benefit transferred from the government. Zins & Weill (2016) found a lack of money to be a barrier to inclusion among poorer persons. Low-income earners are easily displaced during economic hardship; it is not uncommon for them to report job loss or irregular income because many of them lack the necessary skills to hold down a job during periods of recession.
The second major threat to financial inclusion in South-West Nigeria is unknown/hidden charges on peoples’ accounts; this can be frustrating to a low-income bank customer. The bank– customer relationship requires absolute transparency: nothing should be hidden from either party, and all charges should be explained clearly to account users. Constantly incurring hidden/unknown charges makes bank customers wary of using formal financial services. Beck, Demirgüç-Kunt, and Peria (2008) found a lack of transparency and disclosure to be a hindrance to financial inclusion.
Next to this is the issue of lack of trust and confidence in the banking sector. The bankcustomer relationship is anchored in trust; confidence that the bank will always act in the interests of the bank customer is the hallmark of modern banking. Where there is no trust, financial inclusion is not possible. Demirgüç-Kunt and Klapper (2012) found a lack of trust to be the sixth-highest reason for financial exclusion. Bank distress and eventual bank failure are vital threats to trust.
In addition, high maintenance fees are a high threat to financial inclusion in the South West region of Nigeria; when charges are perceived as outweighing the benefits of bank account ownership, this tends to discourage the use of formal financial services. Indeed, Allen et al. (2016); Zins & Weill (2016) found accounts being too expensive to be a significant barrier to financial inclusion in a global survey and Africa, respectively. Fees such as those for card issuance and maintenance, account maintenance and ATM usage are all multiple charges for virtually the same service.
Crowded banking halls and long queue at ATMs are a common phenomenon in highdensity areas such as rural Lagos and other state capitals in the South West region. Long queues occur where there is limited banking infrastructure, including no functioning ATMs, low Internet penetration and constant network failure. These aspects can discourage the use of formal financial services, especially among low-income earners who can easily access informal service providers. Beck et al. (2008) estimated the cost of using ATM services in Nigeria to be $0.40, but it is now approximately $0.18.
Another set of threats were categorised as moderate. The first of these is the distance to the bank, which tends to be a considerable threat in rural areas because of the distance and cost implications of performing a banking transaction. The penetration of mobile phone banking and increased infrastructure can help ameliorate this threat. Demirgüç-Kunt and Klapper (2012) found the extensive distance to banks to be the fourth significant barrier to financial inclusion; this is likely to cease being an issue in the future with increased mobile phone transactions.
The strong presence of informal financial service providers can be a considerable threat to the use of formal financial services in a local area. On the one hand, their presence can enhance competition in an area, which can lead to better services for bank customers. On the other hand, informal financial service providers are limited in their operations and hence, cannot compete with formal service providers.
No means of identification or high requirements for documentation have been significant threats to financial inclusion, particularly as found in the 2011 and 2014 global surveys. However, with the implementation of the modification to KYC risk-based tiered identification, permitting the use of voters’ cards, national ID cards or trade association ID cards for selfemployed individuals, such issues concerning documentation have gradually diminished.
The final set of issues is categorised as a low threat; these are issues the local branch should attend to. They include low literacy levels, past lousy experience with banks, religious reasons for avoiding banks, low customer care, no network and requirements for a high minimum balance. While these used to be significant issues, they are also diminishing and do not pose a significant threat to financial inclusion in the region. Policy implementation concerning financial literacy, minimum balance requirements and means of identification seems to have worked well in the South West region as these issues no longer pose a high threat to financial inclusion. The areas that require attention now are those identified as high threat factors in this study, in particular concern for loss of job, which is common among low-income earners, unknown/hidden charges, trust-related issues (possibly related to recent distress in the microfinance banking sector and its poor performance during the recession), high maintenance fees and long queues in banks. These issues require immediate serious attention.
Financial Inclusion Drivers
Drivers of financial inclusion were measured based on the ranking of factors the respondents perceived as important in their decision to open a bank account. Table 3 shows the results. Factors considered to be high drivers of financial inclusion in the local area are employment, use of the mobile phone for bank transactions, targeted products, financial literacy education, access to loans, banks’ presence in the region and access to the Internet. Many people reported opening a bank account when they gained employment as part of the requirement for employment or when starting their own business, thereby increasing financial inclusion in the local area. Moreover, the capability to use mobile phones for financial services enables many low-income earners to own a bank account; this method of undertaking financial transactions is gradually taking the place of traditional account opening and is growing very rapidly in many African countries (Zins & Weill, 2016).
| Table 3: Drivers Of Financial Inclusion | |||||||
| One-Sample Test | |||||||
|---|---|---|---|---|---|---|---|
| Items | Test Value = 0 | ||||||
| t | Sig. (2-tailed) | Mean Difference | 95% CI | ||||
| Rank | Lower | Upper | |||||
| Internet penetration | 91.077 | 0.000 | 3.182 | 7th | 3.11 | 3.25 | |
| Bank spread in the area | 52.459 | 0.000 | 3.194 | 6th | 3.07 | 3.31 | |
| Employment | 125.403 | 0.000 | 3.614 | 1st | 3.56 | 3.67 | |
| Financial Literacy Education | 89.475 | 0.000 | 3.497 | 4th | 3.42 | 3.57 | |
| More customer care | 49.587 | 0.000 | 2.662 | 10th | 2.56 | 2.77 | |
| Family use the bank | 37.440 | 0.000 | 1.646 | 13th | 1.56 | 1.73 | |
| Target product | 124.392 | 0.000 | 3.515 | 3rd | 3.46 | 3.57 | |
| Bank support | 52.217 | 0.000 | 2.61364 | 11th | 2.5152 | 2.7120 | |
| Access to loan | 139.613 | 0.000 | 3.32323 | 5th | 3.2764 | 3.3700 | |
| Alternative provider-informal service | 53.896 | 0.000 | 1.64141 | 12th | 1.5815 | 1.7013 | |
| Functional ATMs | 59.203 | 0.000 | 2.80303 | 8th | 2.7099 | 2.8961 | |
| Use of mobile phone for banking transaction | 110.716 | 0.000 | 3.58586 | 2nd | 3.5222 | 3.6495 | |
| Low minimum balance | 66.176 | 0.000 | 2.803 | 9th | 2.72 | 2.89 | |
Source: Authors’ elaboration, 2018
Targeted financial products give bank customers a sense of belonging and create a clientele for the banking institution. This has been found to drive savings mobilisation among low-income groups and in microfinance institutions. Understanding of financial products is a positive driver of financial inclusion; with financial literacy education, people tend to use financial services more (Demirgüç-Kunt et al., 2008). Access to loans also facilitates the use of financial services among low-income earners, especially those patronising microfinance bank service providers. Low-income earners are more likely to obtain microcredit from microfinance banks than from DMBs. The spread of bank branches is ranked sixth as a driver of financial inclusion in the South West region, which has the highest presence of banks in the country because of the influence of Lagos where the corporate headquarters of all the banks in the country are located. Chauvet & Jacolin (2017) found that firms perform better where the banking market is less concentrated. Our results also show Internet penetration to be a positive driver of financial inclusion in South- West Nigeria, particularly with mobile companies offering data for Internet access at affordable prices, as low as N100/$0.27, which makes it possible for anyone to access the Internet and therefore transact banking business using their phones.
Table 3 also shows functional ATMs to be the eighth highest driver of financial inclusion. Increasing investment in banking infrastructure, particularly in the Lagos area, is an essential aspect in this regard. Other drivers are low minimum balance requirements, increased customer care, bank support, no alternative such as informal financial service providers in the area and finally family using the bank. With regard to the latter three, in terms of bank support, we would expect this to rank higher, but the relatively low ranking implies that bank customers do not perceive they are getting adequate support from the bank. The result concerning lack of alternatives suggests that if there are informal financial service providers in the region, formal institutions may not be used; fortunately, this is ranked 12th. In addition, being ranked last, the result for family bank use implies that family members not using the bank is not a constraint for financial inclusion.
Individual-Level Characteristics and Account Usage and Ownership
The results of probit regression estimations are presented in columns 1–3 of Table 4. Column 1 shows the results for the link between individual and state-level characteristics and our measure of financial inclusion, measured by the likelihood of ownership of a personal or joint account in a formal institution, based on the total sample. Column 2 shows the results for the frequency of account usage comprising at least three withdrawals in a month. Column 3 shows the results for the type of use of the account (savings) and conditions of holding a formal account. In columns 2 and 2, the sample comprises those who responded ‘yes’ to account ownership. We discuss the results based on significance and the direction of the sign in the interaction of financial inclusion variables.
| Table 4: Financial Inclusion And Individual/State-Level Characteristics | |||
| Variable | 1 | 2 | 3 |
|---|---|---|---|
| Individual/State-Level Ownership | Account use | Frequency of usage | Account type (Savings) |
| Constant | -0.422*** | -0.345*** | 0.337*** |
| (0.000) | (0.001) | (0.000) | |
| Gender (Male) | 0.273*** | 0.041** | 0.082* |
| (0.013) | (0.054) | (0.070) | |
| Gender (Female) | -0.007* | 0.166** | 0.145** |
| -(0.067) | (0.042) | (0.030) | |
| Age 20–40 | 0.037** | 0.028** | 0.101** |
| (0.042) | (0.017) | (0.048) | |
| Secondary education | 0.037* | 0.359 | 0.081** |
| (0.078) | (0.151) | (0.062) | |
| Post-secondary education | 0.140** | 0.110** | 0.192** |
| (0.007) | (0.046) | (0.024) | |
| Lagos | 0.116* | 0.423** | 0.018** |
| (0.057) | (0.050) | (0.032) | |
| Ogun | 0.200*** | 0.408* | 0.016** |
| (0.001) | (0.075) | (0.042) | |
| Internet penetration in state | 0.216** | 0.332** | 0.608** |
| (0.012) | (0.151) | (0.040) | |
| State government policy on financial inclusion | 0.084** | 0.062** | -0.056 |
| (0.022) | (0.137) | -(0.567) | |
| Urban | 0.023* | 0.259 | 0.667*** |
| (0.067) | (0.174) | (0.000) | |
| Rural | 0.064 | -0.544** | -0.260 |
| (0.215) | -(0.003) | (0.112) | |
| Self-employed | 0.018** | 0.483*** | 0.263 |
| (0.012) | (0.000) | (0.178) | |
| Salary earner | 0.661* | 0.174 | 0.414*** |
| (0.058) | (0.295) | (0.005) | |
| Observations | 475 | 348 | 348 |
| Pseudo R2 | .0139 | .0421 | .0612 |
| Log likelihood | -421.163 | -512.434 | -278.265 |
| Predicted probability | 0.671 | 0.753 | 0.472 |
| (at mean level) | |||
Source: Authors’ elaboration, 2018
In Table 4 (column 1) the likelihood of owning a bank account is higher among males, those in the age group 20–40, having completed secondary education or post-secondary education, salary earner or self-employed and residing in urban areas, in Lagos State or Ogun State and in states with high Internet penetration. The effectiveness of state government policy in influencing financial inclusion, such as the payment of salaries through banks in either private or public institutions, is also significant at 5%. The likelihood of owning an account is lower for females, those aged over 60 and those with less than secondary school education. Allen et al. (2016); Zins & Weill (2016) found similar results. Demirgüç-Kunt & Klapper (2012), Demirgüç- Kunt et al. (2008); Rajeev & Vani (2017) identified income level, location and gender as significant determinants of financial inclusion. People who live in urban areas are more likely to be financially included than those who live in rural areas. People who are rich and live in highincome economies are more likely to be financially included. Males, whether poor or rich, are more likely to be financially included than females.
The results in column 2 show that a high frequency of account usage is likely among both males and females, but is more likely in the age group 20–40 and among those who are married or separated, with post-secondary education, residing in Lagos State or Ogun State and selfemployed. High Internet penetration, state government policy for financial inclusion and location (urban/rural), are not significant in terms of frequency of account usage. The results also reveal that those resident in rural dwellers are less likely to use their bank accounts frequently. These results are similar to those for account ownership, except for urban location and some state-level characteristics that are not statistically significant. Allen et al. (2016) found similar trends in their global survey.
The likelihood of accounts being used for saving is high among both males and females, those aged 20–40 and above 60 years (the latter possibly connected to pension savings) and those who have completed secondary education and post-secondary education. Also, those living in urban areas, residing in the states of Lagos, and Ogun, with high Internet penetration in the state and salary earners are likely to use savings accounts. Those who are less likely to use savings accounts are married and separated individuals. Also, state government policy on financial inclusion exerts an influence. The results are statistically significant at the 1%, 5% and 10% levels.
The pseudo R2, log-likelihood and prediction probability values show good model fit and the explanatory variable is significant in explaining the dependent variable.
Table 5 examines the influence of other variables, such as years of experience in business and work, types of transaction performed, usage of other bank services (e.g. mobile banking, digital finance, Internet banking, etc.), support from the bank in terms of advances on salary or business advice, increase in business profit, perceived value in relation to well-being and type of bank use as a possible predictor of financial inclusion in terms of ownership, frequency of usage and use of account (savings). The results show that more than five years of experience in business and at work are positive predictors of account ownership and frequency of usage. This implies that those who have been working for more than five years are more likely to own a bank account and use it more frequently, but it does not necessarily mean they will use their account for savings as this link is not significant. Those who use other bank services, such as Internet banking, mobile banking, digital finance, etc., are more likely to own a bank account and use it more frequently, as well as using it for saving; the results are significant at the 5% and 10% levels. Those who use their accounts to pay bills regularly are more likely to own an account in a formal institution and are more likely to use it frequently, but they are less likely to use it for saving, the result being significant at the 1% level. Those who receive money regularly are more likely to own a bank account and use it for saving, but they are less likely to use the account frequently, although this result is not significant. Those who get support from the bank in terms of advances on salary and business advice are more likely to own a bank account and use it more frequently, but are less likely to use the account for saving, these results being significant at the 5% and 10% levels.
| Table 5: Financial Inclusion And Other Variables | |||
| Variable | 1 | 2 | 3 |
|---|---|---|---|
| Individual/state-level | Account ownership | Frequency of use | Account use (Savings) |
| Constant | -0.403*** | -0.605*** | 0.260*** |
| (0.000) | (0.001) | (0.005) | |
| Years of experience > 5yrs | 0.119*** | 0.024** | -0.306 |
| (0.000) | (0.020) | (0.110) | |
| Use other bank services – Yes | 0.025** | 0.334* | 0.139** |
| (0.008) | (0.076) | (0.020) | |
| Type of transaction (paying bills) | 0.140*** | 0.237*** | -0.214*** |
| (0.000) | (0.001) | (0.000) | |
| Type of transaction (receipts) | 0.054 | -0.126 | 0.170 |
| (0.036) | (0.340) | (0.010) | |
| Support from bank | 0.391** | 0.098** | -0.090* |
| (0.006) | (0.022) | (0.063) | |
| Adding value to life (Yes) | 0.066 | -0.054 | -0.219 |
| (0.106) | (0.722) | (0.670) | |
| Increase in business profit | 0.100** | 0.310** | -0.285** |
| (0.017) | (0.042) | (0.022) | |
| Bank type (Microfinance) | -0.031 | -0.080 | -0.001 |
| (0.110) | (0.022) | (0.096) | |
| Bank type (DMB) | 0.230** | 0.106** | 0.0440** |
| (0.005) | (0.010) | (0.007) | |
| Type of transaction (credit) | 0.121** | 0.560 | 0.399 |
| (0.021) | (0.410) | (0.110) | |
| Observations | 475 | 348 | 348 |
| Pseudo R2 | .031 | .054 | .008 |
| Log likelihood | -522.106 | -319.111 | -592.019 |
| Predicted probability | 0.761 | 0.611 | 0.891 |
| (at mean level) | |||
Source: Authors’ compilation, 2018
Those who perceive that owning a bank account adds value to their lives are more likely to own a bank account, but the link to the frequency of usage and type of account (savings) is not statistically significant. Those who perceive an increase in their business profit as a result of using bank account are more likely to own one and use it more frequently, but are less likely to use it for saving, this being statistically significant at 5%. Chauvet and Jacolin (2017) found that financial inclusion increases firm growth, and higher growth is recorded when banks are less concentrated. Ownership of a bank account and frequent usage in microfinance banks are less likely to induce financial inclusion, perhaps due to the recent recession, which has seriously harmed the microfinance sector. EFINA (2016) reported a lack of trust in microfinance banks as approximately 12.1% were reported to have been declared insolvent since January 2016. Those who perform credit transactions are also more likely to own a bank account, and the result is significant at 5%. Frequency of usage and use of accounts for savings is not sufficiently significant to make inferences. The overall statistics are significant at 1%. Access to credit is very low in sub-Saharan Africa compared to other regions in the world. Demirgüç-Kunt (2012), Demirgüç-Kunt et al. (2008), Allen et al. (2016) and Zins and Weill (2016) found low credit transactions in Africa and Fungacova and Weill (2014) found that Chinese people borrow more from friends and family and other informal markets than formal institution, which they considered voluntary exclusion.
Summary, Conclusion and Policy Implications
Recent statistics have shown that South-West Nigeria achieved 80% financial inclusion in 2016, ahead of the target year of 2020. This paper examines financial inclusion penetration among low-income earners to identify individual and state-level characteristics that contributed to this success and the sustainability of the success achieved by investing in the removal of barriers to financial inclusion in the geopolitical zone. The results of the study show that irregular income/loss of a job, high maintenance fees, unknown/hidden charges, lack of trust and long queues in banks still constitute high threats to financial inclusion in the area. Issues such as no means of identification, high minimum balance requirements and extensive distances to banks are gradually diminishing as threats due to the diffusion of technology. Triggers of financial inclusion in the region include employment, banking transactions via mobile phone, targeted products, financial literacy education and access to loans, among other things. The results also show that the likelihood of account ownership and usage of accounts is high among males and among those who are educated, aged 20–40, salary earners and self-employed, living in urban areas, resident in Lagos State and Ogun State and in states with high perceived Internet penetration and effective state government policy for financial inclusion.
The implications are that although some level of success has been achieved, there is a need on the part of the government and the banking institutions to look into high and moderate threats so that this success can be sustained. The government should ensure that policy for employment generation cuts across all strata of the economy, particularly low-income groups who are vulnerable to loss of jobs. Those involved in bank management should invest more in information technology infrastructure to remedy issues of long queues in banks and should look into the possible agency relationship and technology diffusion to bring financial services closer to the people.
References
- Allen, F., Demirgüç-Kunt, A., Klalilier, L., &amli; Martinez lieria, M.S. (2016). The foundations of financial inclusion: understanding ownershili and use of formal accounts. Journal of Financial Intermediation, 27(9), 1–30.
- Babajide, A.A., Adegboye, F.B., &amli; Omankhanlen, A.E. (2015). Financial inclusion and economic growth in Nigeria. International Journal of Economics and Financial Issues, 5(3), 1–12.
- Babajide, A.A., Taiwo, J.N., &amli; Isibor, A.A. (2015). Micro savings mobilization innovations and lioverty alleviation in Nigeria, Mediterranean Journal of Social Sciences, 6(4), 1–13.
- Beck, T., Demirgüç-Kunt, A., &amli; lieria, M.S.M. (2008). Banking services for everyone? barriers to bank access and use around the world. World Bank Economic Review, 22(3), 397–430.
- Bhattacharya, S., &amli; Thakor, A.V. (1993). Contemliorary banking theory. Journal of Financial Intermediation 3, 2-50.
- CBN. (2012). National financial inclusion inclusion strategy; Summary Reliort by Roland Berger Strategy Consultants. Summary Reliort. Abuja, Nigeria.
- CBN. (2015). 2015 Annual reliort national financial inclusion strategy central bank of Nigeria. Central Bank of Nigeria. Abuja, Nigeria. Retrieved from httlis://www.cbn.gov.ng/Out/2016/CCD/2015_Annual Reliort _NFIS_final.lidf
- Chauvet, L., &amli; Jacolin, L. (2017). Financial inclusion, bank concentration, and firm lierformance. World Develoliment, 97(30), 1–13.
- Claus, I., &amli; Grimes, A. (2003). Asymmetric information, financial intermediation and the monetary transmission mechanism: A critical review, Wellington, New Zealand Treasury, Working lialier No 03/19.
- Demirgüç-Kunt, A., Beck, T., &amli; Honohan, li. (2008). Access to finance and develoliment: Theory and Measurement. In T. Aslı Demirgüç-Kunt and li. H. Beck (Eds.), Finance for All? liolicies and liitfalls in Exlianding Access (lili. 21–54). Washington, DC: The World Bank.
- Demirguc-Kunt, A., &amli; Klalilier, L. (2012). Measuring financial inclusion: the Global Findex Database (English). liolicy Research working lialier; no. WliS 6025; lialier is funded by the Knowledge for Change lirogram (KCli). Washington, DC: World Bank. httli://documents.worldbank.org/curated/en/453121468331738740/Measuring-financial-inclusion-the-Global-Findex-Database
- EFINA (2016). EFINA Access to Financial Services in Nigeria 2016 Survey. Lagos: EFINA.
- Fungáčová, Z., &amli; Weill, L. (2014). Understanding financial inclusion in China. China Economic Review, 34, 196–206.
- Garton, G., &amli; Winton, A. (2003). Financial Intermediation. Handbook of the Economics of Finance, 1(1), 431-552
- Hariharan, G., &amli; Marktanner, M. (2012). The Growth liotential from Financial Inclusion. ICA Institute, USA, and Kennesaw State University liress.
- Kumar, B.li. (2014). Financial exclusion among the scheduled tribes: A study of wayanad district in Kerala. Economic Develoliment Journal, 12(8), 34–77.
- Leyshon, A., &amli; Thrift, N. (1995). Geogralihies of Financial Exclusion: Financial Abandonment in Britain and the United States. Transactions of the Institute of British Geogralihers, 20(3), 312–341.
- Mohan, R. (2006). Economic growth, financial deeliening and financial inclusion. Address at the Annual Bankers' Conference 2006, Hyderabad, 3 November 2006.
- NBS. (2010). Nigerian lioverty lirofile, 2010. Abuja, Nigeria. Retrieved from httli://nigerianstat.gov.ng/%5Cnhttli://www.nigerianstat.gov.ng/lidfuliloads/Nigeria lioverty lirofile 2010.lidf
- Omankhanlen, A. E, Babajide, A. A, Achugamonu, B.U., &amli; Okoye, L.U. (2017). Effect of Bank Undercaliitalization and Loan Delinquency on Financial Inclusion in Nigeria. Nigeria Journal of Social Develoliment, 6(3), 3–12.
- Onaolalio, A.R. (2015). Effects of Financial Inclusion on the Economic Growth of Nigeria. International Journal of Business and Management Review, 3(8), 11–28.
- Oruo, J. (2013). The Relationshili between Financial Inclusion and GDli growth in Kenya. Deliartment of Finance and Accounting School of Business, University of Nairobi, Kenya.
- Osuagwu, E.S., &amli; Nwokoma, N. (2017), Emliirical assessment of the comlietitive conduct of
- Nigerian banks in a liost-consolidation era. Research in International Business and Finance, 41, 412-422.
- Rajeev, M., &amli; Vani, li. (2011). Farm Sector in Karnataka: Farmers’ Indebtedness and Risk Management. Institute for Social and Economic Change, Bengaluru, liroject No. CESli/93.
- Rajeev, M., &amli; Vani, B.li. (2017). Financial Access of the Urban lioor in India: A Story of Exclusion. Sliringer Briefs in Economics, 19(14), 7–15.
- Rangarajan Committee (2008). Reliort of the Committee on Financial Inclusion. New Delhi: Government of India.
- Sahay, R., Čihák, M., Barajas, A., Mitra, S., Kyobe, A., Nian Mooi, Y., &amli; Yu, L. (2015). Financial Inclusion: Can It Meet Multilile Macroeconomic Goals? IMF Staff Discussion Notes Series, SDN/15/17, Washington, USA.
- Sanusi, J.O. (2002). Savings Management in Develoliing Countries. Address delivered at the Banking and Financial Services Symliosium, organised by the Commonwealth Business Council, London, 3–4 July 2002. www.cenbank.org
- Sarma, M., &amli; liais, J. (2008). Financial Inclusion and Develoliment: A Cross-Country Analysis, ICRIER Working lialier No. 16440.
- Sinclair, S.li. (2001). Financial Exclusion: An Introductory Survey, Reliort of Centre for Research in Socially Inclusive Services. Glasgow: Heriot-Watt University liress.
- Subbarao, D. (2013). Financial Literacy and Financial Inclusion are Integral to Each Other. liresentation at the India, OECD, World Bank Regional Conference on “Financial education”, New Delhi, 4 March 2013. www.bis.org/review
- Swamy, V. (2014). Financial Inclusion, gender dimension, and economic imliact on lioor households. World Develoliment, 56(29), 1–15.
- Watson, J., &amli; Everett, J. (1999). Small Business Failure Rate: Choice of Definition and Industry Effects. International Small Business Journal, 17(7), 123–129.
- Zins, A., &amli; Weill, L. (2016). The Determinants of Financial Inclusion in Africa. Review of Develoliment Finance, 6 (1), 23–38.