Research Article: 2018 Vol: 22 Issue: 2
Financial Performance of Private Commercial Banks in India: Multiple Regression Analysis
Nataraja NS, Alliance University
Nagaraja Rao Chilale, Vijaya College
Ganesh L, Christ University
Keywords
ROA, ROE, Tobin’s Q Ratio, Operational Efficiency, Credit Risk.
Introduction
Among the various financial institutions, banks are the fundamental component and the most active players in the financial system especially financial markets (Guisse, 2012). It provides capital for innovation, infrastructure and job creation and over all prosperity. It has become the integral part of our society, both industries as well as individual consumers.
For the past three decades Indian’s banking system has several outstanding achievements to its credit. The most striking is its extensive reach even to the remote corners of the country. It has been increasingly focusing on adopting integrated approach to risk management. According to RBI, majority of the banks already meet capital requirements of Basel III (Economic times, June 20, 2017). Already State-run banks have put in place the framework for asset-liability match, credit and derivatives risk management. Banks look for maximum profitability and have the responsibility in increasing the value of shareholders’ equities (State run banks maintain equity ratio of 8.5%) on one side (Economic times, June 20, 2017) and improving customer satisfaction on other side. The role of the banking industry is crucial for sustained economic growth. In this context, it is essential to understand and evaluate banks performance in monetary terms which can be carried out by using financial ratios. Generally, the results are reflected in the bank’s return on net worth, return on assets, return on equity, return on investment, operating income, earnings before interest and taxes, net asset value, etc.
The performance of the Banks is a major concern for any countries trade and its development. It has to manage large volume transactions. Industry related stakeholders, investors, stock holders and other policy makers need to know about the financial performance of a bank for granting credits, loans and investments. RBI and government crossed its hands in finding various ways for the full implementation of international capital norms. In this scenario, it is essential to analyse the financial status of banks by examining the ratio analysis which is the most logical way to examine the present and to predict the future position of any banks. Moreover, it determines the ability of the bank to meet its current obligations, its operating efficiency and its performance. These ratios not only help to decision making process but also emphasised on internal status of banks and also its performance in market comparing to other banks. So this study aims to examine the financial performance under three major areas like, internal-based performance, market-based performance and performance related to bank’s income. By establishing a secure relationship between the variables, a firm can analyse its financial performance in terms of profitability and viability. The present study focus on measuring the performance of three large private sectors banks namely HDFC, ICICI and AXIS BANK through extensive use of key financial ratios.
Literature Review
Sharifi and Akhter (2016) considered the credit deposit ratio as a barometer of progress of a financial institution like commercial banks. According to them, it indicates the level credit deployment of banks in relation to deposits mobilized by them. A high credit deposit ratio indicates that banks are generating more credit from its deposits and vice-versa. Further, they say that the outcome of this ratio reflects the ability of the bank to make optimal use of the available resources. They carried out a study with a purpose to present the performance of public sector banks through the credit-deposit ratio based on the secondary data collected from 26 public sector banks for a 7 year period (2008-2015). The data were analysed using a descriptive statistics and panel data regression model. Their findings and analysis reveal that the CDR impact positively on public sector bank's financial performance.
Jilkova and Stranska (2017) analysed the effect of the economic situation of the Czech Republic on the performance and profitability of the banking market through selected determinants in their study. They have focussed on measuring the performance and profitability of the banking sector using the method of “Multiple linear regression model”. They not only studied the overall fitness of model but also determined which independent variables have the greatest and the smallest effect on the dispersion of the dependent variables. Their paper clarifies the structure of the Czech banking sector and it is focused on the performance and profitability in the defined time period and also compares with the selected banking sector and indicators in other countries.
Pandya (2015) analysed the impact of priority sector advances of scheduled commercial banks operating in India on their profitability. Author, considered all the scheduled commercial banks operating in India for this purpose. Ratios of Priority sector advances to total advances (PSATA) of all commercial banks during the study period taken as an independent variables whereas, Return on Assets (ROA), Return on Investment (ROI), Return on Equity (ROE), Ratio of Operating Profit to Total Assets, (OPTA) and Ratio of Interest Income to Total Assets (INTTA) were taken as dependent variables. Linear regression models were used to examine the relationship between independent and dependent variables. The study reveals that there exists a statistically significant relationship between PSATA and ROI, ROA, OPTA, INTTA. The results thus imply that priority sector advances have bearing on bank profitability. Further, the study reveals that priority sector advances affect ROA and ROI of the banks. Therefore, author suggests the banks should exercise caution while advancing loans to priority sector else it would be adversely affecting the profitability of the banks.
Narwal and Pathneja (2015) discussed the different determinants of productivity and profitability of banks functioning in India. They have studied the performance of public and private sector banks in terms of productivity and profitability in two different time periods (2003-2004 to 2008-2009 and 2009-2010 to 2013-2014). Regression analysis was applied to discover the determinants of different bank groups. The results of the study disclose that private sector banks are more productive than public sector banks over the whole study period and also observed no significant difference in the profitability of two bank groups. The author’s reason of more productivity of private sector banks is the better utilization of technology than the public sector banks.
Adam (2014) conducted the study to investigate financial performance of Erbil Bank for Investment and Finance, Kurdistan Region of Iraq during the period of 2009-2013.author has used statistical tool for analysis purpose of several variables which would affect the banking system in general in order to know whether these variables are significantly correlated with the financial performance for the bank. The findings of the study show the positive behaviour of the financial position for Erbil Bank and some of their financial factors variables influence the financial performance for the bank. Author also noticed that the overall financial performance of Erbil Bank is improving in terms of liquidity ratios, assets quality ratios or credit performance, profitability ratios (NPM, ROA and ROE). Further, the study suggests a set of recommendations regarding the development and enhancing of some banking operations which will boost the bank's profitability and improve the financial performance for the bank.
Sarokolaei (2012) conducted the research to forecast the performance of 10 Iranian banks using multi-linear regression method and artificial neural network and compared these two methods. They have collected the financial data related to 10 Iranian banks for the four years from the most reliable sources. The regression method has been used to find the relationship between the calculated efficiency of ROA (Return on Average Assets) and the independent variables. The findings of multi-linear regression method showed a positive relationship between efficiency and the 3 independent variables of size, cost to income ratio and inflation rate. They also used ROA as an output for the network in the artificial neural network and 7 different inputs were used to identify the pattern according to the predictive variables finally, the performances of these two methods were measured by using MSPR (Means Square Predicted Error). The results of the research showed that the amount of MSPR in multi-linear regression method is much lower than the MSPR amount in artificial neural network method and concluded that the regression method presents a better performance compared to neural networks in predicting the efficiency of Iranian banks.
Karim and Alam (2013) measured the performance of selected private sector banks in Bangladesh by using financial ratios which mainly indicate the adequacy of risk based capital, credit growth, credit concentration, non-performing loan position, liquidity gap analysis, liquidity ratio, return on assets (ROA), return on equity (ROE), net interest margin (NIM). Multiple regression analysis was carried out to apprehend the impact on credit risk, operational efficiency and asset management and created a good-fit regression model to predict the future financial performance of these banks.
Jha and Hui (2012), compared the financial performance of different ownership structured commercial banks in Nepal based on their financial characteristics and identified the determinants of performance exposed by the financial ratios, which were based on CAMEL Model. In addition, they developed multivariate econometric model by formulating two regression models for the purpose of estimating the impact on financial profitability. The authors observed that public sector banks are significantly less efficient whereas domestic private banks are equally efficient to foreign-owned banks. Furthermore, the estimation results reveals that return on assets was significantly influenced by capital adequacy ratio, interest expenses to total loan and net interest margin; while capital adequacy ratio had considerable effect on return on equity. Similar study was done on moderating effect of ownership structure on bank performance in Kenya (Ongore & Kusa, 2013). The study was carried out by linear multiple regression model and Generalized Least Square on panel data for estimation. The findings show that the effect of macroeconomic variables was inconclusive. Further, the moderating role of ownership identity on the financial performances was insignificant.
Alam (2011) compared the financial performance of public banks and private banks in Pakistan for successive three years. They considered bank size, profitability ratios, leverage ratios, liquidity ratios and asset quality ratios as variables for analysis. According to the study, public banks scores the highest based on profitability ratios ROA and ROE, leverage ratios and liquidity ratios, whereas private banks scores the first in case of bank size and asset quality ratios. Similarly, study in Indonesia on bank performance Hadiwidjaja (2013), observed that Capital, Asset, Earnings and Liquidity Ratio has significant influence towards profit growth comparing to Liquidity ratio which has partially significant influence.
Performance of commercial bank in UAE was examined by Al-Tamimi (2011). The banks which are classified on the basis of the total assets as small and large were selected for the study. Their study consists of 15 large banks and 23 small banks. The findings revealed that large banks perform better than small banks. The results reveal that capital adequacy (ratio of total equity to total assets) is the important performance indicator in the classification of banks. Also study concludes that highly fragmented banks do not perform well. In order to improve the operations effectively and to reduce waste, the study recommended for the merger of banks.
Impact of financial ratios on the performance of Jordanian commercial banks was carried out by Almazari (2011). The result indicates that there exists a positive correlation between financial performance and asset size, asset utilization and operational efficiency, which was also significantly confirmed with regression analysis. Also, findings make way to formulate policies which promote effective financial system.
Similar studies were carried out on Malaysian banks (Guisse, 2012), Islamic Banks (Milhem and Istaiteyeh, 2015) and major Indian Banks (Haque, 2014) using financial ratios to measure the performance in terms of profitability, liquidity, ROA, ROE and risk. The result indicates that there is no significant means in difference of profitability among banks.
The above literature study clearly indicates that it is very essential to know the performance of banks for any decision making. Most of the studies are done on measuring the financial performance of banks through statistical model’s analysis. Also from the reviews it is observed that firm’s financial performance depends on certain key financial factors i.e., turnover, profitability, Capital, liquidity and risk which may have direct or indirect relation with each other. By establishing a close relationship between variables, policy makers or investors can analyse its financial performance in terms of liquidity, profitability and viability (Ramaratnam & Jayaraman, 2010). Also in order to implement the Basel III norms, banks are in position to raise the equity and capital by 2019. According to RBI estimates (Economic times dated June 20, 2017) entire banking sector needs Rs. 5 lakh crore as capital which is a contrary for banks, which would restrict their ability to lend. In these circumstances, it is imperative to study the performance of banks. Present study makes an attempt on large private leading banks in India (Hindustan Times, March 02, 2017) namely HDFC, ICICI and AXIS banks under three dimension viz internal based performance, market based performance and income based performance using statistical model analysis.
Research Objective and Hypothesis
Objective
The main objective of the study is to analyse the financial performance of the selected private sector banks in India. Specific objectives are:
1. To measure the Internal- based performance of banks by using ROA;
2. To examine the market-based performance by using Tobin’s Q;
3. To study and understand the amount of a Bank's income that is returned as shareholder equity ROE.
Data and Methodology
The current study is to investigate the financial performance of three major private sector banks namely HDFC, ICICI and AXIS BANKS in India which are listed in both BSE and NSE. Among the Private sector banks in India, the selected three banks are having large assets size, market capitalization and profit (Source; Bloomberg data base, financial statements as on March 2017) which are considered to be the performance indicators of banks. Hence, the present study consists of only three banks.
The data (financial ratios) were taken from secondary source viz, Bloomberg and annual reports of banks for the period of 12 years from 2006 to 2017.
Methodology
The analysis have considered three regression models to fulfil the above mentioned objectives and these models will measure the financial performance of the selected private commercial banks in India. Correlation was done to find the association between variables in each case before determining the regression models. The first regression model is, determination of ROA (which measures the internal-based financial performance), second model is, determination of Tobin’s Q (which measures the market-based financial performance) and the third model is, determination of ROE (Which measures the amount of a Bank's income that is returned as shareholder equity) based on Five identical explanatory variables, Bank size, Credit risk, operational efficiency, Asset management and Debt ratio.
Variables in the Study
Three dependent variables are ROA, Tobin’s Q and ROE:
ROA=Return on Assets;
Tobin’s Q=it is the ratio of market value of banks to book value of equity;
ROE=Return on Equity;
The five independent variables considered in our study are Bank size (which is the log of total assets), Credit risk, Operational efficiency, Asset management and Debt ratio.
Analysis and Findings
Analytical Framework
Multiple linear regression analysis is a technique for modelling the linear relationship between a dependent and one or more independent variables. It is one of the most widely used of all statistical methods. In banking and finance literature, regression analysis is a very common method used to find the determinants of bank performance (Ongore and Kusa, 2013; Sharifi and Akhter, 2016) the present study involves fitting three models for three different dependent variables based on the common five independent variables. The general form of multiple regression equation is:
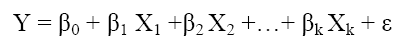
Where
Y = dependent (explained variable)
Xi = ith independent (explanatory variable), i = 1, 2…k
β0, β1, β2, β3…βk are the partial regression coefficients of respective independent variables. These are estimated using least squares method from the input data.
The coefficient of independent variable reflects how dependent variable Y changes when the independent variable, Xi (i =1, 2…k), changes by one unit, while the other independent variables remain constant. If the dependent variable and independent variables are specified in natural logarithms, the coefficients of independent variables can be interpreted as elasticises. Thus, these coefficients will show the percent change of the dependent variable if the independent variable changes by one percent.
Empirical Results of Three Models
First Model
Corresponding to first objective, the null and alternative hypothesis may be defined as
H0: Bank size, Credit Risk (CR), Operational efficiency (OE), Asset management (AM) and Debt Ratio (DR) have no impact on ROA.
From Table 1, it is evident that ROA has positive correlation with asset management whereas; with all other explanatory variables it has negative correlation. This indicates that ROA increases when asset management value and bank size value increases (Table 2).
| Table 1 Correlation Values Among Roa, Bank Size, Oe, Cr, Am And Debt Ratio |
|||||||
| Correlations | |||||||
| ROA | Credit risk | Operational efficiency | Asset Management | Log(TA) | Total debt/TA | ||
| ROA | Pearson Correlation | 1 | -0.467** | -0.453** | 0.625** | 0.212 | -0.337* |
| Sig. (2-tailed) | 0.004 | 0.006 | 0.000 | 0.214 | 0.045 | ||
| N | 36 | 36 | 36 | 36 | 36 | 36 | |
| Table2 Estimation Of Parameters For Roa Model |
||||||
| Model | Unstandardized Coefficients | Standardized Coefficients | T | Sig. | ||
| B | Std. Error | Beta | ||||
| 1 | (Constant) | 0.798 | 1.062 | 0.752 | 0.458 | |
| Credit risk | -0.268 | 0.053 | -0.622 | -5.085 | 0.000 | |
| Operational efficiency | -1.263 | 0.429 | -0.371 | -2.944 | 0.006 | |
| Asset Management | 22.206 | 6.047 | 0.378 | 3.672 | 0.001 | |
| Log(TA) | 0.233 | 0.138 | 0.228 | 1.682 | 0.103 | |
| Total debt/TA | -0.006 | 0.007 | -0.122 | -0.926 | 0.362 | |
| a. Dependent Variable: ROA | ||||||
Model is ROA = β0 + β1CR + β2 OE + β2AM + β2Bank size + β2DR + ε
i.e., ROA = 0.798 - 0.268CR - 1.263OE + 22.206 AM + 0.233Bank Size - 0.006DR
The adjusted R2 value in the above Table 3 clearly tells us that 74.8% of variation in the dependent variable (ROA) is explained by the explanatory variables. This indicates a good explanatory power of the regression model.
| Table 3 Model Summary |
||||
| Model | R | R Square | Adjusted R Square | Std. Error of the Estimate |
| 1 | 0.885a | 0.784 | 0.748 | 0.175534727 |
| a. Predictors: (Constant), Total debt/TA, Asset Management, Operational efficiency, Credit risk, Log(TA) | ||||
Table 4 gives the results of the ANOVA technique applied to test our null hypothesis against alternative hypothesis. The sig. value clearly indicates that model is significant at 5% chosen level of significant (0.000<0.05). Thus, null hypothesis is accepted which states that Credit risk; Operational efficiency, Asset Management, Bank size and Debt Ratio have significant impact on ROA (internal-based financial performance) of selected private sector banks.
| Table 4 Significance Of Roa Model |
||||||
| Model | Sum of Squares | Df | Mean Square | F | Sig. | |
| 1 | Regression | 3.355 | 5 | 0.671 | 21.779 | 0.000b |
| Residual | 0.924 | 30 | 0.031 | |||
| Total | 4.280 | 35 | ||||
| a. Dependent Variable: ROA | ||||||
| b. Predictors: (Constant), Total debt/TA, Asset Management, Operational efficiency, Credit risk, Log(TA) | ||||||
Further, the significance of each explanatory variable on ROA can be assessed through t-sig value provided in the Table 2. Table 2 tells us that the explanatory variables credit risk, operational efficiency and asset management have significant impact on ROA (p-values<0.05) whereas Bank size and debt ratio have insignificant effect on ROA (p-values>0.05).
Second Model
According to second objective, the null may be stated as:
H0: Bank size, credit risk, operational efficiency, asset management and debt ratio have no impact on Tobin’s Q.
From Table 5, it is evident that Tobin’s Q has positive correlation with operational efficiency and asset management whereas it has negative correlation with other three variables. This indicates that Tobin’ Q increases when operational efficiency and asset management value increases whereas with other three variables values decreases. Also, it is clear from the table that Correlation between Tobin’s Q and credit risk, Bank size and debt ratio are significant.
| Table 5 Correlation Values Among Tobin’s Q, Bank Size, Oe, Cr, Am And Dr |
|||||||
| Correlations | |||||||
| Tobin's Q | Credit risk | Operational efficiency | Asset Management | Log(TA) | Total debt/TA | ||
| Tobin's Q | Pearson Correlation | 1 | -0.512** | 0.244 | 0.038 | -0.490** | -0.689** |
| Sig. (2-tailed) | 0.001 | 0.151 | 0.825 | 0.002 | 0.000 | ||
| N | 36 | 36 | 36 | 36 | 36 | 36 | |
| ** Correlation is significant at the 0.01 level (2-tailed) | |||||||
| * Correlation is significant at the 0.05 level (2-tailed) | |||||||
As per the estimation, the model can be fit as:
Tobin’s Q = β0 + β1CR + β2 OE + β2AM + β2Bank size + β2TDT + ε
i.e., Tobin’ Q =12.484 + 0.004CR - 2.212OE - 6.183 AM - 0.960Bank Size - 0.104TDT
The adjusted R2 value in the above Table 7 clearly tells us that 43.3% of variation in the dependent variable (Tobin’s Q) is explained by the explanatory variables. This indicates a reasonably good explanatory power of the regression model.
Table 8 gives the results of the ANOVA technique applied to test our null hypothesis against alternative hypothesis. The sig. value clearly indicates that model is significant at 5 % chosen level of significant (0.000<0.05). Thus, Credit risk, Operational efficiency, Asset Management, Bank size and debt ratio have significant impact on Tobin’ Q (market-based financial performance) of selected private sector banks. Further, the significance of each explanatory variable on Tobin’ Q can be assessed through t-sig value provided in the Table 6. It is observed that Bank size and debt ratio have significant impact on Tobin’ Q (p-values<0.05) whereas other three variables have insignificant effect on Tobin’ Q (p-values>0.05).
| Table 6 Estimation Of Tobin’s Q Model |
||||||
| Model | Unstandardized Coefficients | Standardized Coefficients | T | Sig. | ||
| B | Std. Error | Beta | ||||
| 2 | (Constant) | 12.484 | 5.194 | 2.404 | 0.023 | |
| Credit risk | 0.004 | 0.258 | 0.003 | 0.017 | 0.987 | |
| Operational efficiency | -2.212 | 2.098 | -0.199 | -1.054 | 0.300 | |
| Asset Management | -6.183 | 29.574 | -0.032 | -0.209 | 0.836 | |
| Log(TA) | -0.960 | 0.677 | -0.288 | -3.418 | 0.016 | |
| Total debt/TA | -0.104 | 0.033 | -0.616 | -3.128 | 0.004 | |
| a. Dependent Variable: Tobin's Q | ||||||
| Table 7 Model Summary |
||||
| Model | R | R Square | Adjusted R Square | Std. Error of the Estimate |
| 2 | 0.717a | 0.514 | 0.433 | 0.858484908 |
| a. Predictors: (Constant), Total debt/TA, Asset Management, Operational efficiency, Credit risk, Log(TA) | ||||
| Table 8 Significance Of Tobin’s Q Model |
||||||
| Model | Sum of Squares | Df | Mean Square | F | Sig. | |
| 2 | Regression | 23.376 | 5 | 4.675 | 6.344 | 0.000b |
| Residual | 22.110 | 30 | 0.737 | |||
| Total | 45.486 | 35 | ||||
| a. Dependent Variable: Tobin's Q | ||||||
| b. Predictors: (Constant), Total debt/TA, Asset Management, Operational efficiency, Credit risk, Log(TA) | ||||||
Third Model
For the third objective of our study, the null hypothesis taken as,
H0: Independent variables have no impact on ROE.
From Table 9, it is evident that ROE has positive correlation with operational efficiency and asset management whereas; with other three explanatory variables it has negative correlation. This indicates that ROE increases when operational efficiency and asset management value increases whereas with other three variables values it decreases. Also, it is clear from the table that Correlation between ROE and credit risk, Bank size and debt ratio are significant.
| Table 9 Correlation Values Among Roe, Bank Size, Oe, Cr, Am And Dr |
|||||||
| Correlations | |||||||
| ROE | Credit risk | Operational efficiency | Asset Management | Log(TA) | Total debt/TA | ||
| ROE | Pearson Correlation | 1 | -0.790** | 0.225 | 0.271 | -0.548** | -0.638** |
| Sig. (2-tailed) | 0.000 | 0.187 | 0.110 | 0.001 | 0.000 | ||
| N | 36 | 36 | 36 | 36 | 36 | 36 | |
| ** Correlation is significant at the 0.01 level (2-tailed) | |||||||
| * Correlation is significant at the 0.05 level (2-tailed) | |||||||
Estimation shows the model of ROE as
ROE = β0 + β1CR + β2 OE + β2AM + β2Bank size + β2TDT + ε
i.e., ROE = 49.703 - 3.186CR - 3.123OE + 263.533AM - 4.990Bank Size + 0.018TDT
The adjusted R2 value in the above Table 11 clearly tells us that 74.6% of variation in the dependent variable (ROE) is explained by the explanatory variables. This indicates a very good explanatory power of the regression model.
Table 12 gives the results of the ANOVA technique applied to test our null hypothesis against alternative hypothesis. The sig. value clearly indicates that model is significant at 5% chosen level of significant (0.000<0.05). Thus, Credit risk, Operational efficiency, Asset Management, Bank size and debt ratio have significant impact on ROE (the amount of a Bank's income that is returned as shareholder equity) of selected private sector banks.
Further, the significance of each explanatory variable on ROE can be assessed through t-sig value provided in the Table 10. It shows that explanatory variables Credit risk, asset management and Bank size have significant impact on ROE (p-values<0.05) whereas other two variables have insignificant effect on ROE (p-values>0.05).
| Table 10 Estimation Of Roe |
||||||
| Model | Unstandardized Coefficients | Standardized Coefficients | t | Sig. | ||
| B | Std. Error | Beta | ||||
| 3 | (Constant) | 49.703 | 12.694 | 3.915 | 0.000 | |
| Credit risk | -3.186 | 0.630 | -0.622 | -5.060 | 0.000 | |
| Operational efficiency | -3.123 | 5.129 | -0.077 | -0.609 | 0.547 | |
| Asset Management | 263.533 | 72.287 | 0.377 | 3.646 | 0.001 | |
| Log(TA) | -4.990 | 1.654 | -0.410 | -3.018 | 0.005 | |
| Total debt/TA | 0.018 | 0.081 | 0.030 | 0.225 | 0.823 | |
| a. Dependent Variable: ROE | ||||||
| Table 11 Model Summary |
||||
| Model | R | R Square | Adjusted R Square | Std. Error of the Estimate |
| 3 | 0.884a | 0.782 | 0.746 | 2.098347911 |
| a. Predictors: (Constant), Total debt/TA, Asset Management, Operational efficiency, Credit risk, Log(TA) | ||||
| Table 12 Significance Of Roe Model |
||||||
| Model | Sum of Squares | Df | Mean Square | F | Sig. | |
| 3 | Regression | 474.417 | 5 | 94.883 | 21.549 | 0.000b |
| Residual | 132.092 | 30 | 4.403 | |||
| Total | 606.509 | 35 | ||||
| a. Dependent Variable: ROE | ||||||
| b. Predictors: (Constant), Total debt/TA, Asset Management, Operational efficiency, Credit risk, Log(TA) | ||||||
Discussion and Conclusion
Present study elaborately examines the performance of Banks in three ways. First one is internal based performance, second is market based performance and thirdly by a Bank's income that is returned as shareholder equity.
The internal based performance is studied by ROA as it is known as profitability or productivity ratio. ROA can provide banks with a valuable tool to measure their progress against predetermined internal goals. The ROA ratio illustrates how well management or Bank is employing the company's or Bank’s total assets or resources to generate more income (profit). The higher the return, the more efficient management or bank is in utilizing its asset base. ROA measurements include all of a business's assets including those which arise out of liabilities to creditors as well as those which arise out of contributions by investors. The inclusion of liabilities makes ROA even more valuable as an internal measurement tool. Another common internal use for ROA involves evaluating the benefits of investing in a new system versus expanding a current system. The best choice will ideally increase productivity and income as well as reduce asset costs, resulting in an improved ROA ratio. It is evident from the above results that the credit risk, operational efficiency and asset management have significant impact on ROA. There is a positive correlation of ROA with asset management and bank size whereas, negative correlation with the credit risk, operational efficiency and debt ratio. This indicates that with increase in asset management and bank size, there has been increase in ROA or Bank’s performance.
Asset management has very strong positive correlation with ROA, as it is logical that with increase in efficient asset management, the return on assets will be higher. In case second model Tobin’s Q, it represents the ratio of the market value of a bank's share capital to the replacement cost of the bank's share capital (i.e., ratio of market valuation to the replacement valuation) which reflects profitability. Tobin’s Q greater than one implies stock is overvalued. Tobin’s Q less than one shows stock is undervalued. To an investor, the over value of stock implies that the market value is higher than the bank's stated book value. i.e., the market is selling the banks’ assets higher than its stated book value. So, its stock is more expensive than the costs of its assets and the under value of stock implies that the market value is lower than the bank's stated book value. In other words, the market is selling the bank’s assets less than its stated book value. As per current estimation, Tobin’s Q is modelled through five variables credit risk, asset management, operational efficiency and bank size and debt ratio. The result in the Table 6 indicates bank size and debt ratio are key determinants of Tobin’ Q.
Return on equity (ROE) is one of the key profitability ratios which indicate the amount of net income returned as a percentage of shareholders’ equity. It measures a bank's profitability by revealing how much profit a bank generates with the money shareholders have invested. In other words, it can be used for evaluating how effectively a bank’s management team is managing the capital that shareholders entrust to it. A higher ROE is expected for high growth banks. Also, the average of ROEs of past years gives a better idea of the historical growth of the bank. Our results in the Table 10 show that the credit risk, asset management and bank size have significant impact on ROE. Operational efficiency and asset management are positively correlated whereas credit risk and bank size are negatively correlated with ROE. This indicates that the value of ROE would be increased for increase in the values of operational efficiency, asset management and for decrease in the values of credit risk and bank size.
In the nutshell, the bank size, credit risk, operational efficiency asset management and debt ratio have significant impact on internal performance, market performance and bank income which illustrates the financial performance of the three selected private commercial banks in India.
References
- Adam, M.H.M. (2014). Evaluating the financial performance of banks using financial ratios: A case study of Erbil bank for investment and finance. European Journal of Accounting Auditing and Finance Research, 2(6), 162-177.
- Alam, H.M. (2011). A financial performance comparison of public vs. private banks: The case of commercial banking sector of Pakistan. International Journal of Business and Social Science, 2(11), 56-64.
- Almazari, A.A. (2011). Financial performance evaluation of some selected Jordanian commercial banks research. Journal of Finance and Economics, 68, 50-63.
- Guisse, M.L. (2012). Financial performance of the Malaysian banking industry: Domestic vs. foreign banks, Institute of Graduate Studies and Research.
- Hadiwidjaja, R.D. (2013).The influence of the bank’s performance ratio to profit growth on banking companies in Indonesia. Review of Integrative Business and Economics Research, 5(1).
- Haque, A. (2014). Comparison of financial performance of commercial banks: A case study in the context of India, Journal of Finance and Bank Management, 2(2), 1-14.
- Al-Tamimi, H.A. (2011). Multiple approaches in performance assessment of UAE commercial banks. International Journal of Islamic and Middle Eastern Finance and Management, 4(1), 74-82.
- Jha, S. & Hui, X. (2012). A comparison of financial performance of commercial Banks: A case study of Nepal. African Journal of Business Management, 6(25), 7601-7611.
- Jilkova, P. & Stranska, P.K. (2017). Multiple linear regression analyses of the performance and profitability of the Czech banking sector. Institute of Economic Research, Working Papers, No. 41/2017.
- Karim, A.R. & Alam, T. (2013). An evaluation of financial performance of private commercial banks in Bangladesh: Ratio analysis. Journal of Business Studies, 5(2).
- Milhem, M.M. & Istaiteyeh, R.M.S. (2015). Financial performance of Islamic and conventional banks: Evidence from Jordan. Global Journal of Business Research, 9(3), 27-41.
- Narwal, K.P. & Pathneja, S. (2015). Determinants of productivity and profitability of Indian banking sector: A comparative study. Eurasian Journal of Business and Economics, 8(16), 35-58.
- Ongore, V.O. & Kusa, G.B. (2013). Determinants of financial performance of commercial banks in Kenya. International Journal of Economics and Financial Issues, 3(1), 237-252.
- Pandy, B. (2015). Impact of priority sector advances on bank profitability: Evidence from scheduled commercial banks of India, BVIMSR’s. Journal of Management Research, 7(2).
- Sarokolaei, M.A. (2012). A comparative study of Iranian banks' efficiency by using artificial neural networks and multi-linear regression. Second International Conference on Management and Artificial Intelligence, IPEDR, IACSIT Press, Singapore.
- Sharifi, O. & Akhter, J. (2016). Performance of banking through credit deposit ratio in public sector banks in India. International Journal of Research in Management & Technology, 6(4).