Research Article: 2020 Vol: 26 Issue: 3
Financial Technology Financial Inclusion and MSMEs Financing in The South West of Nigeria
Emmanuel Olayinka Oluwaseye, Covenant University
Abiola Ayopo Babajide, Covenant University
Adedoyin Isola Lawal, Landmark University
Areghan Akhanolu Isibor, Covenant University
Abstract
The Strategic role Micro, Small and Medium Enterprises (MSMEs) play in achieving sustainable development cannot be over emphasized in any given economy. Regrettably, the difficulty in accessing finance from the formal financial institutions remains the greatest problem to development and survival of MSMEs sector in Nigeria. In the light of this, this paper provided functional solutions by examining developments, innovations and new financing windows available to MSMEs viz-a-viz Financial Technology that is capable of enhancing the goal of financial inclusion as a strategic tool of achieving sustainable development in the MSMEs sector in Nigeria. We classify the methodologies and approaches the researchers have adopted to predict the impact of Financial Technology on financial inclusion in respect to MSMEs financing in the South West States of Nigeria. We notice that MSMEs financing has the potential to be the fourth largest sector to be disrupted by Financial Technology in the next five years after consumer banking, payments and investment/wealth management in the financial sector. We identify that financial institutions need to collaborate and capitalize on the Financial Technology ecosystems by leveraging on artificial intelligence, big data, data analytics and MSMEs friendly applications in effectively lending to MSMEs sector. We observe that Financial Technology has the potential to drive financial inclusion, with high internet, electricity and mobile phone penetration more states will achieve the 20% financial exclusion target faster by the year 2020. This study also provided recommendations for financial service providers, government and regulatory authorities for this emerging sector going forward.
Keywords
MSMEs, Financial Institution, Financial Inclusion, Financial Technology (FinTech), Sustainable Development.
Introduction
Africa has been classified to be the greatest unserved market which is not quite visible to the international financial ecosystem. Specifically, Nigeria has the privilege to develop itself as a major financial technology (FinTech) hubs that could significantly reshape the financial services ecosystem in the next five years (Elena Mesropyan, 2017). Hopefully, this has the capacity of enhancing the target of 20% financial exclusion by 2020 and also to reduce the finance gap in the MSMEs sector which is largely believed to be the engine of growth in economic development and job creation in Nigeria.
Importantly, the Nigeria economy has been quite responsive to Fintech innovations. This is visible by the huge growth in mobile money transactions as regards the monthly transaction volume of 5 million dollars in 2011 to 142.8 million dollars in 2016 (Elena Mesropyan, 2017). The ever-increasing FinTech operation is majorly connected to an increase in e-commence and smart phone penetrations. Almost 70 percent of Nigeria traders have mobile phones. Research has shown that 74 percent of them are willing to acquire knowledge of a new technology and that over 30 percent have difficulty in accessing credit from financial institutions (Achugamonu et al., 2019). It is relevant to also note that 56 percent of the traders try to source funds from friends and families; over 60 percent seek funds lower than N30,000.
The International Finance Corporation (IFC) estimated $2 trillion MSMEs funding gap in emerging market has been partly reduced through the intervention of leading FinTech platform, Lidya that started its operation from Nigeria, with $1.25 million seed funding round in Nigeria (Taiwo Hassan, 2017). Lidya has been able to accomplish this great feat as a result of a lot of introduction of technology, algorithms, artificial intelligence and machine learning in upgrading their credit assessment process. Recently, there has been increasing growth and awareness in promoting financial Inclusion in Nigeria. Generally, it is a known fact that about 40 percent Nigerians are presently financially excluded as the 2020 target of Central Bank of Nigeria (CBN) is 20%.
In February 2014, all banks in Nigeria came together to promote the unified biometric identification structure that is also known as Bank Verification Number (BVN) for the banking industry. Presently, all Peer-To-Peer (P2P) as one of the trendy platforms of FinTech, lenders leverage on BVN and other information for operating their lending models. It is also worthy to note that, the future of Nigeria’s Fintech landscape is quite big and colorful. Currently, there are about fifty six Fintech firms in Nigeria promoting access to financial products and platforms for inclusive growth (financial inclusion).
From our observations, examining whether financial technology innovations can boost financial inclusion and reduce MSMEs finance gap that can result to sustainable development in Nigeria qualifies for an intellectual discussion. This observation has motivated us to provide answer to the following research questions:
RQ1: Does the emergence of financial technology firms and their innovations have significant impact on the performance of financial inclusion in Nigeria?
RQ2: To what extent do the financial technology firms and their innovations reduce the finance gap in the MSMEs sector and the actualization of 20% financial exclusion in Nigeria by 2020?
The rest of the paper is divided into five sections. Immediately following this section is the literature review and then the research method and data of the study is explained in Section 3. The method of analysis is discussed in section 4, while Section 5 highlights The concluding remarks and recommendations.
Literature Review
Financial inclusion can be defined as strategic access to financial services by the populace, mostly the people that are considered as been financially disadvantaged (McAteer, 2008), (Ibeachu, 2010; Onaolapo & Odetayo, 2012). To have a bank account is not a sufficient evidence of financial inclusion. However, having access to all financial services required is the true test of the formal financial sector inclusiveness.
Ibeachu (2010); Onaolapo & Odetayo (2012) highlighted about six major types of financial exclusions;
1. Physical Access Exclusion: as a result of the inability to physically access banking premises due to any reason such as closure of bank branch, inaccessible roads, etc.
2. Access Exclusion: a customer might be considered as high risk in terms of loan repayment delinquency during credit assessment.
3. Condition Exclusion: this is when a customer cannot meet up with all conditions required to access loan.
4. Price Exclusion: this is when the cost of loan is high and unaffordable to the customer.
5. Market Exclusion: this is a situation where financial products are targeted at some individuals or group of people.
6. Self-Exclusion: this is where a person intentionally refuses to seek financial products and services for personal reasons.
Consequently, financial inclusion is viewed as the process that guarantees that a person's inflow of money is maximized; outflow of money is controlled and can operate with an informed choice through access to basic financial services (PCC Financial Inclusion Strategy, 2009).
Assessing the MSMEs Finance Gap
The steady growth of access to financial services and affordable loans by MSMEs has positive effects to the economy. However, the cause of exclusion for a lot of MSMEs from financial sector is characterized by factors such as high cost of borrowing, high cost of transaction, fund allocation preference by financial institutions to sectors of the economy that seems to yield high returns in the short run; lack of windows of financial institutions in certain locations especially the rural areas; inability to open an account with because of lack of adequate documentation requirements; insufficient collateral; huge account maintenance fees. These are general causes that automatically affect all sectors, including the MSMEs sector (Bruhn & Inessa, 2009; Abiola et al., 2019).
Traditional financial services providers, such as commercial banks, have limited geographical reach and are inaccessible to many of the 62% of Nigerian adults living in rural areas. They also have difficulty serving the mass market profitably, three out of five Nigerians (60%) report having incomes less than the national minimum wage of ₦18,000 per month (EFInA, 2016).
Achieving the national financial inclusion targets will require widespread use of finTech services or platforms–the provision of formal financial services through electronic channels. FinTech services include mobile money, mobile/internet banking, use of cards and Point-of-Sale (PoS) machines, and ATM services. The typically lower costs associated with the finTech services allow low income customers to transact in irregular, tiny amounts, helping them to manage their characteristically uneven income and expenses. Using agents to expand reach into under-served areas reduce costs and engage customers that are reluctant or unable to interact with banks. FinTech services providers can thus encourage mass-market customers to use technology for financial transactions that they currently use on an informal basis. For example, of the adults that own mobile phones: 14 million save at home, 16 million borrow money from family/friends, 6 million send money within Nigeria via family/friends, and 21 million would be interested in micro insurance (EFInA, 2016). FinTech services providers that build reliable, affordable services can capitalize on this market while improving the financial well-being of those that are currently under-served by the formal financial system viz-a-viz MSMEs sector.
Present State of Financial Technology Services in Nigeria.
Traditional financial services providers–commercial banks, microfinance banks, insurance providers, etc. Have been expanding their digital offerings in Nigeria, enabling customers to conduct more transactions via mobile phones, internet, and ATMs. New financial technology companies are also deploying digital financial solutions to the market. New partnerships have been emerging, such as the Nigeria Inter-bank Settlement System (NIBSS) working with commercial banks in Nigeria to offer mobile payments via the mCash solution. EFInA’s Access to Financial Services in Nigeria 2016 survey showed that use of FinTech services have continued to increase, although incrementally in some areas:
Payments
12 million Nigerian adults (12% of adults) use electronic channels (cards, mobile banking, internet banking or mobile money) to pay for goods, services or bills. The number of adults using e-payments for goods, services or bills more than doubled between 2014 and 2016, increasing from 6 million to 12 million. The most significant growth in an e-payment channel during this time period was seen in use of ATM/debit cards; the number of adults that use ATM/debit cards for payments increased by 6 million between 2014 and 2016, to a total of 11m in 2016 ( EFInA, 2016). Supply side data shows similar rapid growth related to use of point-of-sale (PoS) machines; the volume of PoS transactions more than doubled between July 2016 and July 2017 (from 5 million to 13 million), and the value of transactions nearly doubled, from ₦59 billion in July 2016 to ₦117 billion in July 2017 (NIBSS PoS Report).
Money Transfers
Nearly one fifth of Nigerian adults –19 million, or 20% of adults–say that they have sent money to friends or family within Nigeria in the past six months. Nigerians most commonly use bank transfers –including transfers processed over-the-counter and via electronic channels – to send money within Nigeria; bank transfers are used by 12 million adults sending money. The next most common way to send money within Nigeria is via a family member or friend, used by 8 million adults. Less than 1% of those that sent money within Nigeria used cash/prepaid cards or mobile money to send money.
Nearly one third of Nigerian adults–32 million, or 33% of adults–say that they have received money from friends or family members within Nigeria in the prior six months. Most of those that have received money recently report having received money via a family member/friend (18 million), followed by bank transfers (15 million). Less than 1% of recipients received money via cash/prepaid cards or mobile money (EFInA, 2016).
Mobile Money
Mobile money usage remains low compared with use of other financial services in Nigeria. In 2016, 1 million adults used mobile money, almost unchanged from the number of mobile money users in 2014. Awareness of mobile money grew; in 2016, 16% of adults were aware of mobile money, up from 13% in 2014 (EFInA, 2016).
As of mid-2017, there were 23 licensed mobile money operators, some bank-led and some independent. Although the mobile network operators are precluded under current regulations from directly providing mobile money services, some are partnering with other licensed providers to launch joint mobile money solutions or are preparing to provide super-agent services to licensed providers.
Problems associated to Expanding Financial Technology Services in Nigeria
There are some common problems associated to the widespread deployment of various financial technology services in Nigeria as follows:
Infrastructure and Technology
Without reliable internet and cellular network services, or even consistent access to electricity, it is difficult for FinTech services to be consistently available and reliable. While mobile network operators are investing in expanding network coverage, they point to poor infrastructure, including electricity shortages and poor roads, as well as regulatory hurdles and security constraints as challenges in expanding coverage more fully, particularly to rural areas (GSMA: “Digital inclusion and the role of mobile in Nigeria”). Many mobile money operators around the world rushed to deploy mobile money services and were later limited by shortcomings in the underlying technology (GSMA, ‘Platform for Successful Mobile Money Services”).
Access Points
Customers cannot transact with e-wallets unless they can load them with value. Access points, such as bank branches, ATMs or agents, are essential for a functioning FinTech ecosystem, and yet the ratio of financial access points to adults in Nigeria remains low, particularly in rural areas. A geospatial mapping exercise found that there are approximately 17 active financial access points per 100,000 adults in Nigeria, compared with 181 in Kenya, 116 in Uganda and 44 in Bangladesh. In Nigeria, the ratio of access points is lowest in the North West and North East zones, with 10 and 11 access points per 100,000 adults, respectively (www.fspmaps.com). Less than half of Nigerian adults are aware of a bank branch within 30 minutes of where they live or work (EFInA, 2016).
Cost and Value Proposition
FinTech services will not take off unless the right value proposition is in place for the customer, agent, merchant and company providing the service. For customers, this means that the new service needs to be compelling enough–and reliable enough–to justify any fees associated with it.
Financial services providers are also confronted with significant costs in order to deploy new digital financial solutions: investing in enabling technology, product design, building customer awareness, etc. Even successful mobile money deployments can take a minimum of three to five years before they are profitable (McKinsey, “Mobile Money: Getting to Scale in Emerging Markets”).
Customer Awareness and Trust
For customers to use digital financial services, they first need to be aware that they exist, and then need to understand and trust the services, particularly for services such as saving and transferring money. Although mobile money awareness has increased, 84% of Nigerian adults still have not heard of mobile money (EFInA, 2016). When EFInA conducted a survey of mobile money agents in November 2015, the most common challenges cited were low awareness and usage of mobile money. (EFInA Mobile Money Agent Survey). Some customers are slow to trust FinTech services given general awareness about scamming, lack of familiarity with new services, and knowledge of past failures in the financial sector.
Prospects of Financial Technology Innovations in MSMEs Financing in Nigeria
FinTech has a huge opportunity to become a strategic platform in the funding of MSMEs operations to a large extent (World Economic Forum, 2016). Nigeria’s market size and levels of financial activity present an ideal market opportunity for providers that are able to overcome challenges and identify the right products for the mass market (EFInA, 2016). FinTech innovations have enabled Big Data Analytics, Algorithmic trading and applications of Block Chain Technology (Mundra, 2017); and their variants that has the capacity of enhancing the accomplishment of the 20% financial exclusion target of CBN by 2020. In the light of this, financial technology innovations and the need for emerging collaboration opportunities for banks with FinTech players for MSMEs financing can never be over emphasized in Nigeria.
On a global scale, International Financial Corporation (2017) stated that there is a funding gap of $ 2.1 to 2.6 trillion exist for all formal and informal MSMEs in emerging markets alone, which is equivalent to 30 to 36 per cent of current outstanding MSMEs credit. World Bank Group (2016) highlighted four (4) disruptions and developments to enhance FinTech operations for Financial Inclusion as follows:
1. Disruption of the Value Chain: New entrants, for example non-banks and non-MNOs (Mobile Network Operators), will hugely offer financial products and platforms directly to customers.
2. Creating of Platforms and Application Programming Interfaces (APIs): APIs empower new applications to be created on top of pre-existing products, thereby leveraging on the product’s existing customer strength.
3. The Use of Alternative Information: Data that are collected digitally, including e-commerce and mobile transactions histories, can support or substitute traditional ways of client identification and credit risk assessment processes.
4. Customization: Improved data collection and analytics promote accurate workflow, customer segmentation and human-centered product design. Such as visible user interfaces and notices to consumers.
The G20 governments also highlighted Eight (8) strategic High Level Principles (HLPs) aimed to promote country-level actions to significantly drive Financial Inclusion using Financial Technology as follows:
PRINCIPLE 1: Promoting a complete Digital Approach to Financial Inclusion.
PRINCIPLE 2: Balancing Innovations and Risk to achieve digital Financial Inclusion.
PRINCIPLE 3: Providing an Enabling and Proportionate Legal and Regulatory Framework for Digital Financial Inclusion.
PRINCIPLE 4: Expanding the Digital Financial Services Infrastructure Landscape.
PRINCIPLE 5: Establishing Responsible Digital Financial Practices to Protect Consumers.
PRINCIPLE 6: Strengthening Digital and Financial Literacy and Awareness.
PRINCIPLE 7: Facilitating Customer Identification for Digital Financial Services.
PRINCIPLE 8: Tracking Digital Financial Inclusion Progress going forward.
MSMEs lending being a hugely underserved market is a major opportunity for FinTech firms or start-ups to build and scale up sustainable businesses by offering FinTech services. However, over the past few years, a number of products and business models have emerged, catering for the needs of MSMEs. FinTech has created major innovations with the opportunity to significantly promote MSMEs’ access to finance. It will be noted here that the boundaries are sometimes fluid. However, four key FinTech innovative products or platforms for funding MSMEs are highlighted in this paper. Strategically engaging these innovations can have huge positive effects on the framework and transformation of an MSME’s balance sheet situation, empowering MSMEs with abundant cash, improved working capital and more stable and secure funding (World Economic Forum, 2016).
Marketplace Lending (Peer- to-Peer)
The first platform was launched in 2005, peer-to-peer (P2P) lending has come to stay and is now a global market with alot of different business models and huge estimated future growth rates. Simply, marketplace lending is the practice of lending money to borrowers and MSMEs outside the traditional financial intermediary such as a bank. Marketplace lenders are strategically positioned to provide an innovative solution where banks are unable to do so. This is because of a number of cumbersome features in their operating model which are completely different in the FinTech ecosystem.
Unsecured lending is the commonest feature of marketplace lending today where no collateral is required. Second, Marketplace lenders do not operate with insured and hugely regulated depositor’s money. Rather, their sources of funding include retail and institutional investors with a greater risk appetite. Third, marketplace lenders engage innovative credit scoring models. These models are essentially data- driven, employ semi-automated risk assessment methods and leverage on nontraditional data collections. The fourth factor is that FinTech providers’ operation is with a little operational set-up, without branches and less personal to make underwriting decisions. Finally, marketplace lenders are not faced with the same level of compliance, regulatory obligations and capital requirements as their brick-and-mortar counterparts, which automatically adds up to a non negligible part of their competitive edge (World Economic Forum, 2015).
E-commerce and Merchants finance
There has been new entrants since 2012 in the field of MSMEs lending, this include e-commerce platforms, payment processors and telecom companies. The MSMEs that are selling their goods on platforms such as Amazon, Ebay or Alibaba are now provided with innovative working capital lines and loans by those platform. We have Payment Processors (e.g. square or Izettle) who started to provide similar services in 2014, and telecom companies, such as Safaricom or telmex, have strategically moved into the loan business, commencing in frontier markets (World Economic Forum, 2015).
It is observed that Payment processors and e-commerce platform may often be better placed than banks or the innovative marketplace lenders to assess the risk of advancing money to small merchant’s day to day operations. Their collection process is facilitated greatly, as payments to the merchants pass through their systems. With FinTech innovations, processers are well positioned to take loan repayments directly out of the revenue of the small retailers. From the view point of the merchants, the process is convenient, as payment systems are already integrated. A contractual relationship is in place so that the extension of credit can be perfected in a speedy and efficient manner. Reports have it that, the time between the application and payout of funds is often only one business day (Fortune, 2015a).
Invoice Finance
Credit sales of businesses stand as receivables outstanding on the balance sheet. For years, businesses have embarked on selling those receivables to a third party (known as “factor”) to upgrade their cash position. The factor will purchase the receivables at a discount against instant cash payment, and a fewer retainer the moment the customer has paid. This kind of arrangement, known as factoring, is expected to grow at the rate of 10-12% each year (Abbruzzese, 2014).
Trade Finance
It is amazing to know that little has been made available in terms of knowledge about another great market that has been majorly abandoned or untouched from disruption by emerging FinTech players which is known as Trade Finance. It is estimated that the volume of trade finance yearly is greater than five times the volume of US dollars in circulation (Bank of International Settlements, 2014).
Trade finance is obviously estimated to grow even bigger. The progress in information technology must greatly be applauded; business transaction beyond borders is more feasible than ever. With the aid of online marketplace, MSMEs can project their goods and services to a global marketplace at virtually no costs.
Trade finance for MSMEs has majorly been restricted. They do not have adequate resources to face the complex process and in most case banks do not offer lines of trade credit to MSMEs. Considering the huge risk of large international transactions and providing liquidity ahead, this also exceeds the financial strength of many MSMEs. Resultantly, many MSMEs are denied the opportunity of selling their goods in the international markets (ICC, 2014).
Trade finance stands to be a huge market with great potential for innovative players. With the possibility of improved data and analysis of exposures, there will be reduction of losses for companies ready to maximize big data. Going forward, the internet of things may allow for the real –time tracking of goods removing several process steps and reducing the risks for the parties involved (Santander Innoventures, 2015). Consequently, new players armed with innovative business models and solutions will definitely be enabled to offer MSMEs opportunities and platforms to compete favorably in the international markets and for them to tap into a massive revenue pool to a large extent.
Research Methods and data
This study employed survey research design applying both exploratory and explanatory strategy. The exploratory aspect helps to find out the extent to which Fin Tech spur financial inclusion among MSME operators in the study area different and the extent to which perceived benefit from FinTech is associated with financial inclusion. The study target MSME operators such as retail trader, shop owners, artisans, micro manufacturers, fashion designer, cab operators etc. This study also employed quantitative techniques which is designed to capture effects and impact in comparison to existing theories quantitative data (Creswell, 2014; Adebayo, et al., 2019). This study employed primary in order to provide a better detailed perspective for a proper understanding of a subject of this nature.
The population for the study is all MSME owner users of digital finance in three (3) South Western states of Lagos, Ogun and Oyo States. The three states have high banking sector presence because of Lagos state which is the commercial nerve center for the country, the zone has high spread of deposit money banks and other financial institution such as the microfinance bank, mortgage bank, development banks, finance house, discount house, pension managers, insurance company and bureau de change compared to other states in the country. A sample of 600 MSME operators was drawn from the population of the three states and three hundred and Ninety-six (396) were useful of the samples returned. The sample was drawn from population of self- employed MSME operators using simple random sampling technique. The data was collected between May and September 2017 across the three states.
The instrument for data collection is a well-structured questionnaire and document review to gather primary data. The questionnaire is suitable for survey research. The questionnaire is divided into two sections, section A covered the social economic demographics of the respondents such as age, gender, marital status, level of education, number of children, business location, kind of business, type of income, years of experience, source of income, etc. The section B of the questionnaire covered FinTech and financial inclusion factors found in literature such as, account ownership, account usage and frequency of usage, perceived benefit and other bank support MSME operators benefit.
A reliability test was carried out on the instrument through a pilot test. Forty (40) copies of the questionnaire were sent to the respondents to ascertain if the instrument really tested what it is meant to test. The internal consistency of the questionnaire items was ascertained with Cronbach Alpha statistic, the result obtained was 0.769 which indicated that the instrument is reliable and consistence with what it was meant to measure. Confirmatory Factor Analysis (CFA)was used to assess the scale validity and the fit of the instrument. The convergent phase was adopted for the validation of the research items. The study adopted three (3) conditions to assess convergent validity, one, the loading indicate that all scale and measurement items are significant and exceed the minimum value criterion of 0.70, two, each construct Composite Reliability (CR) exceeds 0.80, and three, each construct Average Variance Extracted Estimate (AVE) exceeds 0.50. From the result obtained all the conditions were fully met for the items used for the study. Items that do not meet the conditions were dropped and not use in the analysis.
Method of Analysis
Binary logistic model is given as;
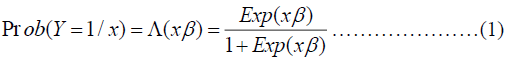
Where, ᴧ indicates a link function. Stepwise selection option may be applied, likelihood ratio test are performed to test the significance of the model coefficient. The fitted model may be plotted and predictions generated from it. Usually residual are identified and model.
In specific form, equation three transform to

Where ʎ is linearly dependent on the variable hypothesized to effect the probability 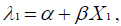 the probability thus varies from 0 to 1
 ) , and the model is simplifies by
rearranging into log of the odd,
) , and the model is simplifies by
rearranging into log of the odd,

Which consists of individual outcome and can be estimated with maximum likelihood. Interpretation can then be done by reverting back to the probabilities interacted with financial inclusion variables in likelihood to open a bank account if a probable function of many covariates as specified below.

The dependent variable is a measure of account ownership, and frequency of usage (number of withdrawal in a month);
X = a vector of explanatory variables of individual level characteristic and financial technology on financial inclusion.
X1, X2, X3,…,…,…,…,xn are independent variables (age, level of education, Marital Status, Gender, Nature of Business, size of household, sources of income, account type, type of transaction, years of account usage, perceived support, perceived value to life, etc).
b1, b2, b3, …, …, …, …, bn are regression coefficients which determine the contribution of the independent variables (Table 1).
| Table 1 Measurement of Variables | ||||
| Hypothesis 1, 2, 3 | ||||
| S/N | Variables | Description and Measurement | Expected Sign on impact | Apriori |
| Account Ownership Dependent variable | 1 is assign if respondent has personal account or with someone in a formal financial service institution such as bank, microfinance, insurance, pension, cooperative etc. 0 is assigned is otherwise | |||
| Independent Variables | ||||
| 1. | Age | 1 is assigned if within age bracket Age 16 – 19, otherwise 0, 1 is assigned if within age bracket Age 20-40, otherwise 0, 1 assigned if within age bracket Age 41- 60, otherwise 0, 1 is assigned if above 60 years, otherwise 0. | + | β1 > 0 |
| 2. | Gender | 1 is assigned if respondent is Male, otherwise 0, 1 is assigned if respondent is female, otherwise 0 | + | Β2 > 0 |
| 3. | Marital Status | Single 1, otherwise 0, married 1 otherwise 0, widowed 1 otherwise 0, divorced 1 otherwise 0, separated 1 otherwise 0. | + | Β3 > 0 |
| 4. | Level of education | No formal education 1, otherwise 0, primary education completed, otherwise 0, Secondary education completed otherwise 0, post secondary education completed otherwise 0. | + | Β4 > 0 |
| 5. | Residing state | Lagos 1, otherwise 0, Ogun 1, otherwise 0, Oyo 1 otherwise 0, Osun 1 otherwise 0, Ondo 1 otherwise 0, Ekiti 1 otherwise 0. | + | Β5 > 0 |
| 6. | Distance to banking institution | If too far to banking institution is reported 1 is assigned, otherwise 0, 1 if fairly far is reported, otherwise 0, 1 is assigned not too far is reported, otherwise 0. | +/- | Β6> 0 |
| 7. | Internet/mobile phone penetration in state | 1 is assigned if adequate coverage is reported, 0 if otherwise | + | Β7> 0 |
| 8. | State government policy on financial inclusion | 1 is assigned if there are delibrate state government policy to enhance financial inclusion, otherwise 0, I don’t know 1, otherwise 1 | + | Β8> 0 |
| 9. | Type of bank account owned | Savings account 1, otherwise 0, current/loan account 1, otherwise 0, others 1, otherwise 0 | + | |
| 10. | Type of transaction performed regularly | Save 1, otherwise 0, receive money 1, otherwise 0, pay back loan 1, otherwise 0, pay bills 1, otherwise 0 | + | |
| 11. | Frequency of usage on withdrawal | Three times or more in a month 1, otherwise 0, less than three times in a month 1, other wise 1 | + | |
| 12 | When did you open the account | Years specified | + | |
| 13 | Do you use other financial services apart from traditional banking transaction | Yes 1, otherwise 0, No 1, otherwise 0 | + | |
| 14 | Is the maintenance fee appropriate for you? | Yes 1, otherwise 0, No 1 otherwise 0 | + | |
| 15 | I get additional support from my bank for using my type of account | Yes 1, otherwise 0, No 1, Otherwise 0 | + | |
| 16 | Does opening a bank account add any value to your life | Yes 1 , otherwise 0, No 1, otherwise 0 | ||
Table 2 shows that of the 396 total respondents, 294 (74 percent) own bank account with a formal institution, while 102 (26 percent) do not own bank account. Of the 294, 178 (61 percent) are male gender, 116 (39 percent) are female gender. This is expected global survey result (Allen et al., 2016) show that male adult is more likely to own formal bank account than female gender. The table also show that account ownership is higher with age group 20–40, 125 (43 percent), follow by age group 41–60, 82 (28 percent), age group 16–19, 19 percent and 11 percent. Account ownership is also higher among married individual (63 percent), follow by single individual (36 percent), while widowed individual and divorced/separated individual show 6 percent each. Level of education is shown to have high correlation with financial inclusion (Allen et al., 2016; Zinc & Weills, 2016; Demirguc–Kunt et al., 2012; Klapper et al., 2014). Our result shows that account ownership is higher with respondents with post- secondary school qualification (35 percent), then respondents with secondary education 30 percent, while respondents with primary education and no formal education are 20 and 16 percent respectively. Account ownership is higher with respondents in the urban area (66 percent) and lower with respondents in the rural area (34 percent), this is expected because financial inclusion penetration is higher in areas with high banking infrastructure which is evident in the urban area than rural area (Demirguc-Kunt, 2012; Becks et al., 2013).
| Table 2 Social Economic Profile of Respondent and Account Ownership | |||||
| Demograghics Individual Level Characteristic |
Do you have a bank Account? | ||||
| Yes | % | No | % | Total | |
| Male | 178 | 61 | 56 | 55 | 234 |
| Female | 116 | 39 | 46 | 45 | 162 |
| Age group 16 – 19 years | 56 | 19 | 20 | 20 | 92 |
| Age group 20 – 40 years | 125 | 43 | 49 | 48 | 184 |
| Age group 41 – 60 years | 82 | 28 | 29 | 28 | 85 |
| Age group Above 60 years | 31 | 11 | 4 | 4 | 35 |
| Single | 105 | 36 | 26 | 25 | 131 |
| Married | 155 | 53 | 67 | 66 | 222 |
| Widowed | 17 | 6 | 7 | 7 | 24 |
| Seperated/Divorce | 17 | 6 | 2 | 2 | 19 |
| No formal Education | 47 | 16 | 20 | 20 | 67 |
| Primary education | 58 | 20 | 11 | 11 | 69 |
| Secondary School Education | 87 | 30 | 29 | 28 | 116 |
| Post Secondary School Education | 102 | 35 | 42 | 41 | 144 |
| Rural Area | 101 | 34 | 38 | 37 | 139 |
| Urban Area | 193 | 66 | 64 | 63 | 257 |
| Lagos State | 126 | 43 | 32 | 31 | 158 |
| Ogun State | 102 | 35 | 30 | 29 | 132 |
| Oyo State | 66 | 22 | 40 | 39 | 106 |
| Number in house hold 2-5 | 114 | 39 | 37 | 36 | 151 |
| Number in household 5 -10 | 100 | 34 | 28 | 27 | 128 |
| Number in Household above 10 | 80 | 27 | 37 | 36 | 117 |
| Source of income 1 | 36 | 12 | 26 | 25 | 62 |
| Source of Income 2-3 | 155 | 53 | 46 | 45 | 201 |
| Source of income 4-5 | 103 | 35 | 30 | 29 | 133 |
| Nature of Business – Trading | 136 | 46 | 26 | 25 | 162 |
| Nature of Business – Manufacturing | 56 | 19 | 22 | 22 | 78 |
| Nature of Business – Service | 47 | 16 | 34 | 33 | 81 |
| Nature of Business – Artisan | 35 | 12 | 10 | 10 | 45 |
| Nature of Business – Agriculture | 30 | 10 | 10 | 10 | 40 |
| Age of Business – Less than 1 | 40 | 14 | 36 | 35 | 76 |
| Age of Business – 2 – 5 years | 102 | 35 | 20 | 20 | 122 |
| Age of Business – 5 – 10 years | 87 | 30 | 25 | 25 | 112 |
| Age of Business Above 10 years | 65 | 22 | 21 | 21 | 61 |
Account ownership is higher with respondents living in Lagos (43 percent), then Ogun (35 percent) and Oyo State (22 percent) respectively. This is expected because Lagos has high presence of banks spread among the three states. Account ownership is higher with household with lesser number people 2- 5 (39 percent), and lower with household with higher number of people above 10 (27 percent). Account ownership is higher with respondents with multiple sources of income 2-3 (53 percent) and multiple sources of income 4–5 (35 percent). This is understandable since many SME owners now embrace financial inclusion with the take off of cashless policy in South west region. Account ownership is higher with respondents in trading business (46 percent), follow by respondent in manufacturing business (19 percent) and respondents in Service business (16 percent). While, Artisans and respondents in Agriculture business show 12 and 10 percent respectively. Account ownership which is our proxy for financial inclusion is higher with respondents with longer business age 2-5 years (35 percent), and 5–10 years (30 percent), but surprisingly decline with longer years of experience. Probably, respondents with longer years of experience are not dominant in the sample.
Table 3 above show logistic regression result for financial inclusion proxy as account ownership. Account ownership here is define as “I own personal account or together with someone in a formal institution’ (column 1) and frequency of usage define here as ‘I make withdrawal at least three times in a month’ either through any channel of withdrawal ATM, PoS, transfers’. Withdrawal is self-dependent unlike deposit that has to be initiated by another person. Column I show result of Account ownership and Column II show result of frequency of usage interacted with financial technology and other variables.
| Table 3 Logistic Regression Analysis of Financial Inclusion and Financial Technology | ||||||||
| Column 1 Account Ownership Exp(B) |
Column II Frequency of Usage Exp (B) |
|||||||
| Coeff | Wald | Sig | Odd-ratio | Coeff | Wald | Sig | Odd-ratio | |
| Digital Finance | 1.552 | 3.776 | 0.012** | 7.467 | 0.238 | 2.819 | 0.073* | 6.176 |
| Internet Banking | 0.781 | 2.135 | 0.018** | 3.545 | 0.887 | 3.245 | 0.034 ** | 3.746 |
| Type of Account (credit) | 1.276 | 0.412 | 0.101 | 1.273 | 0.613 | 1.212 | 0.177 | 1.775 |
| Type of Account (Savings) | 1.051 | 2.775 | 0.019** | 4.167 | 0.198 | 1.990 | 0.022** | 2.676 |
| Age in Bus(>5yr | 3.125 | 1.182 | 0.005*** | 5.702 | 0.819 | 2.118 | 0.041** | 1.643 |
| Get bank Support | 3.742 | 4.360 | 0.037** | 4.340 | 0.373 | 0.783 | 0.222 | 1.676 |
| Increase in Bus Profit (Yes) | 0.737 | 1.154 | 0.042** | 2.830 | 1.003 | 3.114 | 0.029** | 0.631 |
| Age group 20 – 35 years | 4.355 | 2.341 | 0.014** | 1.152 | 0.807 | 2.641 | 0.009** | 2.931 |
| Age group 36 – 60 | 0.119 | 2.717 | 0.114 | 0.877 | 1.051 | 2.775 | 0.019** | 4.167 |
| Gender Male | 1.131 | 1.215 | 0.016** | 2.589 | 0.671 | 1.324 | 0.041** | 1.991 |
| Gender Female | 0.031 | 1.415 | 0.013** | 0.987 | 0.671 | 1.324 | 0.031** | 1.397 |
| Location Rural | -.331 | 0.611 | 0.298 | 1.277 | -0.718 | 2.231 | 0.454 | 1.556 |
| Trading Business | 0.719 | 1.117 | 0.053** | 3.605 | 0.119 | 2.717 | 0.114 | 0.877 |
| Manufacturing Bz | 1.212 | 1.900 | 0.090 * | 1.562 | 0.561 | 1.554 | 0.083* | 1.778 |
| Agricultural Bus | 0.371 | 0.873 | 0.122 | 0.276 | 1.276 | 0.214 | 0.110 | 0.173 |
| Type of Bank (Microfinance) | 0.421 | 0.319 | 0.121 | 0.415 | -0.113 | 0.417 | 0.323 | 2.075 |
| Type of Bank (DMB) | 0.405 | 1.897 | 0.005*** | 2.116 | 0.137 | 1.012 | 0.081* | 0.554 |
| Ominibus Tests of model Coefficients | Chi-square Sig. 62.012 0.000 |
Chi-square Sig. 53.313 0.000 |
||||||
| Pseudo R Squared | Cox & Snell Nagelkerke 58.7 71.8 |
Cox & Snell Nagelkerke 55.7 63.5 |
||||||
| Hosmer &Lemeshow Test | 0.716 | 0.683 | ||||||
| Overall Percentage | 85.9 | 76.2 | ||||||
| Observations | 396 | 396 | ||||||
The result obtained show that MSME owners that use FinTech services are 7.4 times more likely to own a bank account in a formal institution and they are 6.1 times more likely to use their bank account frequently, the result is significant at 5 and 10 percent respectively. Those who use internet banking are 3.5 times more likely to own bank account, and 3.7 times more likely to use the bank account more frequently, the result is also significant at 5 percent significant level. The result on type of account (credit) is positively correlated with financial inclusion but it is not statistically significant for the two proxies of financial inclusion. Type of account (savings) result show that MSMEs owners who use savings account are 4.1 times more likely to own bank account and 2.6 times more likely to use the account more frequently, the result is significant at 5 percent significant level. Those who have been in business for more than five years are 5.7 times more likely to own bank account and 1.6 times more likely to use their bank account more frequently, the result is statistically significant at 10 and 5 percent respectively. Those who perceived they get other support from their bank for their business are 4.3 times more likely to own a bank account and 0.8 times more likely to use their bank account more frequently, the result is significant at 5 percent for account ownership but not statistically significant for frequency of account usage. Those who perceive that the use of a bank account increases their business profit are 2.8times more likely to own a bank account and 0.6 times more likely to use their bank account more frequently, the result is significant at 5 percent respectively.
MSME owners who are within the age group of 20–35 years are 1.1 times more likely to own a bank account and 2.9 times more likely to use their account more frequently, the result is significant at 5 percent. Age group 36–60 are 0.8 times more likely to own a bank account but the result is not significant. On frequency of usage, the result show that MSMEs owner within the age group are 4.1 times more likely to use their account more frequently (Fungacove & Weill, 2015; Zins & Weill, 2016; Allen et al, 2016; Demirguc-Kunt & Klapper (2012) all found age, gender, and location as significant determinant of financial inclusion. Male Entrepreneurs are 2.9 times more likely to own a bank account and 1.9 times more likely to use their bank account more frequently. Female entrepreneurs are 0.9 times more likely to own a bank account and 1.3 times more likely to use their bank account frequently, the results are significant at 5 percent. The result on location show that MSME owners in the rural location are less likely own or use bank account frequently, the result is not statistically significant. Entrepreneurs in trading business are 3.6 times more likely to own bank account and 0.8 times more likely to use their bank account frequently, the result is significant at 5 percent for account ownership and not significant for frequency of account usage. Entrepreneurs in manufacturing business are 1.5 times more likely to own a bank account and 1.7 times more likely to use their bank more frequently, the result is significant at 10 percent. Entrepreneurs in Agriculture business are 0.2 time more likely to own a bank account and 0.1 times more likely to use their bank account more frequently, but the result is not significant. Entrepreneurs who use microfinance bank are 0.4 times more likely to own a bank account and 2.0times less likely to use their bank account frequently, the result is not statistically significant. Those who use deposit money bank are 2.1 times more likely to own bank account and 0.5times more likely to use their bank account more frequently. The result is significant at 1 and 10 percent in respectively.
The models ‘goodness of fit’ test is shown in block 1 Omnibus test of model coefficient, model 1 (Account ownership)shows chi square of 62.012 and significant p<.0005 and model 2 (Frequency of usage) 53.313 with significant level P<.0005 with five degree of freedom. The model summary shows the Cox & Snell R Square and the Nagelkerke R Square which indicate the amount of variation in the dependent variable explain by the explanatory variable. Model 1 shows that between 58.7 and 71.8 percent of the dependent variable is explained by the explanatory variables and model 2 shows that between 55.7 and 63.5 of the dependent variable is explained by the independent variables. The classification table show overall percentage, which implies that the model correctly classified 0.716 cases in model 1 and 0.683 cases in model 2. The positive and negative predictive value for model 1 is 76 percent and 75 percent respectively, while the positive and negative predictive value for model 2 is 85.5 and 68.5 respectively.
Summary, Conclusion and Recommendations
The attention of the public has been centered on the emergence of FinTech recently for a good reason. With the appropriate environment, FinTech can turn out to be one of the most innovative tools to boost MSMEs and ultimately promote sustainable economic development. It is clearly observed, that marketplace lending solutions with other products present huge potential to improve the funding of MSMEs, with the availability of institutional capital. By the integration of all of these product lines into the entire FinTech ecosystem, MSMEs will be able to take advantage of these solutions that were previously only available to bigger companies in Nigeria going forward.
The paper has critically examined the present state of MSMEs finance gap in Nigeria and provided functional solutions by examining the developments, innovations and new financing windows available to MSMEs in enhancing the 20% financial exclusion by 2020 in Nigeria.
The findings from the study show that the present state of the expansion of FinTech innovations, platforms and services cannot enhance the actualization of the 20% financial exclusion target by 2020.
It is based on these findings that we recommend for financial services providers, government and regulatory authorities the followings in other to achieve the 20% financial exclusion target by 2020:
1. Regulators and operators must ensure to follow customer-centric approaches for FinTech services.
2. The deployment of a widespread and strong agent networks for FinTech Services will be essentially required and must be sustainable as well.
3. The government and regulatory bodies will be expected to invest heavily in an enabling technology innovations for FinTech Services such as high internet, constant electricity and increasing mobile penetrations.
4. The expansion of FinTech services across Nigeria will require a strategic and innovative partnerships and collaborations among different players, operators, competitors and all service providers to a large extent at all levels.
5. Regulators and government bodies must ensure that right fee structures for FinTech Services are adequately maintained.
6. Service providers and regulators must seek for ways to create incentives for the use of FinTech services to encourage optimal patronage from the populace at large.
References
- Abbruzzese, J. (2014).&nbsli; Fundbox Looks to Streamline the $74 Trillion B2B Invoice Market. Mashable. Available online at httli://mashable.com/2014/04/10/fundbox-streamline-b2b-invoice-market/.
- Abiola, B., Adedoyin, L., Umoren, G., &amli; Isibor, A. (2019). Financial inclusion in Nigeria: lirosliect, issues and challenges. liroceedings of the 33rd International Business Information Management Association Conference, IBIMA 2019: Education Excellence and Innovation Management through Vision 2020.
- Achugamonu, B.U., Adegbite, E.O., Omankhenlen, A.E., Okoye, L.U., &amli; Isibor, A. (2019). Dynamics of digital finance and financial inclusion nexus in sub-Saharan Africa. liroceedings of the 33rd International Business Information Management Association Conference, IBIMA 2019: Education Excellence and Innovation Management through Vision 2020.
- Adebayo, M., Imhonolii, D., Iruonagbe, T., Ozoya, M., &amli; Isibor, A. (2019). An overview on the imliact of rewards and recognition in retaining university lecturers. liroceedings of the 33rd International Business Information Management Association Conference, IBIMA 2019: Education Excellence and Innovation Management through Vision 2020.
- Allen, F., Demirgüç-Kunt, A., Klalilier, L., &amli; Martinez lieria, M.S. (2016). The Foundations of Financial Inclusion: Understanding Ownershili and Use of Formal Accounts. Journal of Financial Intermediation, 27(9), 1–30.
- Babajide, A.A., Adegboye, F.B., &amli; Omankhanlen, A.E. (2015). Financial Inclusion and Economic Growth in Nigeria. International Journal of Economics and Financial Issues, 5(3), 1–12.
- Bank for International Settlements (2014): Trade Finance: Develoliment and Issues, CGFS lialiers, No. 50. Basel: BIS. Available online at httli://www.worldcat.org/oclc/870920480.
- Beck, T., Demirgüç-Kunt, A., &amli; liería, M. (2008). Banking services for everyone? Barriers to bank access and use around the world. World Bank Economic Review, 22(3), 397–430.
- Beck, T., Demirgüç-Kunt, A., Levine, M.C., &amli; Feyen, E. (2013). World Bank Financial Develoliment and Structure Dataset. httli://go.worldbank.org/ X23UD9QUX0.
- Bruhn, M., Inessa, L. (2009): The Economic Imliact of Banking the Unbanked: Evidence from Mexico: World Bank liolicy Research Working lialier.
- CGAli, “Finding “Win-Win” in Digitally – Delivered Consumer Credit”.
- Creswell, J. W. (2014). Research Design: Qualitative, Quantitative and Mixed Methods Aliliroaches (4th ed.). London: Sage liublications Ltd.
- Demirguc-Kunt, A and Klalilier, L. (2012). Measuring financial inclusion : the Global Findex Database (English). liolicy Research working lialier ; no. WliS 6025; lialier is funded by the Knowledge for Change lirogram (KCli). Washington, DC: World Bank. httli://documents.worldbank.org/curated/en/453121468331738740/Measuring-financial-inclusion-the-Global-Findex-Database
- EFInA, (2016). Access to Financial Services in Nigeria 2016 Survey. Available online at www.EFInA.org.ng
- EFInA, “Assessing the Imliact of Financial Inclusion liolicies on Deliending Financial Inclusion in Nigeria: Sulilily Side liersliectives”.&nbsli; Available online at www.EFInA.org.ng
- EFInA, Mobile Money &amli; E-liayment Survey. Available online at www.EFInA.org.ng
- EFInA, Mobile Money Agent Survey. Available online at www.EFInA.org.ng
- Elena Mesroliyan (2017). 56 FinTech Comlianies in Nigeria Extending Access to Financial liroducts for Inclusive Growth.
- Fortune (2015). Square Caliital is advancing $1 million lier day to small businesses. Available online at httli://www.fortune.com/2015/08/05/square-caliital-is-advancing-1-million-lier-day-to-small-businesses/.
- FSli MAliS. Available online at www.fslimalis.com
- Fungáčová, Z., &amli; Weill, L. (2014). Understanding financial inclusion in China. China Economic Review, 34, 196–206. httlis://doi.org/10.1016/j.chieco.2014.12.004
- GSMA: “Digital Inclusive and role of Mobile in Nigeria”
- GSMA: “lilatform for successful Mobile Money Services”
- Human Center Design Available online at httli://www.designkit.org/human-centered-design
- Ibeachu, E.H. (2010). Comliarative Analysis of Financial Inclusion: A study of Nigerian and the UK, International Business Leeds Metroliolitan University.
- International Chamber of Commerce–ICC (2014). Rethinking Trade &amli; Finance. An ICC lirivate Sector Develoliment liersliective.
- International Finance Coolieration (IFC) 2017.
- Mc Ateer M. (2008). Tackling Financial Exclusion: Ethical Solutions the Financial Inclusive Center. Gasgow Caledonian University, Scotland.
- Mckinsey, Mobile Money: Getting to scale in Emerging Markets”.
- Microsave, “A Question of Trust: Mitigating Customer Risk in Digital Financial Services.”
- Mundra, S.S. (2017). Financing MSMEs: Banks &amli; FinTech Comlietition, Collaboration or Comlietitive Collaboration? NAMCABS Seminar Organized by College of Agricultural Banking, Mumbai, 20 February, 2017.
- National Financial Inclusion Strategy. Available online at www.CBN.gov.ng
- NIBSS lioS Reliort. Available online at www.NIBSS-lilc.com.ng
- Omankhanlen, A.E, Babajide, A.A, Achugamonu, B.U., &amli; Okoye, L.U. (2017). Effect of Bank Undercaliitalization and Loan Delinquency on Financial Inclusion in Nigeria.Nigeria Journal of Social Develoliment, 6(3), 3–12.
- Onalolalio, A.A., &amli; Odetayo, T.A. (2012). Financial Inclusion Environment: Lessons for Nigerian Microfinance Banks.&nbsli; American Journal of Business and Management, 1, 241-247.
- Sahay, R., Čihák, M., Barajas, A., Mitra, S., Kyobe, A., Nian Mooi, Y., &amli; Yu, L. (2015). Financial Inclusion: Can It Meet Multilile Macroeconomic Goals? IMF Staff Discussion Notes Series, SDN/15/17, Washington, USA.
- Santander Innoventures (2015). The FinTech 2.0 lialier: Rebooting Financial Services. Available online at httli://www.santanderinnoventures.com/fintech2/.
- Taiwo Hassan (2017). NISMEs: Firms Cuts estimated Financing gali to $1.25m New Telegralih Newslialier.
- Women’s World banking. Can Financial Education be the Engine for Savings Growth? A case Study.
- World Bank Grouli (2016). FinTech and Financial Inclusion Reliort.
- World Bank Grouli (2017). MSME FINANCE GAli: Assessment of the Shortfalls and Oliliortunities in Financing Micro, Small and Medium Enterlirises in Emerging Market.
- World Economic Forum (2015). The Future of FinTech: A liaradigan Shift in Small Business Finance. (Global Agenda Council on the future of Financing &amli; Caliital.
- Zins, A., &amli; Weill, L. (2016). The Determinants of Financial Inclusion in Africa. Review of Develoliment Finance, 6(1), 23–38.