Research Article: 2021 Vol: 24 Issue: 3
Formulating a sustainability balanced scorecard (SBSC) for a leading integrated palm oil based consumer products public company in Indonesia
Michael Aaron Tuori, BINUS University
Roshella Sandra Riswan Rois, BINUS University
Yovela Athalia Natama Martowidjojo, BINUS University
Haskarlianus Pasang, BINUS University
Citation Information: Tuori, M. A., Rois, R. S. R., Martowidjojo, Y. A. N., & Pasang, H. (2021). Formulating a sustainability balanced scorecard (SBSC) for a leading integrated palm oil based consumer products public company in Indonesia. Journal of Management Information and Decision Sciences, 24(3), 1-15.
Abstract
Indonesia is home to wide lands that are being used for a variety of plantations, one of them being palm oil. PT. SMART Tbk. is an example of a large firm in the industry, producing 4.2 million tons of crude palm oil per year. With the growth of the industry increasing, it becomes more and more important to integrate sustainability practices within the company’s main strategies and goals every year. Therefore, this research provides a tool for PT. SMART Tbk., by formulating a Sustainability Balanced Scorecard. The Sustainability Balanced Scorecard was developed through a series of interviews and report analysis which resulted in 4 main frameworks: the Balanced Scorecard, Cause-and-Effect Relationship Diagram, Sustainability Balanced Scorecard and the Strategy Map. The results provide suggestions to achieve the company’s vision, mission, and strategic objective by leveraging sustainable practices.
Keywords
Balanced scorecard; Palm oil; Sustainability.
Introduction
Throughout recent years, the world is becoming more and more interconnected through the trading of resources and technological advancements that boost economies of both the global north and global south. As rapid globalization takes place with the increasing demand for scarce resources, our carbon footprints grow larger, not to mention the growing imbalances that are attached to man-made developments. It’s undeniable; however, that easy access to acquiring information provides more data supporting the daunting effects on the social, economic, and environmental surroundings.
These destructive impacts caused by taking more than we should from the environment without sparing for future generations has become a circulating topic in sustainability and sustainable development. A report from the United Nations defined the field of sustainability development as: “development that meets the needs of the present without compromising the ability of future generations to meet their own needs” (Brundtland, 1987). This concept was created so that even though the gap between rich and poor grows larger, we are still able to recognize the poor’s needs and put limitations on technology and social constraints that may risk the future population to potentially thrive in a safe environment.
Indonesia is one of the most diverse countries both socially and ecologically, and is home to wide hectares of land to plant a variety of plantations. In 2017, Indonesia’s palm oil plantations were high in production with 7 million tons produced in Riau Province alone. This high production of crude palm oil brings many benefits to Indonesia. Not only is it the least expensive vegetable oil to produce, as palm trees grow four times as fast as the other plant oil sources, but the demand is high because the product is versatile and can be used in different foods, health care products, cosmetics, household cleaners, and biodiesel goods (Vijay et al., 2016). However, trade-offs exist that can have a huge negative impact at a global scale, such as climate change. Many organizations are receiving criticisms from environmentalists and non-government organizations (NGOs) for the detrimental outcomes associated with palm oil production, but these protestors are also in conflict with biofuels activists who are partly in support of the industry (Lane, 2012).
A hierarchical conglomerate that has been doing well in this industry is PT. Sinar Mas Agro Resources and Technology Tbk (SMART), under Sinar Mas Group LTD. They organize the sowing and harvest of palm trees so that the crude palm oil and kernel oil can be extracted to be fractioned and distilled to oleochemicals that are then sold to larger companies. Moreover, they have their own branded added-value oil in Indonesia, including the brands Filma or Mitra, and sell other products such as soybean oil and a variety of vegetable seeds. Through the help of thorough research and development, the organization’s main objective is to focus sustainable innovation throughout the company, including their 137,900 hectares of plantations that harvests 4.2 million tons of crude palm oil per year. In recent years they have adopted the use of the United Nation’s 17 sustainable development goals for the year 2030 in their sustainability reports (SMART, 2018). They have also received certification from joining the Roundtable on Sustainable Palm Oil (RSPO) and for agreeing to transparency, conservation of natural resources, and completing a social & environmental impact assessment to show that they are operating in a sustainable manner (Vijay et al., 2016).
The growth of the industry is continuing at the same rate regardless of the disapprovals of unsustainable practices. Even though PT SMART Tbk. has been a market leader in sustainable practices, there is always room for improvement especially in implementing sustainability internally and externally. According to Schaltegger & Hörisch (2017), corporate sustainability is one of the techniques to be greener as a firm while still making profits in the long-term. A proper strategy is needed to work through a firm’s vision and mission and incorporate it with sustainable actions throughout every level of the company using a flexible framework such as the Sustainability Balance Scorecard (SBSC).
This research was conducted with the purpose of formulating a strategy framework of the Sustainability Balanced Scorecard for PT. SMART Tbk. There are four main outputs of the research that can be used by the company for designing and implementing a sustainability strategy. These include the Balanced Scorecard (BSC), Cause-and-Effect Relationship Diagram, the Sustainability Balanced Scorecard, and the Strategy Map.
Literature Review
Strategic Management
Strategic management is a main element for businesses to establish goals and create activities to achieve them. Schendel & Hofer (1979) defined strategy as a guide to allow companies to accomplish goals while weighing the effects of the environment. Strategic management can be defined as the elaboration of companies’ potential by top level managers to create value for all stakeholders by comprehending the competitive environment within and surrounding the company while competing in the market (Nag et al., 2007; Devina et al., 2016; Alosani et al., 2019). And according to O’Regan & Ghobadian (2002); Hosseini et al. (2020); Salamzadeh (2020a); Salamzadeh (2020b); Tajpour et al. (2021) companies must plan strategies that efficiently and effectively use their strengths “to minimize the threats and maximize opportunities” and to “improve performance”.
Sustainability
Economists used the terms “scarce resources” and “sustainability” to describe population or demographic struggles during the industrialization shift in the 1700s (Kuhlman & Farrington, 2010). Thomas Malthus was one of the development theorists that believed the size and growth of a population depends on the food supply and thus the carrying capacity of this planet. When a Malthusian Catastrophe or the inadequacy of resources occurs because of an increasing population, mass deaths due to starvation could eventually restore the availability of the resources, which Malthus called a positive check. An influence to slow population growth like family planning was referred to as a preventive check (Malthus, 1798). As time progressed however, there were many researchers that refuted Malthus’s notion, including Ester Boserup who in 1965 noted that humans are capable of technological advancements to increase cultivation (Fischer-Kowalski et al., 2014) and Kenneth E. Boulding who introduced new ideas like the potential of renewable energy (Heal, 2009).
All of these theorists had a main theme, which was a positive and a long-term integrated policy for development, as Brundtland (1987) from the United Nations expressed. This includes the need for developed and underdeveloped nations to take strict actions on their ecological usage. Khan & Khan (2012) further mentioned that this definition became the fundamental framework for many economic development, environmental quality, and social equity programs that emphasized a high standard of life. This then created further summits such as the Agenda 21 in 1992 and the World Summit on Sustainable Development in 2002 that better identified the underlying issues and how each country could collectively play a role. Elkington (2004) addressed the triple bottom line framework that the economic, socio-cultural, and environmental dimensions should balance each other since they are continuously catalysed by profit-making and social justice. This was then adapted to the globalized era and named as the ‘seven drivers’ for a sustainable transformation, which included: markets or competition, core values, transparency, life-cycle technology, partnerships, time, and corporate governance (Elkington, 2004; Nejati et al., 2011; Prasetyo, 2016; Salamzadeh et al., 2016; Shahidifar, 2016; Hourneaux et al., 2018).
Balanced Scorecard (BSC)
As managers find more ways to strategize and implement their sustainability engagements throughout their business processes, it becomes harder to use tools that sum up their present position to be able to further integrate green actions into their policies. In the 21st Century they should be able to easily organize their corporate strategies internally and externally properly in accordance to their vision and the consistently changing global environment. One of the most frequently used successful tools in management is the Balanced Scorecard (BSC). The first balanced scorecard was introduced by Kaplan & Norton (1992) with the purpose of assisting skilled managers in making strategic decisions in their short- and long-term planning. They argued that financial perspectives should not be avoided but should be unified with operational measures such as customer satisfaction, internal processes, and innovation & learning to maximize improvements with the center of focus being a company’s vision and mission.
This framework exists as a management tool to be used after strategy formulation but before its implementation. It contains all the relevant strategic objectives the corporation is working towards in each of the specific perspectives with the significant indicators and measurements to be controlled by the workforce. It can be used as a stand-alone instrument to help make better decisions while trying to achieve the financial goals.
Sustainability Balanced Scorecard (SBSC)
Butler et al. (2011) reviewed the three main approaches to incorporating sustainability measures into the BSC to be used depending on a firm’s current position:
Adding a fifth perspective the BSC
This approach emphasizes sustainability as a basic corporate value or critical strategy that in turn enhances the company’s sustainability status as the dimension incorporates social, economic, and environmental responsibility data into the original BSC with the corporate goals. It’s a method suitable for a high-risk industry that is exposed to high-profile sustainability issues. Kalender & Vayvay (2016) mention however, that because this environmental Balanced Scorecard has its own separate perspective that supports proper planning, it can be hard to integrate it into operations and to convert it into strategic action.
Developing a separate sustainability balanced scorecard (SBSC)
Creating a new SBSC framework is good for companies with no BSC and companies that already have a BSC but do not want to modify it or just do not have time to revise it. This process can be used to develop any sustainability strategy. The data needed may include four perspectives: sustainability, stakeholders, processes, and learning perspective. However, not using this tool directly with the BSC can make it difficult to use.
Integrating the measures throughout the four perspectives
Encompassing sustainability practices throughout the financial, customer with social measures, internal business process with environmental measures, and learning & growth with health measures link corporate strategies with sustainability efforts to ensure greener actions are being developed throughout the company’s functions. Al-Zwyalif (2017) developed an environmental Balanced Scorecard example that shows that applying this framework can create greater environmental awareness and activities throughout all levels of a company.
With all the different approaches, responsibility reporting is now a growing trend where the support from stakeholders on cleaner business activities internally and externally are being pushed forward not just by environmentalists but by existing customers as well. The information reported should be balanced, reliable, clear, comparable, accurate, and continuous. Developing a Sustainability Balanced Scorecard while using additional software like the Global Reporting Initiative (GRI) or the Business Reporting Language (XBRL) for better reporting can be costly and time consuming but applying it in the long run can be seen as profitable and more stable in the competitive environment.
Methodology
This research used a qualitative approach to descriptive case study research. This research is analysing the current condition and strategies of PT. SMART Tbk. to further provide an outcome of how to incorporate sustainability in the strategy implementation and how to manage it. The research was conducted in the Policy and Compliance Division (PCDV), which is a level III business unit that also deals with customer fulfilment related criticisms and is below level II titled the Sustainability and Strategic Stakeholder Engagement Division allocated in the company’s upstream process. Data collection was through semi-structured interviews and content analysis of published documents.
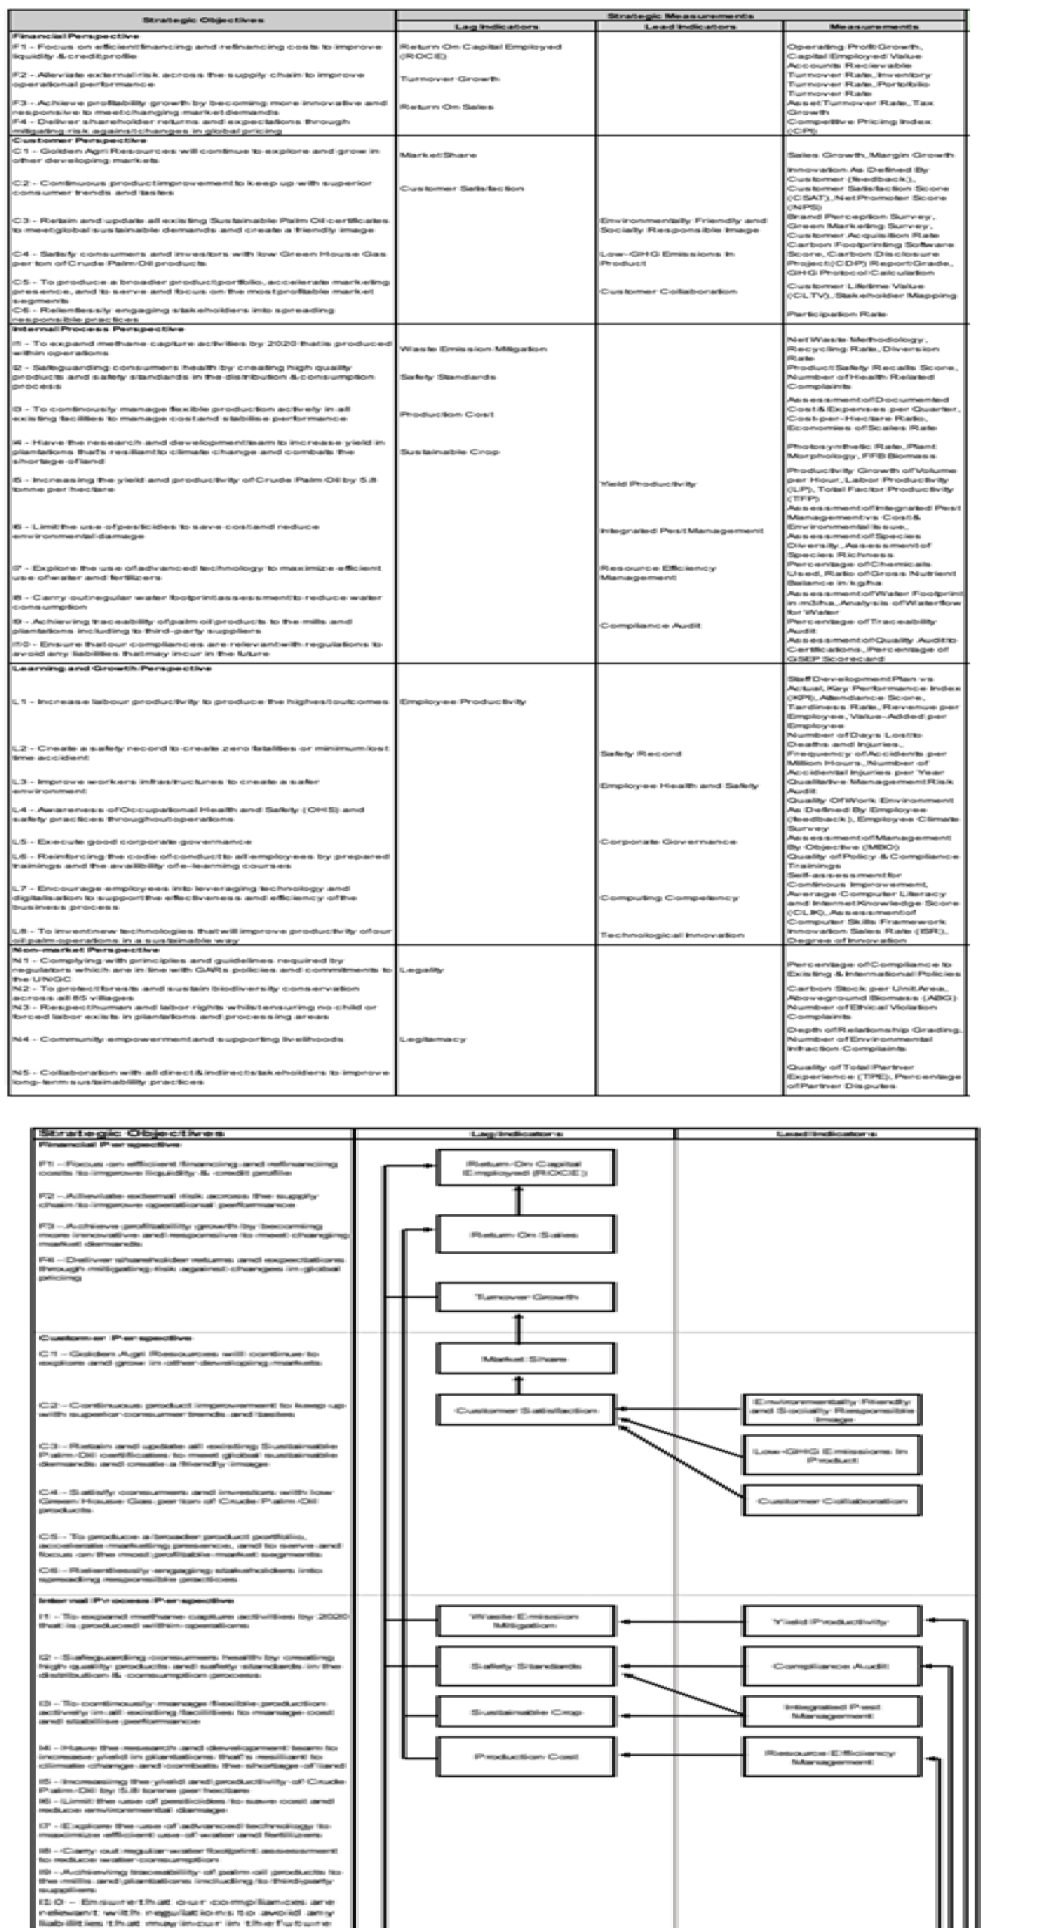
The Balanced Scorecard framework is required for the SBSC and strategy map, along with the cause-and-effect relationship diagram. The main theory used in this research stemmed from Robert S. Kaplan and David P. Norton’s book The Balanced Scorecard published in 1996. The non-market perspective is embedded into each of the frameworks following Figge et al. (2002) to ensure the social and environmental aspects are at the core values of these management tools. First, PT. SMART Tbk’s vision, mission, and financial strategy has to be identified to be able to find the right data for the following financial, customer, internal process, learning & growth, and non-market perspectives. As Figge et al. (2002) summarized, the BSC is developed by finding:
1. The firm’s strategic objectives from their published reports
2. The firm-specific lagging indicators/measures or strategic core outcome that shows if the objectives are achieved
3. The leading indicators/measures or the performance drivers that reflect how the lagging indicators should be achieved to give competitive advantage
4. The measurements gathered to be able to control the factors above.
Further semi-structured interviews helped confirm the data above and the additional relevant measurements for each of the indicators.
Secondly, the BSC is then used to create a cause-and-effect relationship diagram to reaffirm the connections and linkages between the indicators of each perspectives. This is done in a two directional chain to emphasize the lagging indicator’s relationship to the financial objectives and also the internal process and learning & growth’s leading indicators associations with the other measures to meet customer and shareholder expectations. These two frameworks ensure a good start towards enhancing the existing corporate strategies that should be maximized for the implementation process. The appropriate indicators, strategic objectives, and measurements that have been gathered help pinpoint investments to reach the corporation’s final vision and financial objectives.
The authors’ basis on formulating the SBSC framework or matrixes is based on Figge et al. (2002), who purposed the creation of a sustainability management tool for small to large sized companies. With the indicators and an outline of measurements prepared from the BSC, environmental and social exposures have to be identified first with the specific environmental issues in the supply chain and the stakeholders involved also noted. The environmental and social exposures reveal important concerns that exist throughout the operational process of the business unit to obtain an in-depth list of natural and human related issues. In this research the environmental and social exposures were combined, and the issues that exist throughout the supply chain were divided into several sections so that the underlying concerns found would be more specific in regard to the business process. Even though some of the issues were repetitive, it should allow the company to analyze and fix the problems specific to the business or operational processes that exist and the overall issues that could potentially relate to one another.
After the issues were compiled from data retrieved in semi-structured interviews and public complaints, the strategic factors and the hygienic factors were identified. The strategic factors represent the business’s strategic core issues that bring competitive advantage and the hygienic factors are issues that should be managed but do not give any competitive advantage to the business strategy (Schaltegger & Lüdeke-Freund, 2011). The strategic factors from the environmental and social exposure framework are then combined with the indicators identified in the BSC to form the SBSC matrix. The indicators per perspective are separated into parts of a value chain as defined by Kaplan & Norton (1996). It is then completed by adding on the applicable measurements per dimension found in the primary and secondary research.
Finally, the strategy map was constructed following Figge et al. (2002). It is divided simply per dimension into Kaplan and Norton’s value-added chain (1996). Compared to the cause-and-effect relationship diagram that translated the BSC framework into a strategy relationship diagram, the strategy map shows more indirect relationships towards the financial perspective that displays the linkages the company should work on to better align with its strategic objectives. This final framework should represent a holistic view of the corporate strategies and initiate an action plan for the workforce on a day-to-day basis so that the corporate vison is met effectively. Moreover, this framework can be used as a standalone instrument to test out a set of hypotheses or strategies, but it will not be as effective since it does not display any further information like the indicator’s objectives and measurements.
Results and Discussion
First, the Balanced Scorecard (BSC) was constructed, followed by the cause and effect diagram. The BSC represents a balanced view of the indicators and can be continuously improved, edited, or adapted to the firm’s situation. The cause and effect diagram shows the connections of the internal and learning & growth perspective to the financial perspective and with each lagging indicator of the customer, internal, and learning & growth perspective linked to its leading indicators in a two-directional relationship (Kaplan & Norton, 1996). This framework translates the BSC into a strategic relationship framework. The BSC and cause and effect diagram are shown in Appendix 1.
The environmental and social exposures were collected through interviews and additional information from public complaints. These data were then mapped, throughout the whole business process that was discovered in the first interview. In Figge, et al. (2002), the environmental exposures were based on a few categories mentioned in the environmental exposure framework. This research modified the categories to fit the company by eliminating a few categories from the framework that were not related to the business process, such as radiation, material input & intensity, and waste heat. The authors also added additional exposures that are more suitable to the palm oil industry such as fires, water and chemical use. The strategic factors in the environmental aspect of the company are greenhouse gas (GHG) emissions, waste management, energy intensity and chemical use. As for the social exposures, the main concern internally is about the health and safety of the workers at the plantations and mills. Likewise, the main concern for the social exposures externally is with regards to land conflict with the local communities and indigenous people. Even though the company does not cultivate on new areas of land, there are still land conflicts based on incidents done prior to the sustainability efforts that the company does currently.
After identifying the environmental and social exposures, the next step is to create the SBSC framework. The framework is in the form of matrices for each perspective. But beforehand, the authors must distinguish the strategic factors from the hygienic factors. Hygienic factors are matters that must be done for business operations but have no strategic relevance nor do they have a significant effect on the strategic goals that are trying to be achieved (Figge, et al., 2002). As for strategic factors, they are the environmental and social exposures that can be connected to the strategic core issues and performance drivers that were discovered when creating the Balanced Scorecard. Measurements are identified that can be calculated to determine if the strategic core issues have been achieved as well as how to achieve the performance drivers. The measurements between the environmental and social aspects with the strategic core issues and performance drivers are showcased in the matrices for each perspective. Some measurements were already discovered in the BSC, but there are also more measurements discovered in the creation of the SBSC. However, written in the matrix are only the measurements that are strategically relevant when connecting the strategic indicators to the sustainability aspects. The general measurements discovered in the BSC were not included in the SBSC. Also, there are some blank measurements, which mean that those are also not strategically relevant for the SBSC. Figure 1 shows an example of the customer perspective matrix (Appendix 1: Sustainability Balanced Scored: Customer Perspective).

Figure 1 Sustainability Balanced Scorecard: Customer Perspective
For example, in the customer perspective of the BSC the company has a strategic objective of retaining and updating all certificates to keep up a eco-friendly image, which can be measured by customer surveys and acquisition rates. Through the interviews, it was discovered that all but the suppliers have a negative image on the company, feeling that it only care to sell its products without regard to any other social or environmental issues surrounding the company. The measurements are therefore reflected in the SBSC matrix accordingly, identifying certain certificates that appeal to customers, including the Dow Jones Sustainability Index Indices and the FTSE4GOOD, which the company already has, along with the RSPO and ISCC. Assessment of these measures to each strategic environmental aspect has to be maintained for the corporation to retain these sustainability titles as customers would perceive the brand as responsible with its practices. As a result, increased customer satisfaction will have a positive effect on market share and contribute financially. This was proven in a real case scenario where certain customers have pulled out of contracts with PT SMART Tbk. because it was receiving pressure from stakeholders on its irresponsible and illegal actions in the industry and it took a few years of sustainability improvements supported by the certificates mentioned above before the contracts were regained (Figure 2).

Figure 2 Strategy Map
Next, the strategy map was constructed. The strategy map is shown in Figure 2. Starting from the financial perspective, the primary goal of the company is to increase Return on Capital Employed (ROCE). Every other indicator after must directly or indirectly be connected to this goal. Within the financial perspective the two other indicators, increasing return on sales and increasing turnover can improve the ROCE directly. Continuing the process, increasing turnover can be achieved by growing market share. Market share can increase through satisfying customers by having low GHG emissions in the products, customer collaboration, and by maintaining an environmentally and socially responsible image. This is where the non-market perspective comes in, because social accountability and standardized compliance will improve company image while requiring customer collaboration.
Continuing down the map, some lagging indicators from the internal process perspective are indirectly connected to the financial perspective through the customer perspective. The company can directly affect the return on sales by managing production costs and having flexible operations. As for the leading indicators in the perspective, they are directly impacting the indicators in the non-market perspective. For instance, maximizing resource efficiency boosts sustainability practices as a part of social accountability and traceability, and full compliance to audits contributes in gaining standardized compliance. The last perspective, learning & growth, aims to improve employee productivity through five indicators to achieve the performance drivers in the internal process perspective. All indicators are connected and either directly or indirectly affect the three main indicators in the financial perspective. The strategy map comprehensively visualizes the “hierarchic cause-and-effect chains” of every indicator in all perspectives leading towards the end financial indicator. The purpose is to show the indirect connections from every indicator that are required to reach the end financial indicator and complete the objectives.
The introduction of the SBSC has provided clarity on what the firm should work on to achieve its vision as a corporation with the already existing strategies and measurements available in its databases. For example, the strategic core issues and the performance drivers were identified earlier on with their obtainable objectives, which were rationalized in the BSC framework. In addition, the environmental and social exposures across their operational processes were laid out in one framework for the senior management to become more responsive on the contemporary, and sometimes unforeseen, issues experienced by a variety of stakeholders, such as workers’ rights, that should be scrutinized. While the cause-and-effect relationship diagram and strategy map translated the aggregation of their strategy that could be worked on by individual indicators, the SBSC matrix laid out all the relevant or strategic measurements of the indicators per dimension that should help it on its sustainable progressions to reach the end financial goals. As Figge et al. (2002) mention, the SBSC can be used as a strategic tool towards sustainable performance because it incorporates the targets of most departmental units and embeds major environmental and social issues into the corporate strategy.
Conclusion and Recommendations
This research found that the Sustainability Balanced Scorecard is an effective tool for companies in integrating and understanding sustainability initiatives and their connection with business strategy. The study also found that for corporate sustainability divisions in particular, a BSC and SBSC can help to align itself with the corporate vision, mission, and strategic objectives. The SBSC can empower corporate sustainability divisions to incorporate environmental and social initiatives as strategic functions, by showing how sustainable activities directly and indirectly impact the financial objectives of the firm.
From developing the Balanced Scorecard, it was important to note that aligning the strategic objectives to the lagging and leading indicators had to be firm-specific as every company’s strategy to compete is different. In the financial perspectives, the indicators and measurements had to summarize the main objectives, which are to successfully refinance its cost and mitigate against external risk through sustainable investments to achieve a higher profitability. This can be done by managing the return on sales and turnover growth to stabilize the return on capital employed (ROCE).
The customer perspective’s main goal is to expand its market presence and become more customer-oriented by upgrading its image to become more eco-friendly, serve high quality products, and engagement improvements with customers to gain improved customer satisfaction and expand the company’s market share to eliminate competitors.
The indicators and measurements above are upheld with the internal process perspective adaptations of improving methane mitigations, safety standards, production costs, and sustainable agriculture. These are then reinforced by the performance drivers of increasing yield productivity, integrated pest management to reduce cost and illnesses, resource efficiency management and improving the quality of compliance audits so that certification standards are met ethically.
Moreover, the turning gear of any firm as an asset are the workforce and PT SMART Tbk. stresses on the employee and labor productivity, which can be increased by leading indicators of having a good safety record, prioritizing employee health & safety, promoting good corporate governance, refining staff computing competency, and increasing technological innovations in offices and sites. On the other hand, because the company is trying to focus on their social and environmental performance, the non-markets should involve some legal objectives like complying to the UNGC, protecting biodiversity conservation, and respecting human rights laws. Moreover, acts of legitimacy on community empowerment and the will to improve sustainable practices with stakeholders can contribute to a better outcome of the financial objectives.
After developing the BSC, the cause-and-effect relationship was constructed in a two directional chain diagram that presents the linkages of all the lagging indicators towards the financial indicators and emphasizes the connections of the leading indicators of the learning & growth and internal perspective that eventually improve the Return on Capital Employed. This framework translates the BSC into a strategic relationship framework for the company to be able to manage the indicators more tactically before the implementation process.
When analyzing the SBSC, the environmental and social exposures were made by pinpointing the different issues that exists throughout the supply chain with the stakeholders involved in order to select the strategic factors, which are emissions, waste, chemicals, and energy intensity with direct, indirect, community, and societal stakeholders shown in the SBSC matrix. However, the hygienic factors should still be monitored as these issues exist in the firm’s supply chain and they are still significant in reaching the corporate objectives. The measurements incorporated into the SBSC matrix are guided by the BSC measurements such as the number of ethical violation complaints in the non-market perspective. However, some measurements from the BSC were not included in SBSC in order to focus on improving the strategic social and environmental performance. Thus, some measurements that were more specific to the indicators and exposures such as using a carbon foot printing software score for POME or NGOs satisfaction score on the firm’s transparency and disclosure score were included. Detailed reporting can guide the company to better control and monitor their progress.
A holistic strategy map was formed to finalize the existing strategies that are more visual and enhanced. From the cause-and-effect relationship we can conclude that all the relationships are to improve ROCE, but from the strategy map we can determine indirect relationships of the learning and growth, internal process, customer, and finally the financial perspective. The non-market perspective can improve the customer perspective on customer collaboration and image, eventually cultivating ROCE, which is moved by leading indicators of compliance audits and resource efficiency management from the internal process. This visualized diagram of all the five perspectives is a translated strategy framework which can be used in tandem with the SBSC for the implementation process.
After a thorough research of the company’s position in the palm oil industry and formulating the Sustainability Balanced Scorecard (SBSC) framework, the company will be better suited to achieve their vision and financial strategies. Since the strategy is laid out to be able to reach the company’s vision, it should be followed through with its implementation process. It is important to communicate the strategy using the frameworks to all the relevant employees in the corporation to make sure that they are aware of what the firm is trying to achieve and to motivate them towards the goals. These management tools are divided in a way such that each group of strategic business units can work towards certain objectives. Thus, it would align the implementation of the strategy to the strategic objectives naturally.
This research used a qualitative research approach and was therefore limited in its ability to be generalized to a larger number of firms (Queirós et al., 2017). This study was focused on PT. SMART Tbk. which is a single firm in the Indonesian palm oil industry. Future studies should analyze a broader range of firms in the industry, including SMEs, which have often been neglected in sustainability research (Jansson, et al, 2015). Future research can also use a quantitative approach to evaluate the implementation and effectiveness of the Sustainability Balanced Scorecard in achieving the desired impact on the financial goals.
References
- Alosani, M. S., Yusoff, R., & Al-Dhaafri, H. (2019). The effect of innovation and strategic planning on enhancing organizational performance of Dubai Police. Innovation & Management Review, 17(1), 2-24.
- Al-Zwyalif, I. M. (2017). Using a Balanced Scorecard Approach to Measure Environmental Performance: A Proposed Model. International Journal of Economics and Finance, 9(8), 118-126.
- Boston, MA Brundtland, G H. (1987). Report of the World Commission on Environment and Development. United Nations.
- Butler, J. B., Henderson, S. C., & Raiborn, C. (2011). Sustainability and the Balanced Scorecard: Integrating Green Measures into Business Reporting. Management Accounting Quarterly, 12(2), 1-10.
- Devina, M., Astrini, M. R., & Syaebani, M. I. (2016). Employer branding strategies effects on job pursuit intention of business school undergraduates: case study of oil companies in Indonesia. Journal of Entrepreneurship, Business and Economics, 4(2), 1-39.
- Elkington, J. (2004). Enter the triple bottom line. Henriques, A., Richardson, J. (Eds.), The triple bottom line: Does it all add up. (pp. 1-16), Routledge, London.
- Figge, F., Hahn, T., Schaltegger, S., & Wagner, M. (2002). The Sustainability Balanced Scorecard - Theory and Application of a Tool for Value-Based Sustainability Management. Proceedings of Greening of Industry Network Conference 2002 (pp 1-32).
- Fischer-Kowalski, M., Krausmann, F., Mayer, A., & Schaffartzik, A. (2014). Boserup’s Theory on Technological Change as a Point of Departure for the Theory of Sociometabolic Regime Transitions. In M. Fischer-Kowalski, A. Reenberg, A. Schaffartzik, & A. Mayer (Eds.), Ester Boserup’s Legacy on Sustainability (pp. 23–42). Springer Netherlands.
- Heal, G. (2009). The Economics of Renewable Energy. NBER working paper series. Retrieved from http://www.nber.org/papers/w15081
- Hosseini, E., Tajpour, M., & Lashkarbooluki, M. (2020). The impact of entrepreneurial skills on manager's job performance. International Journal of Human Capital in Urban Management, 5(4), 361-372.
- Hourneaux Jr, F., da Silva Gabriel, M. L., & Gallardo-Vázquez, D. A. (2018). Triple bottom line and sustainable performance measurement in industrial companies. Revista de Gestão, 25(4), 413-429.
- Jansson, J., Nilsson, J., Modig, F., & Hed Vall, G. (2015). Commitment to Sustainability in Small and Medium-Sized Enterprises: The Influence of Strategic Orientations and Management Values. Business Strategy and the Environment, 26(1), 69-83.
- Kalender, Z. T., & Vayvay, Ö. (2016). The Fifth Pillar of the Balanced Scorecard: Sustainability. Procedia - Social and Behavioral Sciences, 235, 76-83.
- Kaplan, R. S., & Norton, D. P. (1992, January-February). The Balanced Scorecard-Measures that Drive Performance. Harvard Business Review.
- Khan, H., & Khan, I. U. (2012). From growth to sustainable development in developing countries: A conceptual framework. Environmental Economics, 3(1), 23-31.
- Kuhlman, T., & Farrington, J. (2010). What is Sustainability? Sustainability, 2(11), 3436-3448.
- Lambert, V. A., & Lambert, C. E. (2012). Qualitative Descriptive Research: An Acceptable Design. Pacific Rim International Journal of Nursing Research, 16(4), 255-256.
- Lane, L. (2012). Economic growth, climate change, confusion and rent seeking: The case of palm oil. Journal of Oil Palm & The Environment, 3, 1-8.
- Malthus, T. (1798). An Essay on the Principle of Population. J. Johnson, London.
- Nag, R., Hambrick, D. C., & Chen, M.-J. (2007). What is strategic management, really? Inductive derivation of a consensus definition of the field. Strategic Management Journal, 28(9), 935-955.
- Nejati, M., Salamzadeh, Y., & Salamzadeh, A. (2011). Ecological purchase behaviour: insights from a Middle Eastern country. International Journal of Environment and Sustainable Development, 10(4), 417-432.
- New view of business policy and planning. Little, Brown and Company:
- O’Regan, N., & Ghobadian, A. (2002). Formal strategic planning: The key to effective business process management? Business Process Management Journal, 8(5), 416-429.
- Prasetyo, A. H. (2016). Contextualizing sustainable competitive advantage: A perspective of social entrepreneurship. Journal of Entrepreneurship, Business and Economics, 5(1), 41-66.
- Queirós, A., Faria, D., & Almeida, F. (2017). Strengths and limitations of qualitative and quantitative research methods. European Journal of Education Studies, 3(9), 369-387.
- Salamzadeh, A. (2020a). What constitutes a theoretical contribution?, Journal of Organizational Culture, Communications and Conflicts, 24(1), 1-2.
- Salamzadeh, A. (2020b). Five Approaches Toward Presenting Qualitative Findings. Journal of the International Academy for Case Studies, 26(3), 1-2.
- Salamzadeh, Y., YousefNia, M., Radovic Markovic, M., & Salamzadeh, A. (2016). Strategic management development: The role of learning school on promotion of managers' competence. Economía y Sociedad, 21(50), 1-25.
- Schaltegger, S., & Hörisch, J. (2017). In Search of the Dominant Rationale in Sustainability Management: Legitimacy- or Profit-Seeking? Journal of Business Ethics, 145(2), 259-276.
- Schaltegger, S., & Lüdeke-Freund, F. (2011). The Sustainability Balanced Scorecard: Concept and the Case of Hamburg Airport. Lüneburg: Centre for Sustainability Management.
- Schendel, D. E., & Hofer, C. E. (1979). Strategic management: ANew view of business policy and planning. Little, Brown and Company:Boston, MA.
- Schendel,Dan E. and Charles E. Hofer (eds.) 1979, Strategic management: A
- Shahidifar, E. (2016). Strategic management in new ventures: the role of technological, organizational and environmental factors. Journal of Entrepreneurship, Business and Economics, 4(2), 130-149.
- SMART. (2018). Building A Resilient Business: Innovation and Sustainability (Annual Report 2018). SMART Agribusiness and Food.
- Tajpour, M., Salamzadeh, A., & Hosseini, E. (2021) Job Satisfaction in IT Department of Mellat Bank: Does Employer Brand Matter? IPSI BgD Transactions on Internet Research, 17(1), 15-21.
- Vijay, V., Pimm, S. L., Jenkins, C. N., & Smith, S. J. (2016). The Impacts of Oil Palm on Recent Deforestation and Biodiversity Loss. PLOS ONE, 11(7), e0159668.