Research Article: 2022 Vol: 26 Issue: 1
Fundamental Variables, Audit Risk, and Audit Effort
Chongkil Na, Chonnam National University
Heejeong Shin, Dong-Eui University
Su-young Choi, In-Ha University
Citation Information: Na, C., Shin, H., & Choi, S. (2022). Fundamental variable, audit risk, and audit effort. Academy of Accounting and Financial Studies Journal, 26(1), 1-12
Abstract
Postulating that the fundamental variable as a comprehensive accounting quality index provides auditors with the information on audit risk, we examine whether the auditors use the information in fundamental variable (AFS) in assessing audit risk. The empirical results show that audit fees and hours as proxies for audit effort decrease in AFS which reflects audit risk, indicating the increased AFS level leads auditors to spend less time in auditing. This suggests that auditors take account AFS information into assessing audit risk, which gives insight into financial statement analysis in assessing audit risk.
Keywords
Financial Statement Analysis, Fundamental Analysis, Audit Effort, Audit Risk.
Introduction
This study examines whether the auditors use the information in fundamental variables in assessing audit risk. The fundamental score (AFS) through financial statement analysis is considered a comprehensive accounting quality index (Penman & Zhang, 2002), the high level of AFS indicating the high level of earnings quality, or reporting quality. Such AFS is reported to have ability to predict the likelihood of future earnings increase (Wieland 2011; Wahlen & Wieland, 2011). In a view point of accounting, firm- specific information including information risk is reflected in earnings quality, which reflected in AFS would also determine firm-specific risk such as audit risk, operating risk, and so on (Francis et al., 2005; Kim & Qi, 2010).
However, given that information risk is crucial to investors’ economic decision but not all intermediaries in capital market can exploit the AFS information, it is important to investigate auditors’ behavior to assess audit risk using AFS information. Focused on auditor as a crucial one of the intermediaries in capital market, this study tries to investigate fundamental variable (AFS) plays a role in providing auditors with the information on audit risk. Given that audit fees rely primarily on firmspecific risk (Simunic, 1980; Nikkinen & Sahlstrom, 2005), if the AFS conveys the information on audit risk, auditors would take AFS information into consideration of determining audit fees. Moreover, if audit fees are systematically related to AFS level, the resulting hours worked by auditors, or audit effort also would vary in AFS level. Thus, audit hours (per fee) representing audit effort would lower in the level of fundamental variables (AFS).
Using KSE listed firms from 2006 to 2016, empirical analyses provide several results supporting our conjecture. First, the increased AFS is negatively associated with decreased audit fees, indicating that AFS is likely to carry the information on audit risk, which auditors consider in determining audit fees. Second, the decreased audit hours are negatively related to the increased AFS, also indicating the information content of AFS on audit risk. These results hold even when audit hours per fee as an explanatory variable is included in the test model, meaning auditors could understand the information of AFS on audit risk, and take into accounts of it in assessing audit risk indeed.
This study has several contributions as follows. First, as academic research, this sheds light on audit efforts’ behavior depending on accounting information. While a variety of studies on audit and accounting information, such as earnings quality and audit quality, earning quality and audit efforts, etc., by using discretionary accruals as a proxy of earnings quality, the research which reveals the relationship between auditor’s behavior and accounting information through financial statement analysis is scarce. Second, in practice, this study contributes to the practical field in suggesting the usefulness of AFS as a wide audit-risk measurement. Overall, this study suggests that AFS, a summarized fundamental score, plays a role as an indicator of firm-specific risk in accounting environment. Finally, this study confers insight into fundamental variables (AFS) through financial statement analysis in terms of informational usefulness in assessing audit risk.
Research Background and Hypothesis Development
Financial statement analysis helps information users identify stock mispricing by exploiting financial statement information such as financial ratio or specific accounting items. The related literature documents that accounting information on financial statements has predictive power for future earnings changes and also the investment based on the strategy exploiting such information generates abnormal returns (Lev & Thiagarajan, 1993; Abarbanell & Bushee, 1997, 1998; Piotroski, 2000; Mohanram, 2005; Wahlen & Wieland, 2011). Recently, propose accounting structure-based approach in predicting future earnings through financial statement analysis by taking inter-period and intra-temporal relation of accounting numbers into account. Building on Nissim and Penman (2001) documenting that future firm value relies on residual income which consists of return on net operating asset (RNOA) and growth in net operating asset (GNOA) under the residual income valuation model, decompose those two into six components mirroring earnings persistence. Then, they empirically show aggregate score measure (S-Score) based on those variables is positively related to the probability of future returns on assets increase. Na and Shin provide the evidence from Korea stock market on usefulness of financial statement analysis in firm valuation, especially the predictability of fundamental variables suggested by PZ.
Given that such fundamental variable provides the information on earnings quality including earnings persistence, we postulate that fundamental variable could reflect the extent of information risk. Since firms with lower level of earnings quality tend to reveal higher information risk (Francis et al., 2005; Kim & Qi, 2010), high score of fundamental variable would convey high earnings quality and low information risk. In this point, we get interested in how auditors make use the information in fundamental variables. As information risk from financial statements cause the information users to experience serious economic loss, it is important for auditors to assess earnings quality and take it into planning audit. To do so, auditors should assess audit risk, which is available with the components of financial statement.
In this context, we conjecture that the fundamental variable as a comprehensive accounting quality index provide auditors with the information on audit risk. However, as documented in prior studies, not all intermediaries in capital market do understand the implication of fundamental variable. For example, the analysts’ earnings forecasts do not fully incorporate the future earnings information implied in fundamental variables (Lev and Thiagarajan, 1993; Wahlen & Wieland, 2011). This means analysts as an investor intermediary under-estimate the information in fundamental variables or do not use it. Thus, we investigate whether the fundamental variable plays a role in providing auditors with the information on audit risk, by examining the relationship between fundamental variable and audit fees and hours. And also, we test whether auditors make use of the fundamental variables in assessing audit risk. Audit fees and hours are decisive factors affected by audit risk and proxies for audit efforts. Since the lower earnings quality, i.e., high information risk, requires the higher auditors’ effort, the firms with low fundamentals are likely to be cost in audit process, increasing audit fees or audit hours. Thus, we form our hypotheses as follows.
H1: The decreased audit fees are associated with the increased AFS.
H2: The decreased audit hours are associated with the increased AFS.
Research Design
Fundamental variable
To test our hypotheses, we employ the fundamental variables suggested by PZ and extended by (Wieland, 2011; Wahlen & Wieland, 2011). Based on residual income valuation model, PZ suggest return on net operating assets (RNOA) and the change in net operating assets (GNOA) as key variables predicting future earnings. Since RNOA tends to revert in the long-term and converge on mean value, the higher RNOA is associated with future earnings decrease. Assuming RNOA is persistent, future earnings depend on GNOA. Specifically, the increase of net operating assets conditioned on RNOA indicates inefficient investment for firm performance and thus, future earnings decrease in GNOA (Wahlen & Wieland, 2011). However, if the increase of net operating assets contributes to sales increase, the investment of assets is efficient in generating future earnings and thus the increase of net operating assets intersected with sales increase is positively related to future earnings increase.
As calculated by DuPont analysis, increase of return on net operating assets (ΔRNOA) is comprised of change of both assets turnover (ATOC) and profit margin (PMC). Since the change of assets turnover (ATOC) indicates the increase in sales to net operating assets, the higher ATOC means the probability of future earnings increase. And the change of profit margin (PMC) measured as the increase in gross margin to sales growth implies the improvement of pricing power (Abarbanell & Bushee, 1997). Conversely, decrease in PMC implies the inefficient investment in view of output to input. Thus, PMC is also positively associated with the future earnings increase. Lastly, operating accruals (ACC) is included in fundamental variables based on Sloan (1996) documenting the lower earnings persistence is associated with future earnings decreases. Table 1 summarizes the fundamental variables measurement and the information contents implied in fundamental variables.
| Table 1 Information Contents for Future Earnings of Fundamental Variables | |||
| Variables | Measurement | Future Earnings | |
| RNOA |  |
Decrease | (-) |
| GNOA |  |
Decrease | (-) |
| SNOA | 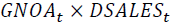 |
Increase | (+) |
| PMC | 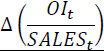 |
Increase | (+) |
| ATOC | 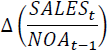 |
Increase | (+) |
| ACC | 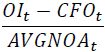 |
Decrease | (-) |
This table represents measurement of individual fundamental variables, defined by PZ and developed by (Wieland & Wahlen, 2011) and their information contents for future earnings. Variable definitions are as follows:
 = Operating income;
 = Net operating asset, measured as total asset minus cash, short term investments,
and accrued liabilities;
= Net operating asset, measured as total asset minus cash, short term investments,
and accrued liabilities;
 = Average net operating asset at the beginning and end of the current year;
 = Return on net operating asset, measured as operating income () scaled by
average net operating asset ();
= Return on net operating asset, measured as operating income () scaled by
average net operating asset ();
 = Growth in net operating asset, measured as changes in net operating asset
scaled by net operating asset at the beginning of the current year;
= Growth in net operating asset, measured as changes in net operating asset
scaled by net operating asset at the beginning of the current year;
 = Growth in net operating asset( ) conditioned on changes in
sales(
= Growth in net operating asset( ) conditioned on changes in
sales( ), measured as growth in net operating asset( ) multiplied
by , where denotes an indicator variable for sales change,
equal to 1 if sales increase, 0 otherwise;
), measured as growth in net operating asset( ) multiplied
by , where denotes an indicator variable for sales change,
equal to 1 if sales increase, 0 otherwise;
 = An indicator variable for level, equal to 1 if is greater than
the median in each year, 0 otherwise;
= An indicator variable for level, equal to 1 if is greater than
the median in each year, 0 otherwise;
 = Changes in profit margin ratio, measured as the difference of profit margin
ratio(
= Changes in profit margin ratio, measured as the difference of profit margin
ratio( ) at the beginning and end of current year, where profit margin
ratio( ) is measured as operating income scaled by sales;
) at the beginning and end of current year, where profit margin
ratio( ) is measured as operating income scaled by sales;
 = Changes in asset turnover, measured as the difference of asset turnover(
  )
at the beginning and end of the current year, where asset turnover( ) is
measured as sales divided by net operating asset;
)
at the beginning and end of the current year, where asset turnover( ) is
measured as sales divided by net operating asset;
 = Accruals, measured as operating income minus cash flow from operations,
scaled by average net operating asset;
= Accruals, measured as operating income minus cash flow from operations,
scaled by average net operating asset;
 = Cash flow from operation scaled by average net operating asset.
Then, we estimate the predictive ability of individual fundamental variable (i.e., each coefficient of individual variables on LOGIT model) by hold-out sample test using previous 5 year rolling periods (Wieland 2011). The LOGIT regression model is as follows.
 (1)
(1)
where EINC denotes an indicator variable for changes in earnings, equal to 1 if current
earnings increases and 0 otherwise; 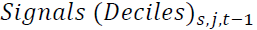 denotes the decile ranking(0-1)
for s signal of firm j in year t-1; s indicates individual fundamental variables, RNOA, GNOA, SNOA, ATOC, PMC, ACC of firm j in year t-1. Then, using the estimation coefficients of six
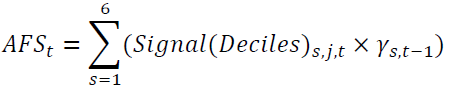
fundamental variables above, we calculate aggregate fundamental score (AFS), which is
comprehensive information about future earning change gathered from the information contents
of individual fundamental variables. AFS is measured as the sum of individual scores, which is
calculated as the decile rankings of each variable in year t multiplied by each coefficient
denotes the decile ranking(0-1)
for s signal of firm j in year t-1; s indicates individual fundamental variables, RNOA, GNOA, SNOA, ATOC, PMC, ACC of firm j in year t-1. Then, using the estimation coefficients of six
fundamental variables above, we calculate aggregate fundamental score (AFS), which is
comprehensive information about future earning change gathered from the information contents
of individual fundamental variables. AFS is measured as the sum of individual scores, which is
calculated as the decile rankings of each variable in year t multiplied by each coefficient  estimated form the LOGIT regression. We postulate that the higher level of AFS signifies the
lower audit risk.
estimated form the LOGIT regression. We postulate that the higher level of AFS signifies the
lower audit risk.
 (2)
(2)
Abnormal Audit Fee and Hours
In this study, we estimate abnormal audit fee and abnormal audit hours as measures of resulting variables for auditors to use fundamental variable. While normal fees are determined by factors that are common across different clients such as client size, client complexity, and clientspecific risk, abnormal fees are determined by factors that are idiosyncratic to a specific client. Considering that the fees paid to auditors reflect auditors’ effort costs and litigation risk (Simunic, 1980), the observed differences in the level of abnormal fees across clients are more likely to reflect differences in effort costs and client-specific risk across clients.
Generally, one of the decisive factors for audit fees and audit hours is firm size (Simunic, 1980; Palmrose, 1989). Firm size is reported to be related to other financial variables in company (O’keefe et al., 1994). Thus, the firm size tends to account for most of explanatory power in estimating regression model for audit fees or hours compared to other variables. Thus, the models to determine abnormal audit fees and audit hours are as follows. Dependent variables, Aud_Fee and Aud_Time, indicate the actual audit fees and audit hours respectively and SIZE denotes firm size measured as logarithm of total asset.
 (3)
(3)
 (4)
(4)
As results of regression, the predicted values in two models are estimated as normal level of audit fees and audit hours, respectively. Then, abnormal audit fees and hours are measured as the difference between actual values and predicted values, scaled by actual values (Lennox et al., 2006).
 (5)
(5)
 (6)
(6)
Abnormal audit fees (hours) which have positive values indicates higher fees (hours) than the normal, implying that more effort costs and litigation risk.
Test Model Specification
To test the relationship between AFS and auditor’s efforts (i.e., abnormal audit fees and hours), we estimate the following models:
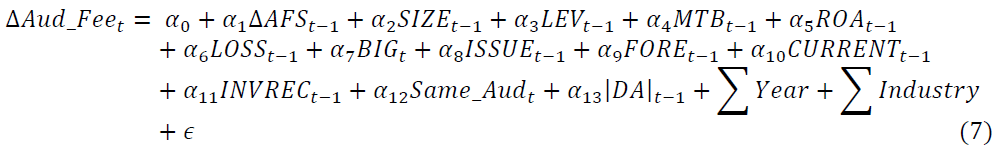
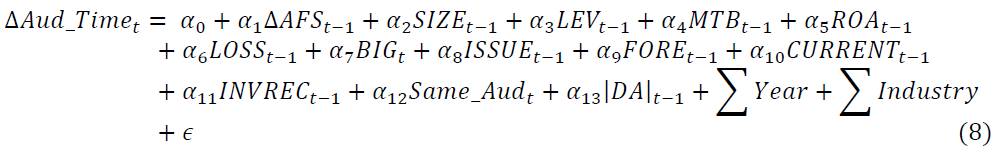
The subscripts js (firm) are omitted from all variables. Variable definitions are as follows. Variables Definition:
Aud_Fee = Logarithm of audit fees
Aud_ ime = Logarithm of audit hours
Aud_FeeABN = Abnormal audit fees estimated from equation (3) & (5)
Aud_ imeABN = Abnormal audit fees estimated from equation (4) & (6)
ΔAud_FeeABN = Change in abnormal audit fees
ΔAud_ imeABN = Change in abnormal audit hours
AFS = Aggregate fundamental score
ΔAFS = Change in aggregate fundamental score
SIZE = Firm size, logarithm of total asset
LEV = Firm leverage, total liability divided by total equity
MTB = Firm growth, market value to book value ratio
ROA = Return on asset, net income divided by total asset
LOSS = Indicator variable, 1 if net income is positive, 0 otherwise
BIG = Indicator variable, 1 if big4 auditor is engaged, 0 otherwise
ISSUE = Indicator variable, 1 if external financing exists, 0 otherwise
FORE = Foreign investment ownership (%)
CURRENT = Current asset to total asset ratio
INVREC = Sum of inventories and account receivables divided by total asset
|DA| = Absolute value of discretionary accruals
The dependent variables, auditor’s efforts are substituted by ΔAud_Fee or ΔAud_ ime and our interesting independent variable is ΔAF . We impose a one-year lag between dependent variables and independent variables to test whether financial statement information in year t-1 affects auditors’ efforts (i.e., abnormal audit fees and hours) in year t. If the regression analysis results of this model support our hypothesis that the higher level of AFS is significantly associated with lower audit fees in model (1), which means the higher change of AFS leads auditors to put their effort into audit, then α1 of ΔAFS is expected to be negative. Similarly, α1 of ΔAFS in model (2) is also expected to be negative.
Empirical Results
Sample selection criteria
To test our hypotheses, we use KSE listed firms with December-ended fiscal year from 2006 to 2016. Also we impose following restriction:
1. Firm-years in financial and insurance industry
2. Firm-years with non-unqualified opinion
3. Firm-years with missing data on financial variables
4. Firm-years with missing data on audit fees or audit hours
Firstly, we exclude firm-years with financial and insurance industry because of the accounting practices and financial data attributes distinct from non-financial industry. Also, since firms with capital impairment are likely to be financially distressed, these are accepted from our sample so as not to influence the results. We retrieve available financial data from Data Guide Pro database provided by FnGuide (http://www.fnguide.co.kr) and audit fees and hours from TS2000 (http://www.kocoinfo.com/). Lastly, all test variables are winsorized at 1% of top and bottom in each distribution to mitigate the impact of outliers on results. The final sample is 5,908 firm-year observations.
Descriptive statistics
Table 2 presents the descriptive statistics of our test variables. Our primary variable, AFS, ranges from -1.196 to 0.091, similar to prior literature on fundamental analysis in Korean stock market. ΔAud_Fee ABN and ΔAud_Time ABN as dependent variables have nearly zero mean values, respectively. Since our sample is restricted to firm-years with non-impairment of capital, firms leverage and market to book value measures are positive. The variable BIG has mean value of 0.679, meaning 67.9% of our sample is engaged in BIG4 auditors. The mean value of Same_Aud is 0.837, indicating that more than 83% of our samples keep their auditors the same at least between two consecutive years. This ensures our test to make use of the change value of main variables to investigate auditors responding to fundamental variable (AFS) as a measure of audit risk.
| Table 2 Descriptive Statistics | |||||
| Variable | Mean | Std.dev | Median | Min | Max |
| Aud_Fee | 11.517 | 0.790 | 11.339 | 9.903 | 14.346 |
| Aud_ ime | 7.135 | 0.818 | 6.985 | 5.273 | 9.874 |
| Aud_FeeABN | -0.001 | 0.034 | 0.000 | -0.118 | 0.096 |
| Aud_ imeABN | -0.003 | 0.060 | 0.001 | -0.235 | 0.166 |
| ΔAud_FeeABN | 0.000 | 0.015 | 0.000 | -0.067 | 0.096 |
| ΔAud_ imeABN | 0.001 | 0.036 | -0.002 | -0.130 | 0.201 |
| AFS | -0.516 | 0.251 | -0.510 | -1.196 | 0.091 |
| ΔAFS | -0.003 | 0.322 | -0.002 | -0.848 | 0.847 |
| SIZE | 19.773 | 1.498 | 19.502 | 16.723 | 24.146 |
| LEV | 1.109 | 1.368 | 0.740 | 0.007 | 18.935 |
| MTB | 1.223 | 1.161 | 0.869 | 0.145 | 12.014 |
| ROA | 0.022 | 0.081 | 0.028 | -0.506 | 0.258 |
| LOSS | 0.219 | 0.413 | 0.000 | 0.000 | 1.000 |
| BIG | 0.679 | 0.467 | 1.000 | 0.000 | 1.000 |
| ISSUE | 0.813 | 0.390 | 1.000 | 0.000 | 1.000 |
| FORE | 0.102 | 0.139 | 0.041 | 0.000 | 0.691 |
| CURRENT | 0.416 | 0.183 | 0.416 | 0.011 | 0.865 |
| INVREC | 0.277 | 0.156 | 0.278 | 0.000 | 0.675 |
| Same_Aud | 0.837 | 0.370 | 1.000 | 0.000 | 1.000 |
| |DA| | 0.050 | 0.054 | 0.035 | 0.000 | 1.097 |
Variables Definition:
Aud_Fee = Logarithm of audit fees
Aud_ ime = Logarithm of audit hours
Aud_FeeABN = Abnormal audit fees estimated from equation (3) & (5)
Aud_ imeABN = Abnormal audit fees estimated from equation (4) & (6)
ΔAud_FeeABN = Change in abnormal audit fees
ΔAud_ imeABN = Change in abnormal audit hours
AFS = Aggregate fundamental score
ΔAFS = Change in aggregate fundamental score
SIZE = Firm size, logarithm of total asset
LEV = Firm leverage, total liability divided by total equity
MTB = Firm growth, market value to book value ratio
ROA = Return on asset, net income divided by total asset
LOSS = Indicator variable, 1 if net income is positive, 0 otherwise
BIG = Indicator variable, 1 if big4 auditor is engaged, 0 otherwise
ISSUE = Indicator variable, 1 if external financing exists, 0 otherwise
FORE = Foreign investment ownership (%)
CURRENT = Current asset to total asset ratio
INVREC = Sum of inventories and account receivables divided by total asset
Same_Aud = Indicator variable, 1 if auditor is the same as the previous, 0 otherwise
|DA| = Absolute value of discretionary accruals
Multivariate regression analysis
In this section, we conduct a multiple regression for test our hypotheses to investigate more elaborately the relation between ΔAFS and ΔAUD_FeeABN or ΔAUD_TimeABN by controlling for other factors of audit fees or audit hours. We regress a lagged ΔAFS on ΔAUD_FeeABN with other variables controlled in model. As presented in Table 3, we find ΔAFS is negatively related to ΔAUD_FeeABN. The coefficients of ΔAFS are -0.004 (robust t-statistic=- 4.50) for raw value of ΔAFS and -0.032 (robust t-statistic=-4.50) for decile ranks of ΔAFS, respectively. These results indicate that the level of ΔAFS is likely to connote ex-ante information of audit risk, which determines audit fees and audit hours.
| Table 3 Fundamental Score (AFS) and Abnormal Audit Fees | ||||||
 |
||||||
| Variables | Raw value of ∆AFS | Decile Rank of ∆AFS | ||||
| Coef. | t-stat. | Coef. | t-stat. | |||
| Const. | 0.005 | 1.65 | * | 0.005 | 1.65 | * |
| ΔAFSt-1 | -0.004 | -4.50 | *** | -0.032 | -4.50 | *** |
| SIZEt-1 | -0.001 | -3.45 | *** | -0.001 | -3.45 | *** |
| LEVt-1 | 0.001 | 3.34 | *** | 0.001 | 3.34 | *** |
| MTBt-1 | 0.000 | 0.13 | 0.000 | 0.13 | ||
| ROAt-1 | -0.021 | -4.48 | *** | -0.021 | -4.48 | *** |
| LOSSt-1 | -0.001 | -1.05 | -0.001 | -1.05 | ||
| BIGt | 0.003 | 7.61 | *** | 0.003 | 7.61 | *** |
| ISSUEt-1 | -0.001 | -1.22 | -0.001 | -1.22 | ||
| FORE t-1 | 0.002 | 1.49 | 0.002 | 1.49 | ||
| CURRENTt-1 | -0.001 | -0.64 | -0.001 | -0.64 | ||
| INVRECt-1 | 0.000 | -0.11 | 0.000 | -0.11 | ||
| Same_Audt | 0.006 | 8.35 | *** | 0.006 | 8.35 | *** |
| |DA|t-1 | -0.020 | -3.88 | *** | -0.020 | -3.88 | *** |
| Fixed effect | Industry, year | Industry, year | ||||
| Firm clustered SE | Yes | Yes | ||||
| Adjusted | 0.05 | 0.05 | ||||
| F-stat. | 11.48*** | 11.48*** | ||||
| # of observations | 5,908 | 5,908 | ||||
| The notations *, **, and *** denote the significant at 10%, 5% and 1% level, respectively. Refer to Table 1 for the variable definitions. | ||||||
Table 4 presents the relation between ΔAFS and ΔAUD_TimeABN.Similar to the relation between ΔAFS and ΔAUD_FeeABN , ΔAFS is negatively related to ΔAUD_TimeABN. The coefficients of ΔAFS are -0.004 (robust t-statistic=-5.42) for raw value of ΔAFS and -0.082 (robust t-statistic=-5.42) for decile ranks of ΔAFS, respectively. These results imply that auditors are less likely to put their effort into audit, also indicating that the level of ΔAFS is likely to signify the information on audit risk on which audit fees and audit hours are decided.
| Table 4 Fundamental Score (AFS) and Abnormal Audit Hours | ||||||
 |
||||||
| Variables | Raw value of ∆AFS | Decile Rank of ∆AFS | ||||
| Coef. | t-stat. | Coef. | t-stat. | |||
| Const. | 0.001 | 0.21 | 0.001 | 0.21 | ||
| ΔAFSt-1 | -0.009 | -5.42 | *** | -0.082 | -5.42 | *** |
| SIZEt-1 | 0.000 | 0.86 | 0.000 | 0.86 | ||
| LEVt-1 | -0.001 | -3.01 | *** | -0.001 | -3.01 | *** |
| MTBt-1 | 0.000 | -0.63 | 0.000 | -0.63 | ||
| ROAt-1 | -0.046 | -5.00 | *** | -0.046 | -5.00 | *** |
| LOSSt-1 | 0.002 | 1.05 | 0.002 | 1.05 | ||
| BIGt | 0.006 | 6.86 | *** | 0.006 | 6.86 | *** |
| ISSUEt-1 | -0.001 | -1.13 | -0.001 | -1.13 | ||
| FORE t-1 | 0.000 | -0.14 | 0.000 | -0.14 | ||
| CURRENTt-1 | -0.002 | -0.43 | -0.002 | -0.43 | ||
| INVRECt-1 | 0.006 | 1.38 | 0.006 | 1.38 | ||
| Same_Audt | -0.006 | -3.51 | *** | -0.006 | -3.51 | *** |
| |DA|t-1 | -0.016 | -1.86 | * | -0.016 | -1.86 | * |
| Fixed effect | Industry, year | Industry, year | ||||
| Firm clustered SE | Yes | Yes | ||||
| Adjusted | 0.03 | 0.03 | ||||
| F-stat. | 6.48*** | 6.48*** | ||||
| # of observations | 5,908 | 5,908 | ||||
| The notations *, **, and *** denote the significant at 10%, 5% and 1% level, respectively. Refer to Table 1 for the variable definitions. | ||||||
Additional Test: Audit Fee per Hour as a Proxy for Audit Effort
In this section, we examine whether the fundamental variable is able to explain audit risk using audit fee per hour as response to change in AFS. This is because audit fees are likely to correlated with audit hours, and audit fee or audit hour itself may not reflect appropriately auditors’ effort (Simunic, 1980). We regress a lagged ΔAFS on ΔHourly_Fee with other variables controlled in model. The variable ΔHourly_Fee is measured as the logarithm of audit fee per hour. As presented in Table 5, we find ΔAFS is negatively related to ΔHourly_Fee as well. The coefficients of ΔAFS are -0.004 (robust t-statistic= -2.57) for raw value of ΔAFS and -0.039 (robust t-statistic= -2.57) for decile ranks of ΔAFS, respectively. These results indicate that the higher level of ΔAFS has auditors less endeavor, suggesting that the level of ΔAFS is likely to connote ex-ante information of audit risk, which determines audit fees and audit hour.
| Table 5 Fundamental Score (AFS) and Audit Fee Per Hour | ||||||
 |
||||||
| Variables | Raw value of ∆AFS | Decile Rank of ∆AFS | ||||
| Coef. | t-stat. | Coef. | t-stat. | |||
| Const. | -0.010 | -1.85 | * | -0.010 | -1.85 | * |
| ΔAFSt-1 | -0.004 | -2.57 | ** | -0.039 | -2.57 | ** |
| SIZEt-1 | 0.000 | -0.80 | 0.000 | -0.80 | ||
| LEVt-1 | 0.001 | 2.05 | ** | 0.001 | 2.05 | ** |
| MTBt-1 | 0.000 | 0.00 | 0.000 | 0.00 | ||
| ROAt-1 | 0.006 | 0.73 | 0.006 | 0.73 | ||
| LOSSt-1 | 0.002 | 1.27 | 0.002 | 1.27 | ||
| BIGt | -0.002 | -2.97 | *** | -0.002 | -2.97 | *** |
| ISSUEt-1 | 0.000 | 0.11 | 0.000 | 0.11 | ||
| FORE t-1 | 0.004 | 1.48 | 0.004 | 1.48 | ||
| CURRENTt-1 | -0.003 | -0.88 | -0.003 | -0.88 | ||
| INVRECt-1 | -0.001 | -0.36 | -0.001 | -0.36 | ||
| Same_Audt | 0.012 | 7.90 | *** | 0.012 | 7.90 | *** |
| |DA|t-1 | 0.018 | 1.83 | * | 0.018 | 1.83 | * |
| Fixed effect | Industry, year | Industry, year | ||||
| Firm clustered SE | Yes | Yes | ||||
| Adjusted | 0.05 | 0.05 | ||||
| F-stat. | 9.93*** | 9.93*** | ||||
| # of observations | 5,908 | 5,908 | ||||
The notations *, **, and *** denote the significant at 10%, 5% and 1% level, respectively. Refer to Table 1 for the variable definitions. Audit fee per hour is measured as the logarithm of audit fee per hour as follows. 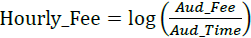 |
||||||
Conclusion
We examine whether the auditors use the information in fundamental variable (AFS) in assessing audit risk. We postulate that the fundamental variable as a comprehensive accounting quality index provide auditors with the information on audit risk and test the relationship between AFS and abnormal audit fees and hours. For our analysis, we use KSE listed firms with December-ended fiscal year from 2006 to 2016. The empirical results show that the changes in abnormal audit fees and audit hours are negatively associated with the level of AFS change. This means audit fees and hours as proxies for audit effort decrease in AFS which reflects audit risk, indicating the increased AFS level leads auditors to spend less time in auditing. After all, this suggests that auditors take account AFS information into assessing audit risk. This study confers insight into fundamental variables (AFS) through financial statement analysis in terms of informational usefulness in assessing audit risk.