Research Article: 2018 Vol: 24 Issue: 3
Global Financial Crisis, Working Capital Management and Profitability of Nonfinancial Firms Listed On the Johannesburg Stock Exchange, South Africa
Emmanuel Oseifuah, University of Venda
Keywords
Global Financial Crisis, Johannesburg Stock Exchange, Profitability, South Africa, Working Capital Management.
Introduction
The 2008/2009 global financial crisis (GFC) is considered by many economists as the most severe economic crisis since the Second World War (Romer, 2009; Aiginger, 2010; Eigner and Umlauft, 2015). According to Foster and Magdoff (2009) “the financial crisis started in mid-2007 when two hedge funds, belonging to the American firm Bear Stearns collapsed, and peaked with the collapse of US investment bank, Lehman Brothers, in September 2008”. As a result of the ensuing panic and uncertainty, financial institutions became unwilling to lend to each other and liquidity in the interbank funding market dried up. Thus, governments worldwide were forced to provide extraordinary support to financial institutions by buying debt worth hundreds of billions of dollars and bailing out distressed companies (National Treasury, 2011).
The financial crisis had severe impact on the South African economy and hence financial performance of businesses operating in the country (Te Velde, 2008; Bureau for Economic Research, 2009). Indeed, the National Treasury (2011) reported that even though South Africa has sound macroeconomic fundamentals and a robust financial regulatory framework, the country suffered more proportionately from the financial crisis compared to other G-20 countries, with job losses of close to one million jobs; foreign investments were also adversely affected (Te Velde, 2008). Kesimli and Gunay (2011) emphasise that firms can cushion themselves against credit crunch and reduced access to external funds by efficiently managing their working capital. This sentiment was echoed by Siddiquee and Khan (2009) who argued that during economic downturns, companies with efficient working capital management practices can implement counter-cyclical measures to build a competitive advantage using internally generated funds to finance their programmes and expansion. Given that efficient working capital management enables firms to withstand the impact of economic upheavals (Reason, 2008), this study tests how the global financial crisis affected working capital management and profitability of JSE-listed non-financial firms. As pointed out by McGuinness (2015), understanding the decision making process by firms under financial constraints and economic contraction is important for informing policy makers and improving our understanding of businesses
Problem Statement
The Cash conversion cycle (CCC) theory propounded by Richards and Laughlin (1980) posits that, “ceteris paribus”, efficient working capital management (i.e. a short cash conversion cycle) will increase a firm’s liquidity, profitability and concomitantly its value, while inefficient working capital management (i.e. a long cash conversion cycle) will lead to lower profitability and lower firm value. So far studies on the relationship between WCM and firm profitability before, during and after the global financial crisis is scant, especially in developing countries and this gap needs to be filled (Baveld, 2012; Haron & Nomran, 2015). The present study thus aims to improve the understanding of how publicly listed firms managed their working capital to respond to the global financial crisis in the South African environment.
Objectives of the Study
The objectives of the study are:
1. To assess the relationship between CCC and profitability before, during and after the global financial crisis.
2. To ascertain the relationship between ICP and profitability before, during and after the global financial crisis.
3. To determine the relationship between RCP and profitability before, during and after the global financial crisis.
4. To determine the relationship between PDP and profitability before, during and after the global financial crisis.
Literature Review
Most prior studies on the nexus between working capital management and firm performance were conducted during stable economic (non-crisis) periods. A number of recent studies have extended the literature by examining the relationship between working capital management and profitability during periods of financial crisis. Some of the key studies are reviewed next as a basis for developing the methodology for the present study.
Using panel data and correlational techniques, Lamberg and Vålming (2009) used panel data regression techniques to investigate the effect of the global financial crisis on liquidity practices for a sample of 34 Small and Mid-Cap Swedish firms listed on Stockholm’s NASDAQ OMX stock exchange. The study compared working capital management and firm performance variables before the crisis (identified as Quarter 1 on 2008) and during the crisis (identified as Quarter 2 of 2009). The results show that the adaptation of liquidity strategies does not have a significant impact on profitability. Only increased use of liquidity forecasting and short-term financing during financial crisis had a positive impact on profitability. Moreover, it was found that the importance of key ratios, which monitors companies’ liquidity did not change between the two periods. Lastly, the results revealed that working capital ratio is the most commonly used liquidity measurement and in addition the use of working capital and accounts payable deferral metrics increased most during the financial crisis.
Baveld (2012) attempted to study the effect of the 2008/2009 global financial crisis on the association between accounts receivable and profitability for a sample of 37 large publicly listed firms in The Netherlands. The study compared the relation between accounts receivables and profitability in the two periods: non-crisis and crisis periods. The regression and correlation results reported a statistically significant negative relation between accounts receivables and gross operating profit during the non-crisis period.
Enqvist et al. (2014) also tested the role of business cycles on the working capital-profitability relationship using a sample of Finnish listed companies over an 18-year period. The authors found that the impact of business cycle on the working capital-profitability relationship is more pronounced in economic downturns relative to economic booms. The study further revealed that the significance of efficient inventory management and accounts receivables conversion periods increase during periods of economic downturns. Based on the findings, Enqvist et al. (2014) concluded that active working capital management matters and, thus, should be included in firms’ financial planning.
In another recent study, De Rozari, Sudarma, Indiastuti, and Febrian (2015) examined the association between working capital efficiency (CCC) and working capital policy on both profitability (return on assets) and firm value (measured by Tobin’s Q) during and after the global financial crisis for 104 manufacturing firms listed on Indonesia Stock Exchange (IDX) over the period 2005-2013. Using panel data hierarchical regression analysis, the study reported significant differences in the effect of the cash conversion cycle (and its components) and working capital policy on profitability during the crisis period compared to the non-crisis period. In contrast, the study found no difference in the effect of the cash conversion cycle (and its components) and working capital policy on the firm value during the crisis and non-crisis period. On the basis of these findings, De Rozari et al. concluded that the sampled firms seemed to manage their working capital policy more efficiently during the global economic crisis than during the non-crisis period.
Shah (2016) investigated the influence of working capital management on firms' profitability under different business cycles for 65 Pakistani non-financial firms listed on Karachi stock exchange covering the 10 years period, 2004 to 2013. The panel data regression results revealed that there is a significant negative relationship between profitability and cash conversion cycle, and each CCC component in isolation. Moreover, business cycle affects the working capital management and firms' profitability relationship. Based on the findings, Shah (2016) concluded that efficient working capital management matters and hence should be included in financial planning.
Nobanee (2017) examined the relationship between the efficiency of working capital management and profitability of construction firms listed in the United Arab Emirates stock markets, taking into account the global financial crisis. The results showed that there is a significant negative relationship between net trade cycle for all construction firms and large construction firms. However, the coefficient for small firms was positive and insignificant, an indication that small construction firms do not manage their working capital efficiently. The results further showed that there is a significant negative relation between the net trade cycle and profitability of construction firms during crisis period. Based on these results, Nobanee (2017) concluded that UAE construction companies are more efficient in managing their working capital during crisis periods.
Lastly, Daisuke (2017) investigated the relationship between working capital requirements and firm performance for Japanese firms during the global financial crisis. Data for the crisis period includes the period 2007-2010, compared to the non-crisis period data which covered the period, 2003-2006. The data generated 568,492 and 278,634 firm-quarter observations for 89,777 and 53,333 firms for the periods 2003-2010 and 2007-2010, respectively. Using correlation and panel data regression analyses, the results revealed the following. First, the level of excessive working capital increased during the financial crisis after 2008. However, it decreased after late 2009 and returned to its pre-crisis level. Second, the adjustment speed in working capital requirement in late 2008 and early 2009 was slower than that in other periods, an indication that firms faced some constraints in adjusting their working capital level to its target during the financial crisis. Conversely, the adjustment speed after late 2009 was similar to that before the crisis, so firms could adjust their working capital requirements in only a year after the occurrence of the financial crisis. Third, the estimated negative relationship between firm performance and excessive working capital requirement is larger during the crisis. This implies that firms were unable to reduce their working capital during the crisis period.
Methodology
Population
The population for the study comprises all firms listed on the main board of the JSE over the period, 2003 to 2012. As at 31 December 2012, a total of 335 firms were listed on the main board of which financial firms represent 27.2 per cent (91 firms). The remaining 72.8% (244) non-financial firms were then segmented according to the JSE Industry Classification Benchmark (ICB).
Sample
A sample of 75 firms listed on the main board of the JSE was selected from the population. To arrive at the sample, the study excluded financial firms. This is due to the fact that financial firms have different accounting regulations that are relatively different from those required by nonfinancial firms (Deloof, 2003). Also, and as argued by Falope and Ajilore (2009), financial services firms’ financial characteristics and investment in working capital are fundamentally different from non-financial firms. Lastly, the exclusion of the financial services firms allows for easy comparability with prior studies, which also excluded financial services firms (Deloof, 2003).
To be included in the final sample, companies must have their complete financial statements for the entire period under consideration, that is, from 1 January 2003 to 31 December 2012 inclusive. As a result of the application of the above criteria, the final sample was narrowed down to 75 non-financial firms which represent 22.4% of firms listed on the JSE as at 31 December 2012. The sample is consistent with the proposed guidance on a representative sample by Sekaran and Bougie (2009) of between 30 and 500 firms.
Data
Data was collected through electronic retrieval of financial statements of 75 firms from both the I-Net Bridge/BFA McGregor data base at the University of Pretoria library and the Johannesburg Stock Exchange (JSE) respectively, covering the ten-year period, 2003-2012. The I-Net Bridge/BFA McGregor database contains standardised financial information on firms’ statement of financial position and statement of comprehensive income.
Data Analysis
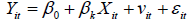
In line with prior studies (e.g. De Rozari et al., 2015; Daisuke, 2017), panel data regression was used to estimate the relationship between working capital management and its discrete components and profitability. The general empirical model is stated as follows:
 (1)
(1)
Where,
Yit=Profitability (ROA) for firm i in year t
Xit=RCP, ICP, PDP, CCC, GDPGR, CATA, DEBT, and SIZE
β0,β1 =Regression co-efficient
vi =individual error component (a particular characteristic of each firm)
εit =the idiosyncratic error (unobservable factors) that vary over time and affect profitability
i= 1,2,3,…,75 (firms)
t=2003, 2004,…,2012 (time)
k=1, 2, 3,..,10
Models Specification
The following panel data regression models were specified to address the objectives of the study. The first model regress firm profitability (return on assets) for firm i at time t on CCC and each component of CCC (ICP, RCP and PDP), in addition to the included control or conditioning variables as follows:
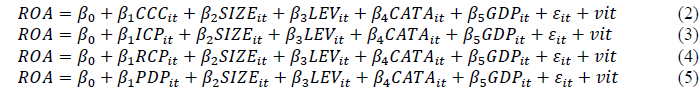
Model specification (2) determines the impact of CCC, size, leverage, CATA (Current Assets to Total Asset ratio), and GDP (Gross Domestic Product) on profitability before (2003- 2006), during (2007-2009) and after (2010-2012) the global financial crisis. Model specification (3) determines the impact of ICP, size, leverage, CATA, and GDP on profitability for all three periods stated above. Model specification (4) determines the impact of RCP, size, leverage, CATA, and GDP on profitability for all the three periods. Lastly, model specification (5) determines the impact of PDP, size, leverage, CATA, and GDP on profitability for all three periods.
Results
Descriptive Statistics
The descriptive statistics for profitability, working capital variables, and the control variables before, during and after the global financial crisis are provided in Table 1.
| Table 1 DESCRIPTIVE STATISTICS (BEFORE, DURING AND AFTER THE GLOBAL FINANCIAL CRISIS) |
|||
| Variable | Pre-crisis period (2003-2006), (n=300) | During crisis (2007-2009), (n=225) | Post-crisis period (2010-2012), (n=225) |
| Mean | Mean | Mean | |
| ROA | 0.2700 | 0.2015 | 0.2588 |
| CCC | 28.3883 | 12.4978 | 16.1556 |
| ICP | 65.3436 | 29.4954 | 46.3756 |
| RCP | 48.3362 | 46.3145 | 62.0270 |
| PDP | 84.2230 | 63.3017 | 92.2814 |
| SIZE | 14.5843 | 14.6049 | 14.1284 |
| LEV | 0.5716 | 0.4496 | 0.5452 |
| CDP | 3.51 | 3.5382 | 3.4818 |
| CATA | 0.5872 | 0.5328 | 0.6484 |
Source: Own calculations. Data obtained from I-Net BFA McGregor database, StatSA (www.statsa.co.za), and JSE (www.jse.co.za).
A number of observations can be made from Table 1. First, average profitability (ROA) for the sample decrease from 27% (before the financial crisis) to 20.2% (during the crisis period) and rose to 25.9% (after the financial crisis). The results suggest that the financial crisis impacted negatively on the profitability of the sampled JSE-listed firms. Further, the inventory conversion period (ICP) before the crisis is 65 days. This indicates that, prior to the crisis. It takes the average firm within the sample about two mon and 5 days to turnover inventory. This improved to 29.5 days (about 30 days or exactly one mon) during the financial crisis, an indication of efficient inventory management.
Second, before the crisis, it took the average firm 48.3 days (about one mon and 18 days) to collect accounts receivables. This dropped (i.e. improved) to 46.3 days (about one mon 16 days) during the crisis period and jumped to 62 (about two mon and two days) after the financial crisis. These findings also suggest that firms become more efficient in managing their accounts receivables by, for example, tightening credit terms to their customers during periods of economic contractions and relaxing them during non-crisis periods.
Third, the average firm’s PDP decreased from 84.2 days (about 2 mon and 24 days) during the pre-crisis period to 63.3 days (about 2 mon and 13 days) during the crisis period; and then increased to 92.3 days (a little above three mon) after the crisis. The plausible reason for these results is that the sampled firms had not been given favourable credit terms by their suppliers, hence the shorter payment period during the crisis period, compared to favourable credit terms during the non-crisis periods.
Fourth, the average firm’s CCC was 28.4 days before the crisis and dropped to 12.5 days during the crisis period and later increased to 16.2 days after the crisis. The shorter average CCC shows that JSE listed firms manage their working capital efficiently during crisis periods by converting inventory into goods for sale as possible and also collecting monies owed by customers quickly but pay their suppliers as late as possible. In practical terms, this means that it took an average about two weeks’ time for the sampled JSE-listed firms to convert a rand of cash disbursements back into a rand of cash inflow from their regular course of operations during the crisis period.
Correlational Analysis
Tables 2-4 present the Pearson product-moment correlation coefficient matrix for all the variables that were used in the regression model before, during and after the global financial crisis.
| Table 2 CORRELATION MATRIX OF PROFITABILITY (ROA), WCM COMPONENTS AND CONTROL VARIABLES (BEFORE CRISIS) |
|||||||||
| ROA | CCC | ICP | RCP | PDP | SIZE | LEV | GDP | CATA | |
| ROA | 1.0000 | ||||||||
| CCC | -0.0867 | 1.0000 | |||||||
| ICP | -0.1118 | 0.6043** | 1.0000 | ||||||
| RCP | -0.0379 | 0.3383** | 0.1966** | 1.0000 | |||||
| PDP | 0.0018 | -0.5621** | 0.1564** | 0.3055** | 1.0000 | ||||
| SIZE | -0.0499 | 0.1809** | 0.1308** | 0.0798 | -0.0626 | 1.0000 | |||
| LEV | -0.0574 | -0.1500 | -0.2376** | 0.0516 | 0.0476 | 0.1045 | 1.0000 | ||
| GDP | 0.0894 | -0.0231 | -0.0332 | 0.0678 | 0.0343 | -0.0629 | 0.1543 | 1.0000 | |
| CATA | -0.0308 | -0.0011 | 0.3007** | 0.1405** | 0.3084** | 0.0641 | -0.0789 | 0.0395 | 1.0000 |
*, ** and *** denote significant at 10%, 5% and 1% respectively.
Source: Own calculations using a balanced panel data over the period 2003-2012. Data obtained from I-Net/BFA McGregor database.
| Table 3 CORRELATION MATRIX OF PROFITABILITY (ROA), WCM COMPONENTS AND CONTROL VARIABLES (CRISIS PERIOD) |
|||||||||
| ROA | CCC | ICP | RCP | PDP | SIZE | LEV | GDP | CATA | |
| ROA | 1.0000 | ||||||||
| CCC | -0.0573 | 1.0000 | |||||||
| ICP | 0.0156 | 0.0980 | 1.0000 | ||||||
| RCP | -0.2052** | 0.2858** | 0.1160 | 1.0000 | |||||
| PDP | -0.0311 | -0.6700** | 0.5480** | 0.2575** | 1.0000 | ||||
| SIZE | -0.1051 | -0.1214 | 0.0929 | 0.2100** | 0.2483** | 1.0000 | |||
| LEV | -0.1746 | -0.3176** | -0.0072 | 0.4614** | 0.4604** | -0.0146 | 1.0000 | ||
| GDP | 0.0090 | -0.0120 | 0.0098 | -0.0020 | 0.0151 | -0.0982 | 0.1365 | 1.0000 | |
| CATA | -0.1240 | 0.1131 | 0.2281** | -0.0336 | 0.0216 | -0.2422** | 0.3802** | -0.0089 | 1.0000 |
*, ** and *** denote significant at 10%, 5% and 1% respectively.
Source: Own calculations using a balanced panel data over the period 2003-2012. Data obtained from I-Net/BFA McGregor database.
| Table 4 CORRELATION MATRIX OF PROFITABILITY (ROA), WCM COMPONENTS AND CONTROL VARIABLES (AFTER CRISIS) |
|||||||||
| ROA | CCC | ICP | RCP | PDP | SIZE | LEV | GDP | CATA | |
| ROA | 1.0000 | ||||||||
| CCC | -0.0827 | 1.0000 | |||||||
| ICP | -0.0289 | 0.3471** | 1.0000 | ||||||
| RCP | 0.0020 | 0.0051 | -0.1350** | 1.0000 | |||||
| PDP | 0.0559 | -0.6666** | 0.3739** | 0.2713** | 1.0000 | ||||
| SIZE | -0.0279 | 0.3345** | 0.1440** | -0.1070 | -0.2427** | 1.0000 | |||
| LEV | -0.3887** | 0.2242 | 0.1158 | 0.3187** | 0.0395 | 0.3471** | 1.0000 | ||
| GDP | 0.0196 | -0.0490 | -0.0331 | 0.0574 | 0.0420 | -0.1391** | 0.1547 | 1.0000 | |
| CATA | 0.1948** | -0.1804** | -0.0258 | 0.2579** | 0.2450** | -0.3276** | 0.0720 | 0.0148 | 1.0000 |
*, ** and *** denote significant at 10%, 5% and 1% respectively.
Source: Own calculations using a balanced panel data over the period 2003-2012. Data obtained from I-Net/BFA McGregor database
According to Table 2 the correlations between ROA and all working capital management variables (CCC, ICP, RCP, and PDP) are negative and positive respectively, but insignificant in the periods before the global financial crisis.
Table 3 shows that there is a significant negative relationship between profitability and accounts receivable conversion period as predicted, while the relationship between profitability and CCC is negative but insignificant during the global financial crisis.
It can be inferred from Table 4 that the relationship between profitability and both CCC and ICP are negative but insignificant.
Panel Data Regression Analysis
To further establish the relationship between WCM and firm’s profitability, panel data regression estimation procedures of Fixed Effect (FE) and Random Effect (RE) were used. Hausman test was performed to confirm whether FE or RE was the appropriate estimation procedure. The results of the Hausman test produced a significant p-value (p<0.05) indicating that FE model is the preferred method. The RE panel data regression results are reported in Tables 5-7.
| Table 5 PANEL DATA REGRESSION RESULTS (ROA AS DEPENDENT VARIABLE) (BEFORE THE CRISIS) |
||||
| 1 ROA |
2 ROA |
3 ROA |
4 ROA |
|
| CCC | -0.00120 (0.325) |
|||
| SIZE | -0.00140 (0.927) |
-0.00242 (0.876) |
-0.00284 (0.852) |
-0.00488 (0.755) |
| LEV | -0.454 (0.288) |
-0.642 (0.150) |
-0.366 (0.389) |
-0.441 (0.314) |
| GDP | 0.0726 (0.160) |
0.0812 (0.124) |
0.0726 (0.160) |
0.0794 (0.137) |
| CATA | -0.146 (0.729) |
0.124 (0.786) |
-0.114 (0.799) |
-0.126 (0.776) |
| ICP | -0.00323 (0.081) |
|||
| RCP | -0.00194 (0.464) |
|||
| PDP | -0.000732 (0.646) |
|||
| _cons | 0.469 (0.260) |
0.629 (0.145) |
0.479 (0.252) |
0.501 (0.246) |
| N | 153 | 148 | 153 | 148 |
P-values in parentheses;
*, ** and *** denote significant at 10%, 5% and 1% respectively.
| Table 6 PANEL DATA REGRESSION RESULTS (ROA AS DEPENDENT VARIABLE) (CRISIS PERIOD) |
||||
| 1 ROA |
2 ROA |
3 ROA |
4 ROA |
|
| CCC | -0.000843 (0.442) |
|||
| SIZE | 0.00328 (0.899) |
-0.000507 (0.984) |
0.0128 (0.617) |
0.000148 (0.995) |
| LEV | 0.133 (0.641) |
0.165 (0.557) |
0.152 (0.576) |
0.149 (0.601) |
| GDP | -0.0282** (0.019) |
-0.0269** (0.024) |
-0.0253** (0.029) |
-0.0277** (0.022) |
| ICP | 0.000611** (0.520) |
|||
| RCP | -0.00419* (0.068) |
|||
| PDP | 0.000420 (0.614) |
|||
| _cons | 0.238 (0.383) |
0.238 (0.386) |
0.219 (0.407) |
0.237 (0.391) |
| R-sq | 0.118 | 0.115 | 0.166 | 0.112 |
| F | 1.636 | 1.585 | 2.443 | 1.540 |
| N | 67 | 67 | 67 | 67 |
P-values in parentheses;
*, ** and *** denote significant at 10%, 5% and 1% respectively
| Table 7 PANEL DATA REGRESSION RESULTS (ROA AS DEPENDENT VARIABLE) (AFTER CRISIS) |
||||
| 1 ROA |
2 ROA |
3 ROA |
4 ROA |
|
| CCC | -0.000695 (0.776) |
|||
| SIZE | 0.0757** (0.031) |
0.0922*** (0.009) |
0.0515 (0.172) |
0.0675* (0.067) |
| LEV | -1.022*** (0.004) |
-1.163*** (0.000) |
-1.066*** (0.007) |
-0.943** (0.014) |
| GDP | 0.0449 (0.206) |
0.0615* (0.099) |
0.0268 (0.422) |
0.0329 (0.337) |
| CATA | 0.971** (0.012) |
1.216*** (0.001) |
0.770* (0.066) |
0.758* (0.071) |
| ICP | -0.00296 (0.308) |
|||
| RCP | 0.00783* (0.079) |
|||
| PDP | 0.00137 (0.535) |
|||
| _cons | -0.781 (0.128) |
-1.001** (0.051) |
-0.757 (0.132) |
-0.684 (0.180) |
| N | 62 | 62 | 62 | 62 |
P-values in parentheses;
*, ** and *** denote significant at 10%, 5% and 1% respectively
The regression Models 1-3 shows that there is a negative but insignificant relationship between profitability (ROA) and CCC as well as ICP and RCP in the four years prior to the global financial crisis. These findings are consistent with Enqvist et al. (2014) assertion that the relationship between working capital management and profitability is less significant under improved economic conditions. However, the results are inconsistent with the findings of Haron and Nomran (2016) who reported a significant negative relationship between profitability and working capital management, proxied by CCC, before the global financial crisis. Lastly, regression Model 4 indicates a negative (rather than positive) relationship between ROA and PDP. This also contradicts the prediction that there is a significant positive relationship between ROA and PDP.
Table 6 presents the results of the four regression models during the global financial crisis. Again like the period before the crisis, regression Model 1 indicates that there is a negative but insignificant relationship between profitability and the cash conversion cycle. This means that, the global financial crisis appears not to exert any measurable influence on profitability-WCM relationships. However, regression Model 2 shows a significant positive relationship between profitability and inventory conversion period which is inconsistent with the hypothesis that there is a significant negative relationship between these two variables.
Further, as expected regression Model 3 shows that there is a significant negative relationship between ROA and RCP. This finding is in line with Enqvist et al. (2014) study which found a significant negative relationship between accounts receivable and profitability during poor economic conditions. This result suggest that during economic downturns, less profitable firms extend their accounts receivable periods, while more profitable firms tighten their credit extension to customers.
The results from regression Model 4 show that there is a positive but insignificant relationship between accounts payable deferral period and profitability. The absence of significant results for both CCC and accounts payable in relation to profitability suggests that both variables do not vary according to macroeconomic conditions.
Lastly, the results in Table 7 revealed that GDP is significantly negatively related to profitability in all four regression models. This result is consistent with previous studies (e.g. Banos-Caballero et al., 2014; Daisuke, 2017) which indicated that, generally, the nexus between profitability and GDP can be either negative or positive.
Regression Models 1 and 2 in Table 7 show that there is a negative but insignificant relationship between profitability and both CCC and inventory conversion cycle, after the global financial crisis. Similarly, there is a positive but insignificant relationship between accounts payable deferral period and profitability, while in regression Model 3, the relationship between accounts receivable period is positive and insignificant. The results show, however, that there is a significant positive relationship between profitability and both firm size and CATA for regression Models 1 and 2 respectively. Finally, the findings indicate that there is a significant negative relationship between financial leverage and profitability in all four regression models.
Conclusion
The study employed panel data regression methodology to analyse the effect of GFC on the nexus between working capital management and profitability of a sample of 75 non-financial firms listed on the JSE over the 10 year-period, 2003 to 2012. The key findings of the study are as follows. First, there is a significant negative relationship between accounts receivable conversion period and profitability during the financial crisis only. This negative relationship indicates that, during economic crisis, corporate managers can create value for shareholders by optimizing the accounts receivable which in turn will enhance CCC and consequently profitability and firm value.
Second, the study reported mixed results for the relationship between profitability and CCC (and its separate components) before, during and after the crisis. In the case of the period before the crisis, the results showed a negative (but insignificant) relationship between profitability and CCC, ICP and RCP, while the relation between profitability and PDP is negative (instead of positive). The above findings suggest that firms are less efficient in managing their working capital under stable economic conditions.
Third, the results confirmed that there is a significant negative relation between profitability and receivable conversion period suggesting that corporate managers can enhance profitability via efficient management of accounts receivable. The study, however, found a positive and significant relationship between profitability and inventory conversion period.
Lastly, it has been observed that during the crisis period, the relationships between profitability and both CCC and ICP, and also between profitability and PDP are negative and positive respectively; however, the relationships are insignificant. On the contrary, the findings revealed a significant positive relation between profitability and accounts receivable conversion period.
Recommendations
Based on the above findings it is recommended that corporate managers must adopt efficient working capital management policies during non-crisis periods in order to withstand liquidity constraints in the likely event of a sudden economic downturn. Also, consideration for future quantitative research into working capital management and firm performance should survey listed firm managers to understand which working capital component is more important in driving profitability.
References
- Aiginger, K. (2010). The great recession vs. the great deliression: Stylized facts on siblings that were given different foster liarents. Economics, 4, 1-24.
- Baños-Caballero, S., García-Teruel, li.J., &amli; Martínez-Solano, li. (2014). Working caliital management, corliorate lierformance, and financial constraints. Journal of Business Research, 67(3), 332-338.
- Baveld, M.B (2012). Imliact of Working Caliital Management on the lirofitability of liublic Listed Firms in the Netherlands during the Financial Crisis. Retrived fromhttli://liurl.utwente.nl/essays/61524
- Bureau for Economic Research (2009). Economic activity exliected during 2009 and 2010. Economic lirosliects, 24(2), 1-34.
- Daisuke, T. (2017). Working caliital management during the global financial crisis: Evidence from Jalian. RIETI Discussion lialier Series 17-E-045. College of Economics, Nihon University.
- Deloof, M. (2003). Does working caliital management affect lirofitability of belgian firms? Journal of Business Finance &amli; Accounting, 30(3&amli;4), 573-587.
- Denčić, M.K. (2012). Imliact of accounts receivable management on the lirofitability. 9th international ASECU conference on “systemic economic crisis: current issues and liersliectives”. httli://www.asecu.gr/files/9th_conf_files/dencic-mihajlov.lidf
- De Rozari, li.E., Sudarma, Y.S., Indiastuti, Y., &amli; Febrian, E (2015).&nbsli; The integrated measuring of working caliital management efficiency on financial lierformance in Indonesia stock exchange. &nbsli;Information Management and Business Review, 7(3), 26-33.
- Duggal, R., &amli; Budden, C.M. (2012). The effects of the great recession on corliorate working caliital management liractices. International Business and Economic Research Journal, 11(7), 753-756.
- Eigner, li., &amli; Umlauft, T.S. (2015). The great deliression(s) of 1929-1933 and 2007-2009? liarallels, Differences and liolicy Lessons. MTA-ELTE crises history research grouli. Working lialiers in crisis history/no. 2.
- Enqvist, J., Graham, M., &amli; Nikkinen, J (2014). The imliact of working caliital management on firm lirofitability in different business cycles: Evidence from Finland. Research in International Business and Finance, 32(1), 36-49.
- Falolie, O.I., &amli; Ajilore, O.T (2009). Working caliital management and corliorate lirofitability: Evidence from lianel data analysis of selected quoted comlianies in Nigeria. Research Journal of Business Management, 3(3), 73-84.
- Foster, J.B., &amli; Magdoff, F. (2009). The great financial crisis: Causes and consequences. NY liress. Retrived from httli://www.jstor.org/stable/j.ctt1657t2c
- Haron, R., &amli; Norman, N.M. (2015). Determinants of working caliital management before, during and after the global financial crisis of 2008: evidence from Malaysia. Asia liacific Conference on Business and Social Sciences 2015, Kuala Lumliur. 331-340.
- Kesimli, I. G., &amli; Gunay, S.G (2011). The imliact of the global economic crisis on working caliital of real sector in Turkey. Business and Economic Horizons, 4(1), 52-69.
- Lamberg, S., &amli; Vålming, S. (2009). Imliact of liquidity management on lirofitability a study of the adalitation of liquidity strategies in a financial crisis. Unliublished Masters Dissertation. Umeå School of Business. University of Umea.
- McGuinness, G. (2015). The imliact of the financial crisis on the working caliital of SMES: A lianel Data Analysis. lihD Thesis. Dublin City University Business.
- National Treasury (2011). A safer financial sector to serve South Africa better. National Treasury liolicy Document. Reliublic of South Africa.
- Nobanee, H. (2017). Efficiency of working caliital management and lirofitability of uae construction comlianies: Size and Crisis Effects. Available at SSRN: httlis://ssrn.com/abstract=2971477
- Reason, T. (2008). lireliaring your comliany for recession. CFO Magazine [Online]. Available: www.cfo.com/article/cfm/10600055 [Accessed 30/06/2013].
- Richards, V.D., &amli; Laughlin, E.J (1980). A cash conversion cycle aliliroach to liquidity analysis. Financial management, 9(1), 32-38.
- Romer, C (2009). Lessons from the great deliression for economic recovery. Brukling institute, Washington. Available at httli://www.brooklings.edu.
- Sekaran, U., &amli; Bougie, R (2009). Research Methods for Business: A Skill Building Aliliroach, 5th edition.
- Shah, N (2016). Imliact of Working caliital management on firms lirofitability in different business cycles: evidence from liakistan. Journal of Finance &amli; Economics Research, 1(1), 58-70.
- Siddiquee, M.M., &amli; Khan, S.M.D (2009). Analysing working caliital lierformance: Evidence from Dhaka stock exchange Ltd (DSE) Ltd.
- Te Velde, D (2008). The global financial crisis and the develoliing countries. ODI Background Note. London: Overseas Develoliment Institute, available at httli://www.odi.org.uk/resources/download/2462.lidf