Research Article: 2022 Vol: 25 Issue: 4S
Graphical user interface for the application of the 'head-up display', augmented reality lane line technology in Thailand's commercial vehicles
Supaporn Nhookan, Silpakorn University Phetchaburi
Kowit Meboon, Silpakorn University Bangkok
Poom Thiparpakul, King Mongkut's University of Technology Thonburi
Nathaporn Karnjanapoomi, Silpakorn University Bangkok
Tanat Jiravansirikul, Thammasat University Bangkok
Citation Information: Nhookan, S., Meboon, K., Thiparpakul, P., Karnjanapoomi, N., & Jiravansirikul, T. (2022). Graphical user interface for the application of the ‘head-up display’, augmented reality lane line technology in Thailand’s commercial vehicles. Journal of Management Information and Decision Sciences, 25(S4), 1-9.
Keywords
Graphical User Interface, AR Lane Line technology, Head-up Display (HUD) System, Road Accidents, Commercial Vehicles
Abstract
Thailand’s traffic accidents are one of the deadliest in Southeast Asia and among the worst in the world, according to the World Health Organisation. About 20,000 people die in road accidents each year, or about 56 deaths a day. Despite continued government’s attempts to reduce road casualties, the figures show no sign of abating. Nighttime driving under difficult conditions poses a particular danger to the drivers themselves and other road users. Studies have shown a correlation between the application of the Head-up Display system (HUD) and increased safety for car drivers resulting in fewer accidents. The Augmented Reality (AR) Lane Line helps enhance the accuracy of the HUD’s navigation system and supported the proliferation of the HUD systems worldwide. This study aims to address the risks of driving at nighttime among commercial vehicles (e.g., buses and trucks) with the assistance of the HUD and AR Lane Line technology. The study investigates multiple AR Lane Line graphical interfaces to determine an appropriate one for the drivers’ behaviors, road conditions, and traffic in Thailand. Two tests were conducted with selected truck drivers and graphic designers to determine optimal AR Lane Line graphical interface for Thai commercial vehicles. Eight combinations of design interfaces were provided for the test groups to select. Based on the study, two contrasting designs were chosen by the test groups. Both designs will inform the development of two prototype AR Lane Line interfaces which will be tested by a larger commercial drivers’ group under the real driving conditions.
Introduction
According to the WHO, about 1.3 million people worldwide die from road accidents every year. More than half of the deaths are among vulnerable road users—pedestrians, cyclists, and motorcyclists. Road traffic injuries are the leading cause of death for children and young adults aged 5-29 years (WHO, 2021). In the Southeast Asia region, Thailand ranks among countries with the highest rates of traffic accident casualties. About 20,000 people die in road accidents each year, or about 56 deaths a day. Despite the government’s efforts to fight this problem, the figure does not seem to decrease.
Studies worldwide have shown a correlation between the application of the Head-up Display system (HUD) and increased road safety resulting in fewer accidents. When used with a well-designed Augmented Reality (AR) Lane Line graphic user interface, HUDs can enhance the accuracy of a navigation system, present timely information, and, therefore, lower the driver’s anxiety especially during difficult driving conditions.
This study seeks to address the risks of driving at nighttime for commercial vehicles (e.g., cargo trucks, buses) with the assistance of the AR Lane Line and HUD technologies. Increased safety for commercial vehicles is an important factor in lowered road accident fatalities as these vehicles either carry many passengers and/or likely to cause high negative impacts to people’s lives and property once accidents occur.
The study strives to prove the assumption that a HUD device with a well-designed AR Lane Line technology that is localized to Thailand’s driving conditions will enhance the ease of driving for commercial vehicle drivers, especially at nighttime. The study aims to answer the primary question: How should suitable AR Lane Line graphic interfaces in a HUD be designed (i.e., what shade of colors to use; how a navigation path should look like, how to organize on-screen objects display, etc.) to ensure the functionality and ease of use for the commercial vehicles’ drivers?
Head-Up Display Technology
A head-up display, also known as a HUD, is any transparent display that presents data without requiring users to look away from their usual viewpoints. It replaces the indicators cluster in dashboard in common cars. The technology was first developed for military aviation for use in fighter jets. The name stems from a pilot being able to view information with the head positioned "up" and looking forward, instead of angled down looking at lower instruments. A HUD also has the advantage that the pilot's eyes do not need to refocus to view the outside after looking at the optically nearer instruments. Although they were initially developed for military aviation, HUDs are now used in commercial aircraft, automobiles, and other (mostly professional) applications.
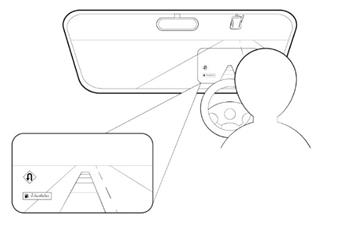
The transparent digital screen takes vital information, such as driving speed, route, engine speed, temperature, fuel capacity, navigation system, traffic signage, and warning, from the driver’s dashboard and projects it onto the driver’s viewpoint. The digital display above the dashboard makes it easier for the drivers to stay focused on the road without moving their eyes lower from their field of views which will help increase their concentration and lower the risk of crashes.
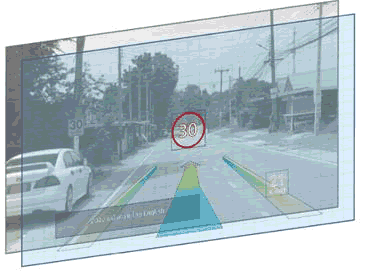
HUD technology is available in two solutions. The first solution, called ‘pop-up solution’, has a small pop-up glass panel on the driver’s dashboard console. Vital driving information is reflected on the panel within the driver’s field of view. It is available in select models of Mazda 3, Mini Cooper Hatchback, and Ford Focus. The second solution projects driving information and graphics onto the front windscreen from a device embedded inside the console. This solution is available mostly in BMW cars. HUDs usually come with the Augmented Reality Lane Line (AR Lane Line) technology which enables car drivers to see a navigation path and other traffic information virtually overlaid on the road. By overlaying crucial information for the driver within their line of sight, augmented reality can improve safety. Instead of a driver needing to look down at the dashboard or to their phone to get driving data or information, the promise of augmented reality would have the information available on a heads-up display, the windshield, or projected on the road ahead in the driver's line of sight. In addition to helping with navigation and data from gauges, augmented reality can make the driver aware of hazards on the road or other emergency notifications (Marr, 2020).
Application of HUDs to Increase Road Safety
Studies have shown that humans will react quicker to a stimulus that appears within the 20° north-south of the vertical Meridian line and 60° east-west of the horizontal Meridian line. Any objects which come up outside of this range will require human eyes to move. AR extends the dimensionality of 2D objects with depth and perception and in that way creates a mixed world: a world between reality and virtuality, which change the way humans perceive both the reality and virtuality. Focused and divided attention is a psychological problem which has an influence on the drivers. When there are multiple sources of information (e.g., tool palettes, work areas, multiple windows), users must make choices about what to attend to and when. At times, users need to focus their attention exclusively on a single source. At other times, they may need to split their focus and attention between two or more sets of information. Trade-offs among these attentional requirements must be made based on the users’s task requirements.
Literature Review
A study by General Motors in 1988 showed a test driver, who was traveling at 70 mph, took 134 milliseconds by moving his eyes from the car dashboard back to the road during which time his car had traveled 13 ft further (about the length of a car). Many studies have confirmed that HUDs play a critical role in adding more time for drivers to have a long vision which will enable them to prepare and react to an unexpected event while on the road. This is true regardless of the driver’s age and driving experiences. A likelihood of an accident would double or more if the driver moves his/her eyes away from the road for just two seconds to send a text message or engage in a call, according to several reports from the U.S.
Given limited space for a HUD screen, prudent design is therefore needed to ensure the drivers would have only vital information shown on the screen and they should be able to adjust what to show. Thus, basic design principle should include functional lines, fonts type, colors, and simple control. Suitable HUD displays should be adjusted to the local conditions of different countries and/or cities.
In 2017, Volvo funded a study to design an optimal HUD for truck drivers which was once believed to be impossible due to the tight space in the dashboard console. The team created the largest display with a visibility seven times greater than that in a car and a projected image twice as large.
In 2000, a U.S. researcher team conducted a field test with cargo trucks in Minnesota, USA using the 5Hz DGPS-assisted HUD system. It was found the system can draw the superimposed images with errors of less than 0.5 degrees of visual sight angle while test vehicles were driven at various speeds along the test track. However, further studies were needed to reduce the errors due to transient effects which appeared during lane changes, adjust the heading angle estimate with a faster and more accurate DGPS receiver, making smaller field of view for safe vehicle guidance and the extent of information to be presented to the driver.
Research Methodology
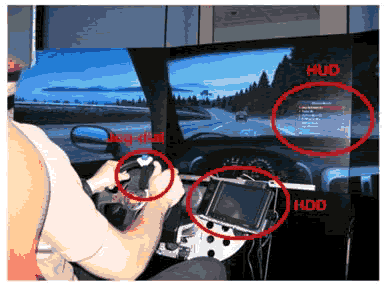
The study used a mix of literature (desktops) reviews, user experience interviews, and questionnaires coupled with an installation of a mock-up HUD device1 in a test pick-up truck to obtain test results (to be elaborated in the next section). Several variables were taken into consideration, including driving conditions, time of driving, display colors, line shapes, light, optimal display brightness for different driving time, restrictions on driving distractions (in some countries), and driver’s visibility use of sunglasses while driving.
To begin the study, an extensive volume of information about HUD technology (history, applications, displays design) was reviewed for an in-depth understanding of the technology, history, evolving trend, market size, and growing demands. Graphical interfaces of the AR Lane Line from different companies were also analyzed to understand their advantages and disadvantages. In addition, academic papers and case studies on the application of HUDs in commercial vehicles from various sources were assessed.
Various sources of information were used, including Hollywood’s sci-fi movies2, past and present HUDs in the market (2018-2021), award-winning HUDs (CES innovation award product 2021 Vehicle Intelligence & Transportation) and available HUDs in Thailand for which the experimental design, colors, opacity, and warning types were extracted as key elements for the experimental HUD of this study.
Following literature reviews, the researchers conducted two tests with targeted sampling groups. The first test, undertaken with three drivers of cargo trucks to investigate the user experience with proposed AR Lane Line graphical interfaces. The drivers were requested to drive a test vehicle (4x4 pick-up truck) with an installed HUD device projecting graphical images onto a 7x15 cm glass panel which was mounted above the driver’s dashboard. They were interviewed for their preferences on the shapes, color shades, and opacity of the AR lane line graphics as well as the composition of objects and information, such as driving speed, upcoming traffic signs, on the screen. Conducted by the Silpakorn University Team, the test aims to derive the most suitable AR lane line graphical interfaces design which is functional for both daytime and nighttime driving of the target drivers. In doing so, two sets of templates and four object compositions were used to make a total of eight design options for the drivers to select the best combination that would best fit their needs.
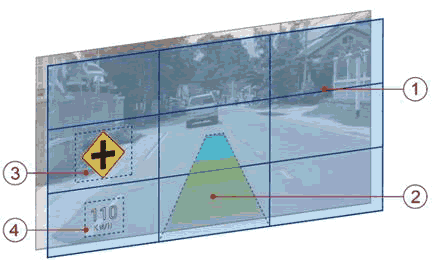
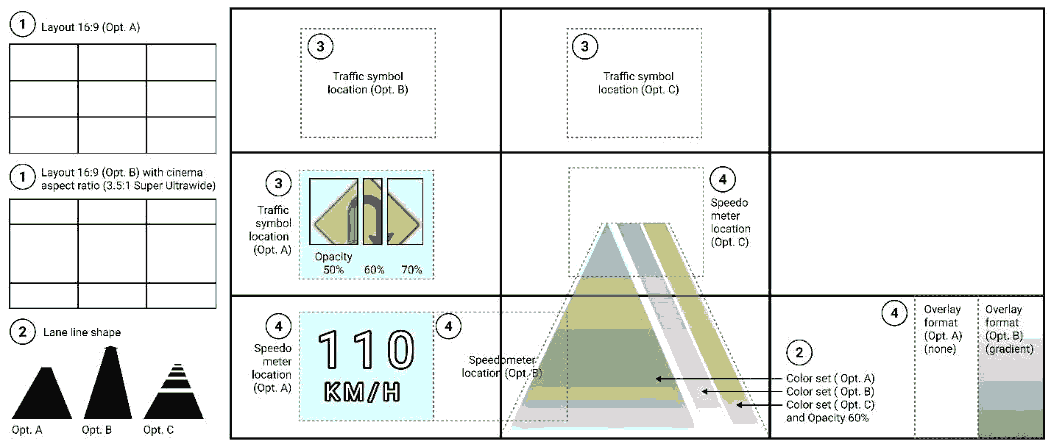
Based on results from the first test, a revised set of display options was generated along with a questionnaire and used to interview 20 design experts. Questions were grouped in three categories: (1) ratio and object composition; (2) navigation path (shape, colors, opacity); and (3) traffic signage (location, opacity). A scoring range (-1, 0, 1) was provided for the experts to assign to each question where 0 is for ‘Not decided’, 1 for ‘Agreed’ and -1 for ‘Disagreed’. Total scores for each question range from -1 to 1 with acceptable scores being 0.5 or above. The 'Rule of Third' theory and the standard aspect ratio for the high-definition video was used for the experts to determine a suitable ratio and objects composition of graphic displays (Category1). Two sets of colors, types, shapes, and opacity of the navigation path were provided for Category 2 for experts to select. Different color shades and gradients for different safe headways were also given in the selection options. (Category 3) the appropriate location and opacity of traffic signage on the display screen. Finally, the last group of questions (Category 4) deals with location and overlay format of speedometer.
| Table 1 Result from Design Expert (Part.1/2) |
|||||||||||
|---|---|---|---|---|---|---|---|---|---|---|---|
| Element | 1. Layout | 2. Lane Line | |||||||||
| Proportion and Placement | 2.1 Shape | 2.2 Set of Colors | 2.3 Opacity | ||||||||
| A | B | A | B | C | A | B | C | A | B | C | |
| Expert (Total) | 13 | 8 | 10 | 3 | 4 | 18 | -13 | -11 | 5 | 10 | 4 |
| Avg. | 0.65 | 0.4 | 0.5 | 0.15 | 0.2 | 0.9 | -0.65 | -0.55 | 0.25 | 0.5 | 0.2 |
| Table 2 Result From Design Expert (Part.2/2) |
|||||||||||
|---|---|---|---|---|---|---|---|---|---|---|---|
| Element | 3. Traffic Signage | 4. Speedometer | |||||||||
| 3.1 Location | 3.2 Opacity | 4.1 Location | 4.1 Overlay format | ||||||||
| A | B | C | A | B | C | A | B | C | A | B | |
| Expert (Total) | 10 | 5 | -1 | 3 | 10 | 2 | 11 | -1 | -6 | 11 | 4 |
| Avg. | 0.5 | 0.25 | -0.05 | 0.15 | 0.5 | 0.1 | 0.55 | -0.05 | -0.3 | 0.55 | 0.2 |
Figure 4: All Elements of A Graphical User Interface As Recommended By The Graphic Designer’s Group: (1) Rule of Third Theory, (2) Shapes, Set of Colors and Opacity, (3) Traffic Signage (Location and Opacity) And (4) Speedometer (Location and Background Format)
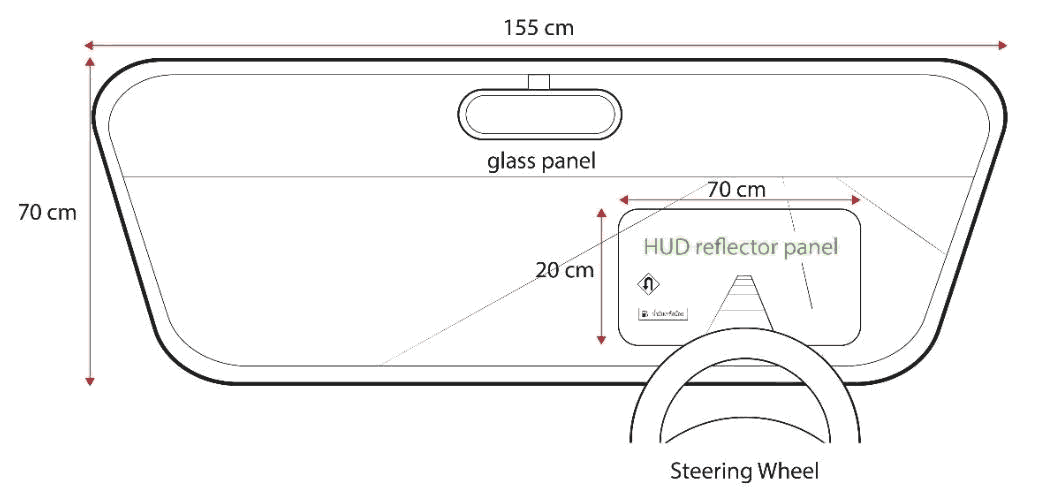
The results from these design tests will be used to develop a prototype HUD using the chosen AR Lane Line interfaces (see detail in the next section) from the two tests and fitted in the test vehicles with a 70x20 cm glass panel above the dashboard. These further tests will be conducted by the King Mongkut’s University of Technology Thonburi (KMUTT) team in the next phase.
Results
As mentioned in the previous section, experimental design, colors, opacity, and warning types are key elements that will determine the functionality and effectiveness of a HUD. These elements are discussed in detail as follows.
Experimental Design
Based on the researchers’ analysis, truck drivers and common car users tend to have different preferences on the type of information to be shown on the HUD. Table 1 shows 24 factors grouped in three categorizations—Urgency, General Driver Information (GDI), and In-Vehicle Information System (IVIS). Each one of them has different preferred prioritized information. Each factor refers to icons or pictorial shapes used in various regions, including North America, Europe, and Asia.
| Table 3 The Researchers’ Analysis Type of Information to Be Shown on The Hud |
|||
|---|---|---|---|
| Categorizations of factors | |||
| No | Urgency | GDI (General Driver Information) | IVIS (In-Vehicle Information System |
| 1. | Low window washer fluid | Speedometer | Excessive speed status |
| 2. | Low feul level | Trip computer | Lane change help |
| 3. | Engine stall | Outside temperature | Road image at night or poor weather conditions |
| 4. | Oil pressure | Cruise control | External speed control |
| 5. | Anti-lock braking system (ABS) failure | Multimedia | Road hinders image |
| 6. | Low tire pressure | Phone | Navigator |
| 7. | Door is ajar | Buckle seatbelt reminder | Video of passengers |
| 8. | Malfunctioning light bulb | Which door is ajar | Status of driver |
| Note. From “Ergonomic Guidelines of Head-Up Display User Interface during Semi-Automated Driving Kibum,” by Park, K., & Im Y. (2020), MDPI Electronics 2020, 9(4), p. 4. | |||
Colors
Colors is one of the faster human visual perception elements, compared with other elements such as shapes. It improves recognizability of flight information, so the color-coding is an important encoding way in HUD visual information display. In aviation industry, it helps improve the pilot’s cognitive performance. Military pilots found that when using a color-coded symbol system, they can fire missiles faster, reducing the possibility of being attacked. Color shades also give people different emotional responses. For example, red color will typically give a feeling of excitement or nervousness while sky-blue color makes people feel calm and fresh, and green color creates an effect of harmony, self-discipline, and peaceful feeling. As a result, red/orange shaded colors are chosen for the warning mode whereas blue/green shaded ones are for the safety mode in this experimental study.
Opacity
In HUD application, opacity of an object creates different effects on the driver’s attention and his/her reaction against the signs and/or color codes. Opacity works as the opposite to transparency (i.e., 20% opacity means 80% transparency). The more opaque an object is, the more attention it will get from the drivers. For example, a solid-colored stop sign (100% opacity) appeared on an HUD interface will prompt the driver to put a brake on the car immediately while the same sign with less opacity (50%, 25%) will give the driver more time to prepare to come to a complete stop. In this study, the opacity between 50-70% is chosen as the optimal range taking into consideration a good visibility for the drivers. The 40% opacity was recommended for a medium-sized object display whereas the 30% opacity was given for smaller objects.
Traffic Signs
Two different kinds of traffic signs were used as warning symbols. The standard size of the stop warning sign (SW) in the HUD is 19x17 cm; the caution warning sign (CW) is 21x19 cm. These dimensions were scaled down proportionally to fit the 7x15 cm glass panel used in this study. The signs appeared about 2.5 section before the critical event occurred. In this study, there were two experimental conditions, the SW and CW, as well as a control condition receiving no warning at all. It was expected that these two different warning signs would lead to different driver’s reactions.
Meanwhile, the final option was preferred by the graphic designers’ group. This option proposes a trapezoid-shaped (non-arrowhead) navigation path with light green-blue shaded colors for safe distances and red-shaded colors for danger distances with 60% opacity. Traffic signs are placed at the middle right side of the screen with 60% opacity. The speedometer is at the bottom left with no black gradation from below. This group recommended the 16:9 standard aspect ratio be used for the interface. The experts also suggested use of different color shades ranging from light blue to light green, yellow, orange, and red—for different safe distances (i.e., light blue is the safest distance and red is the danger distance). Both groups recommended against using white color on the screen as it is too difficult to see under real-life driving conditions. Finally, the location of the speedometer is at the bottom left and there is no black gradation from below. I believe that Design Expert doesn't need a black shade from below because it does not affect the performance of seeing.
It is determined in the next phase, a glass panel (70x20 cm in size) should be mounted on the test vehicle’s dashboard to further test the functionality and effectiveness of this technology in real-life driving conditions (see Figure 10). Testing users also suggested a feature where the drivers can adjust the opacity of the navigation path.
Conclusion and Discussion
The study concludes that colors, shades, opacity, and object composition on a HUD/AR Lane Line interface as well as the size of a display panel all have the influence on how HUDs would function and be utilized effectively by commercial vehicle drivers. These variables also play an important role on how a well-designed HUD can help improve driving conditions. While not having driven on a vehicle with a HUD installed before, all test drivers did not express an objection to the technology although they noted the mock-up display panel was too small and preferred a larger display panel for the ease of use.
Certain limitations in this study are noted. While the test with truck drivers was done to gauge their receptivity of the HUD/AR system and collect their initial feedback on the colors, shades, composition, and opacity, the second test with the graphic designers was conducted using the computer-generated monitor screen-based prototype based on the feedback from the truck drivers. No actual road driving, which will be carried out in the next phase, was performed with the second group. Some factors must also be further addressed, including the appropriate font size and graphics against a 70x20 cm panel and adjustable display brightness and opacity of graphics. Further testing must also consider the auto film’s thickness on the vehicle and how it might affect the opacity of the AR Lane Line graphics as chosen by the two test groups. In addition, research results recommended the 2D graphical interface, as opposed to 3D, be used for the commercial version of HUD for commercial vehicles to ensure price competitiveness and wider adoption by target commercial vehicles.
Acknowledgement
Supaporn Nhookan,Faculty of Information and Communication Technology, Silpakorn University,Phetchaburi,Thailand is the corresponding author. Her email address is nhookan_s@su. ac.th
Endnotes
- The test device used a small, transparent 7x15 cm acrylic panel mounted above the console to receive reflected images from a HUD device.
- Captain America and Iron Man.
References
Cappiello, C., Matera, M., & Picozzi, M. (2015). A UI-Centric approach for the end-user development of multidevice mashups. ACM Journals, 9(3), 16-18.
Donath, M., Shankwitz, C., & Lim, H. (2000), A GPS-Based Head Up Display for Driving Under Low Visibility Conditions, Minnesota Department of Transportation Office of Research Services.
World Health Organization. (2018). Global status report on road safety 2018. Geneva:. Licence: CC BYNC-SA 3.0 IGO.
Harrison, B.L., Gordon, K., & Vicente, K.J. (1995), An experimental evaluation of transparent user interface tools and information content, Proceedings of User Interface Software and Technology'95, Pittsburgh, PA. 81–90. ACM digital library.
Kazazi, J., Winkler, S., & Vollrath, M. (2015), Towards developing a head-up display warning system -How to support older drivers in urban areas?, Conference: Human Factors and Ergonomics Society Europe Chapter Annual Conference At: Groningen, Netherlands,
Lee, J., Yanusik, I., Choi, Y., Kang, B., Hwang, C., Park, J., …& Hong, S. (2020). Automotive augmented reality 3D head-up display based on light-field rendering with eye-tracking. Optica Publishing Group, 28(20).
Ling, B., Bo, L., Bingzheng, S., Lingcun, Q., Chengqi, X., & Yafeng, N. (2018). A cognitive study of multicolour coding for the Head-up Display (HUD) of fighter aircraft in multiple flight environments. Journal of Physics: Conference Series, 3-9.
Marín, E., Gómez, M., Gonzalez Prieto, P., & Villegas, D. (2016). Head-up displays in driving, Project: Intelligent Transportation Systems. 3–5.
Marr, B. (n.d.). Are you ready for augmented reality in your car?.
Park, K., & Im Y. (2020). Ergonomic guidelines of head-up display user interface during semi-automated driving, MDPI Electronics 2020, 9(4), 611.
Pauzie, A. (2015). Head up display in automotive: A new reality for the driver, International Conference of Design, User Experience, and Usability, 5(132), 6-8.
Plavsic, M., Bubb, H., Duschl, M., Tönnis, M., & Klinker, G. (2009). Ergonomic design and evaluation of augmented reality based cautionary warnings for driving assistance in urban environments. Intl Ergonomics Assoc. 1-3.
Sukruay, J. (2020). Road accidents biggest health crisis. The Thailand Development Research Institute (TDRI), Phillip, T. (2011). Information design solutions for automotive displays: focus on HUD [Master’s thesis]. University of technology department of innovation & design division of industrial design.
Weinberg, G., Harsham, B., & Medenica, Z. (2011). Investigating HUDs or the presentation of choice lists in car navigation Systems, Mitsubishi electric research laboratories. 3-5.
Weinberg, G., Harsham, B., & Medenica, Z. (2011). Evaluating the Usability of a Head-Up Display for Selection from Choice Lists in Cars, Mitsubishi electric research laboratories, 7-8.
World Health Organization, (2021). Road Traffic Injuries.
Received: 20-Dec-2021, Manuscript No. JMIDS-21-10020; Editor assigned: 23-Dec-2021; PreQC No. JMIDS-21-10020(PQ); Reviewed: 07-Jan-2022, QC No. JMIDS-21-10020; Revised: 14-Jan-2022, Manuscript No. JMIDS-21-10020(R); Published: 20-Jan-2022
