Research Article: 2019 Vol: 23 Issue: 4
Group-Affiliated Analysts and Future Stock Price Crash Risk: Evidence from Korea
Soo Yeon Park, Chung-Ang University
Younghyo Song, Korea University
Abstract
Based on the governance role of analysts and bad news hoarding theory of stock crash risk, this study examines the effect of group-affiliated analyst following on subsequent stock price crash risk using non-financial firms listed in the Korea Stock Exchange market, by focusing governance role of analysts as one of the main cause of the crash risk. In particular, we explore if subsequent stock price crash risk is affected when analysts are hired by a securities firm within a business group (chaebol) and the earnings forecast is for an affiliate of that business group. It is meaningful to investigate determinants of the crash risk which has significant influence on going concern and sustainable growth of the firm, specifically in emerging countries such as Korea. The regression results show that group-affiliated analysts help a firm lower its stock price crash risk by utilizing their sufficient source of internal information to effectively monitor managers and discourage them from hiding bad news.
Keywords
Analyst Following, Group-Affiliated Analysts, Large Business Group, Stock Price Crash Risk
Introduction
This study aims to examine the relationship between group affiliated analyst following and future stock price crash risk. We focus on investigating how financial analysts who serve as the information intermediary in the capital market also perform external corporate governance functions to provide effective monitoring of managers and, ultimately, how such role influences the capital market. Particularly, we explore if subsequen t stock price crash risk is affected when analysts are hired by a securities firm within a business group (chaebol) and the earnings forecast is for an affiliate of that business group using special research setting in Korea. Such focus was motivated by th e existing accounting academic research which suggested that analysts play critical roles on firm’s sustainability ( Yu, 2008; Chen et al., 2015), anecdotal evidence, and the bad news hoarding theory of stock price crash risk (Jin Myers 2006 ; Hutton et a l., 2009; Kim et al., 2011a).
When the accumulated negative information about the firm crosses a certain threshold, the excessive negative information would unexpectedly penetrate the capital market as bad news, causing a stock price crash (Hutton et al. 2009). This sudden stock price crash can cause significant losses to investors who make reasonable investment decisions based on accessible corporate information. Hence, investors, regulators, and policy makers have shown an increasing interest in the det erminants of stock price crash risk, and in fact, many studies have explored them on several levels (Jin Myers 2006; Hutton et al. 2009; Kim et al. 2011a; Hamm et al., 2013; Xu et al. 2013; Jo, Moon Choi 2015; Kim Zhang 2016). In addition, anec dotal evidence of managerial bad news hoarding in listed firms is available. A case in point is Enron, a company that concealed the possession of money losing assets for quite some time using special purpose vehicles before it went bankrupt due to unsustai nable losses arising from the assets (Powers et al., 2002). In line with this view, it is important to analyze the factors of stock price crash risk which would have substantial impact on doubt on going concern. However, most of these previous studies prim arily focused on specific factors at the firm or industry level, and only a few considered external factors as the determinants. Therefore, we focus on the role of analysts, especially group affiliated analysts, on corporate sustainability as one of the ma in causes of the crash risks.
In a separate strand of the literature, Yu (2008) concluded that in the case of the US capital market, the more analyst coverage, the less earnings manipulation by managers. In Yu’s (2008) study, he explained that the analysts track their company’s financial statements on a regular basis by using their financial expertise and substantial industry background knowledge and raise questions on company’s earnings numbers. In this way, they conduct external corporate governance roles to monitor managers in an effective manner. In another study by Chen et al. (2015), they stated that when analyst coverage increases in a firm, the firm’s shareholders expand cash holdings and its CEO receives less compensation, thus eventually lowering a gency problems within the firm. On the basis of these previous findings, we aim to confirm whether the existence of analysts and their forecast activity contribute to lowering stock price crash risk, assuming they play a role in external corporate governan ce that effectively prevents management from hiding bad news. In general, analysts in South Korea are known to have limited roles compared with others in advanced foreign capital markets such as the US market. Although certain criticisms exist about the ro le of analysts, we see the evidence that they play a positive role in monitoring managers.
The Korean capital market has a considerably unique form of an economic entity called large business group, which is also known as chaebol, such as Samsung, LG, and SK. On the influence of chaebol on Korea's capital market, there are conflicting views; some literature suggest that chaebol have been conducive to corporate development by carrying out efficient management activities based on ample funds (Shin Park 19 99; Khanna 2000; Khanna Yafeh , 2005) whereas others argue that they hinder the firm’s sustainable growth due to canonical adherence, circulating contribution, and agency problems arising from conflicts between major shareholders and minority shareholders (Johnson et al., 2000; Bertran d et al., 2002; Baek et al., 2006). In this context, it is meaningful to look at the impact of the role of group affiliated analysts, which are associated with chaebol among financial analysts, on crash risk, ultimately survival of firms and soundness of c apital markets. In fact, as of 2015, earnings forecast issued by analysts affiliated with certain business groups was reported to represent 40% of all forecast information. According to Chung et al. (2006), these business group affiliated analysts have mor e access to corporate information compared with non affiliated analysts because of certain economic relationships within their business group. If group affiliated analysts would monitor managers on the basis of such internal information, managers would be less likely to withhold bad news because they would know the analysts already have a sufficient amount of information to see what is going on within the firm. Thus, analyst coverage would reduce stock price crash risk by addressing the firm’s information o paqueness regarding bad news as long as analysts effectively perform the external corporate governance functions.
Meanwhile, other studies suggest earnings forecasts and recommendations issued by group affiliated analysts tend to be more positive and favor able than those by non affiliated analysts (Francis & Philbrick 1993; Dugar & Nathan 1995; Lin McNichols 1998). In the case of Korean business groups, each affiliate within a group is a separate legal entity, however economically, they are closely ass ociated in diverse aspects and thus act as a single economic entity. Therefore, for group affiliated analysts, conducting earnings forecast of a firm affiliated with the same business group is almost synonymous with conducting an internal forecast. Under s uch circumstances, group affiliated analysts tend to put a positive spin on earnings forecasts and recommendations for a firm within the same business group because of certain economic relatio nships within the group (Jeong et al., 2006). Given these confli cting views, it is reasonable to expect that group affiliated analysts would have either positive or negative consequences on firm’s future stock price crash risk. In other words, we expect that group affiliated analysts may have two competing reporting in centives: (1) group affiliated analysts would utilize their internal information to effectively monitor managers and provide more accurate earnings forecast, th ereby leading to a lower stock price crash risk; (2) group affiliated analysts may provide more optimistic earnings forecast and favorable opinions for an affiliate d companies , ultimately increase stock price crash risk. Although much literature on the issue of analyst coverage and stock price crash risk is available, only a few paid attentions to ho w group affiliated analysts would affect the possibility of a firm’s future stock price crash.
We conducted our empirical analysis by examining 6,355 firm year observations listed on KOSPI and KOSDAQ from 2000 to 2015 using two primary measures for future stock price crash risk following the prior l iterature (Chen et al., 2001; Hutton et al. 2009). Our analysis reveals a significant negative association between group affiliated analyst coverage and future stock price crash risk, implying that group affiliated analysts help a firm lower its stock price crash risk by utilizing their sufficient source of internal information to effectively monitor managers and discourage them from hiding bad news. We also find that the negative relationship between group affiliated analyst following and crash risk is more evident in the firms with lower managerial ownership. Furthermore, we find that the association between group affiliated analyst following and crash risk strengthened in the firms with a low level of information asymmetry. In addition, our empirical results are robust to Heckman’s (1979) two stage selection model.
This study contributes to the extant literature in many ways. First, to our knowledge, no study has been previously conducted to a ssess the association between group affiliated analyst following and subsequent stock price crash risk in Korea. Thus, we believe that our empirical results shed light on how group affiliated analysts following influences stock price crash risk. In this re spect, this study complements the previous studies with new evidence that a specific environment an aff iliation with a business group would affect analyst forecasts and, eventually, stock price crash risk. Second, this study extends the findings of Yu (200 8) and Chen et al. (2015) by presenting those group affiliated analysts conduct an effective governance role with their sufficient internal information. We provide that the understanding of potential external governance role of the group affiliated analyst s, which can be significant in mitigating bad news hoarding of managers, ultimately reduce the subsequent stock price crash risk. Third, we extend the previous research on the determinants of stock price crash risk with an empirical finding that group affi liated analyst following contributes to lowering stock price crash risk. Specifically, our study is different from previous studies because none of them examined the effect of group affiliated analysts following, which is one of the external corporate gove rnance factors on stock price crash risk. Thus, this paper complements the evidence of previous Korean research on stock price crash risk.
The remainder of this paper is organized as follows. The literature review and hypotheses development section review s prior research and develops our hypotheses, and the Research Model section provides the sample and research models. Moreover, the empirical analyses section shows the results of our empirical analyses, whereas the additional analyses section provides the results of our collaborating analyses and several robustness tests. finally, the conclusion is presented.
Literature Review and Hypothesis Development
Stock Price Crash Risk
Firm specific stock price crash refers to an event in which stock prices descend rapidly because of the sudden release of excessive negative information when bad news accumulates within companies and reaches a certain threshold (Jin Myers 2006; Hutton e t al. 2009). The determinants of stock price crash risk have been identified as internal and external factors.
Some previous studies have found stock price crash determinants inside companies. Kim et al. (2011b) showed that tax avoidance, which provides managers with a means to conceal negative information, increases stock price crash. Kim Zhang (2016) presented the relationship between conditional conservatism and firm level stock price crash. Their results showed that stock price crash risk decreases as the degree of conservative accounting policies increases, and this relationship is stronger in an environment with large information asymmetry as measured by R&D costs, industrial competitiveness, and financial analysts’ numbers. Hutton et al. (2009) st udied the effect of the quality of financial statements on crash risk by using discretionary accruals as a proxy for corporate opacity; their empirical result documented that firms with more opaque financial reporting are more prone to have a higher risk o f stock price crash. Hamm et al. (2013) showed a positive relationship between earnings guidance and stock price crash risk, which suggests that earnings guidance, is more opportunistic rather than informative. Other studies especially focus on managerial characteristics as internal determinants of stock price crash risk. Kim et al. (2016) examined that overconfident CEOs are more likely to experience stock price crashes, indicating their tendency to overestimate future cash flow from a project, misinterpre t investments with negative net present value as incremental investments, and ign ore negative feedback. Andreou et al. (2017) explored the relationship between CEO’s age and stock price crash risks and showed that firms with younger CEOs are more likely to be associated with stock price crashes. This finding implies that CEOs have incentives to hoard bad news earlier in their career, ultimately increasing the crash risk. Park Jung (2017) reported the negative association between the CEO’s ability and cras h risks, indicating that the managers with higher ability release more voluntary disclosure, thereby ultimately lowering the future crash risk.
Some researchers have focused on the external monitoring of institutional investor and financial analysts as an external governance mechanism that can have an impact on crash risks. Callen & Fang (2013) presented evidence that institutional investor stability is negatively associated with subsequent stock price crash risk, implying that institutional investors play monitoring and supervising roles. Xu et al. (2013), using the Chinese database as an emerging market, showed that the larger the firm’s analyst coverage, the higher the crash risk. As financial analysts in the emerging markets provide more optimistic earn ings forecasts and general market information, insufficient firm specific information can lead to an increase in price crash.
To the best of our knowledge, no studies have been conducted yet that directly focus on the impact of group affiliated analysts o n stock price crash risk as a governance mechanism. Therefore, this study focuses on the role of group affiliated analyst as a determinant that influences stock price crash risk.
Group-affiliated Analysts
Financial analysts serve as the information interme diaries between firms and investors by collecting firms’ corporate information, analyzing it with diverse methodologies, and providing timely and accurate analysis results to investors. At the same time, analysts play a monitoring role within a firm (Healy Palepu 2001; Yu 2008; Chen et al. 2015). According to previous studies, analysts generally have superior ability to forecast future earnings (Brown Rozeff 1978), and investors tend to make investment decisions based on the information provided by the financial analysts (Stickel 1995; Barber et al. 2001). Given that analysts help reduce the firms’ capital cost by addressing information asymmetry; researche rs have actively discussed the factors that contribute to the improvement of analysts’ forecast accuracy. Many studies investigate the association between forecast accuracy and analyst affiliation, and the empirical results are mixed. Furthermore, some stu dies explain that when analysts have a certain affiliation with their research targets, they are likely to issue optimistic forecast and investment recommendations. On the contrary, others suggest that the accuracy of analysts’ forecast and recommendations may improve because they are motivated to maintain their professional reputation and compensation by issuing accurate corporate information. Although analysts can be affiliated with a firm in diverse ways, it is important to pay attention to a specific fo rm of affiliation, which is the affiliation with a business group. In South Korea, a unique form of the business group is called Chaebol. What makes Chaebol different from business groups in other countries is that financial subsidiaries, such as securitie s and insurance firms, may be owned within the group, and the parent of such subsidiaries does not have to be a financial company. Considering that the Monopoly Regulation and Fair Trade Act provides the definition of a business group as a group of compani es whose economic interests are substantially connected, we may reasonably conclude that business group affiliated analysts are subject to an economic motivation when they analyze the group’s affiliates, particularly when analysts are employed by a securit ies firm in a business group and they issue forecast for an affiliate of their employer. A good example is the analysts from Samsung Securities providing earnings forecast and investment advice on Samsung Electronics. According to some researchers, these g roup affiliated analysts may issue more accurate forecasts compared with non affiliated independent analysts because they have easier access to internal information of their research targets (Dugar Nathan 1995; Cowen et al., 2006; Jacob et al., 2008). M eanwhile, the accuracy of analysts’ forecast has been found to depend on many factors, including analysts’ experience, ability, and task complexity concerns and the environmental factors associated with their securitie s firm (Mikhail et al., 1997; Clement, 1999; Jacob et al., 1999). For example, analysts from large securities firms are more likely to issue accurate earnings forecast because competent analysts are concentrated in large securities firms that have sufficient resources to conduct an analysis co mpared with small and medium sized securities firms. Kwak & Mo (2019) suggest that group affiliated analysts issue more accurate and less optimistic earnings forecasts for the affiliated firms when the level of information asymmetry is low. By contrast, th e group affiliated analysts may issue more optimistic earnings forecast because of certain interests inherent within a business group. Lim Jung (2012) and Song et al. (2012) indicate that group affiliated analysts are more likely to issue optimistic earn ings forecasts and positive investment recommendations for a firm within their business group than the non affiliated ones.
Prior research extensively focuses on the benefits of analysts, however, only a few studies focus on the direct association between analyst affiliations and economic consequences for investors and the capital markets. As information intermediaries, analysts play important roles in monitoring the management (Yu 2008; Chen et al. 2015); however, it would be interesting to explore the group affiliated analysts’ influence on stock price crash risk with respect to their role in monitoring management’s reporting choices that might hoard bad news. In addition, given that financial analysts in emerging markets tend to provide more market wid e information than entity specific information (Chan Hameed 2006), it is suggested that research on the impact of analysts on stock price crash risk needs to be conducted in countries with different capital market characteristics.
Hypothesis Development
When making earnings forecast, analysts refer to all publicly available information and even internal information of research targets. For most investors, undisclosed internal information is only indirectly accessible through information intermediaries su ch as analysts (Healy Palepu 2001). In this respect, we can say that analysts play an important role as information intermediaries in the capital market. Meanwhile, managers and employees in the same business group may actively share internal informatio n about firms within the business group through group wide communication channels, internal media, and their close personal ties (Lim Jung 2012), and analysts hired by a securities firm of a business group may easily obtain internal information about th e group’s affiliates. In this exclusive environment, analysts can better understand the affiliated firms’ business practice and their overall business operation, identify each firm’s specific risks more effectively, and improve the accuracy of their earnin gs forecast. Considering that information intermediaries such as analysts and rating agencies help detect managers’ misconduct in certain firms in the course of analyzing their internal information (Healy Palepu 2001), business group affiliated analysts will enhance the quality of financial information by monitoring managers and constraining their earnings manipulation as long as they function well as information intermediaries and perform effective corporate governance functions (Yu 2008). This will ma ke managers hard to withhold bad news about their firms from the capital market; thus, we can deduce that firms’ future stock price crash risk is likely to be mitigated. In this case, group affiliated analysts following is negatively related to future stock price crash risk, as they effectively conduct the governance role and monitor the managers’ bad news hoarding behavior promptly. For this reason, we propose the following hypothesis:
H1a: Group-affiliated analysts following is negatively associated with subsequent stock price crash risk.
By contrast, several studies indicate that analysts who have certain interests in their research targets are likely to put a positive spin on their earnings forecast and stock recommendations. For instance, Francis & Philbrick (1993) explained that analysts tend to issue optimistic earnings forecast with the aim of maintaining good relations with managers of their research firms in order for them to have better access to internal information. Similarly, Dugar Nathan (1995) and Lin McNichols (1998) found that when analysts’ employer is associated with their research targets through an underwriting relationship, they are more inclined to issue favorable research reports than non affiliated analysts. To sum up, busines s group affiliated analysts have a tendency to issue positive earnings forecast and stock recommendations because of economic interests between firms within a business group (Lim & Jung 2012; Song et al. 2012). On the basis of these findings, we can assu me that if analysts continue to provide inaccurately biased information, outside information users are not likely to be notified of the bad news about the business group firms in a timely manner. Given that firms experience a stock price crash when accumul ated bad news crosses a certain tipping point and all the negative information is released into the market at once (Jin Myers 2006; Hutton et al. 2009), we may reasonably expect that group affiliated analyst following will lead to a stock price crash. Hence, we proposed the following hypothesis:
H1b: Group affiliated analysts following is positively associated with subsequent stock price crash risk.
Research Model
Sample and Data
The sample consists of companies covered by analysts and listed on KOSPI and KOSDAQ for periods between 2000 and 20151, and a total of 6,355 firm years were used. We collected the financial data from TS 2000 and KIS Value, whereas the data on stock return and analyst following were collected from DataGuidePro. We then identifie d the group affiliations by using the list of business groups distributed by the Korea Fair Trade Commission2 . Financial institutions, firms with the fiscal year ended other than December, and companies with missing data were excluded for consistency of th e sample. All continuous variables are winsorized at top and bottom one percentile of the pooled data to mitigate influential extreme observations and possible data error. Table 1 shows the sample distribution by year, industry. Panel A in Table 1 shows th e sample distribution and mean value of one year ahead stock crash risk measures NCSKEWt+1 and DUVOLt+1) by year. One year ahead stock price crash risk measures are highest in 2007, which reflects the financial crisis in 2008. Panel B in Table 1 present s the industry distribution of the sample. Most companies (61.64%) are in the manufacturing industry.
| Table 1 Sample Distribution by year and Industry | ||||
| Panel A. Sample distribution by year | ||||
| Year | Frequency | Percent (%) | NCSKEWt+1 | DUVOL t+1 |
| 2000 | 250 | 3.93 | -0.337 | -0.186 |
| 2001 | 274 | 4.31 | -0.381 | -0.197 |
| 2002 | 261 | 4.11 | -0.463 | -0.249 |
| 2003 | 243 | 3.82 | -0.405 | -0.2 |
| 2004 | 266 | 4.19 | -0.468 | -0.261 |
| 2005 | 361 | 5.68 | -0.293 | -0.16 |
| 2006 | 397 | 6.25 | -0.401 | -0.212 |
| 2007 | 432 | 6.8 | -0.113 | -0.071 |
| 2008 | 424 | 6.67 | -0.479 | -0.256 |
| 2009 | 495 | 7.79 | -0.445 | -0.24 |
| 2010 | 512 | 8.06 | -0.346 | -0.194 |
| 2011 | 398 | 6.26 | -0.215 | -0.132 |
| 2012 | 288 | 4.53 | -0.143 | -0.09 |
| 2013 | 482 | 7.58 | -0.255 | -0.146 |
| 2014 | 596 | 9.38 | -0.353 | -0.205 |
| 2015 | 676 | 10.64 | -0.323 | -0.169 |
| Total | 6,355 | 100 | -0.339 | -0.186 |
| Panel B. Sample distribution by industry | ||||
| Industry | Frequency | Percent (%) | ||
| Agriculture, forestry, and fishing | 22 | 0.35 | ||
| Manufacturing | 3917 | 61.64 | ||
| Electricity, gas, steam, and water supply | 77 | 1.21 | ||
| Sewage, waste management, and materials recovery | 9 | 0.14 | ||
| Construction | 282 | 4.44 | ||
| Wholesale and retail trade | 433 | 6.81 | ||
| Transportation | 138 | 2.17 | ||
| Accommodation and food service activities | 2 | 0.03 | ||
| Information and communication | 538 | 8.47 | ||
| Real estate activities | 805 | 12.67 | ||
| Professional, scientific, and technical activities | 55 | 0.87 | ||
| Public administration and defense; compulsory social security | 33 | 0.52 | ||
| Human health and social work activities | 44 | 0.69 | ||
| Total | 6,355 | 100 | ||
Measurement of Stock Price Crash Risk
This study examines the relationship between group affiliated analyst following and future stock price crash risk. To investigate this relationship, we used two primary measures of firm specific stock price crash risk for each firm year observation, following the previous studies (Chen et 2001; Hutton et al. 2 009): (1) the negative coefficient of skewness of firm specific daily returns (NCSKEW) and (2) the down to up volatility of firm specific daily returns (DUVOL)
Specifically, we first estimated the firm specific weekly returns using the following expanded market model regression (Hutton et al. 2009):

where ri,t is the return on stock i in week t, rm,t is the return on the KOSPI or KOSDAQ value weighted market index in week t, and r k,t is the return on the value weighted industry index based on two digit the Korean Standard Indust rial Classification codes. Lead and lag variables for the market index are included to allow for non synchronous trading (Dimson 1979). We defined the firm specific weekly return for firm i in week t (W i,t ) as the natural logarithm of 1 plus the residual return in Equation (1), that is, Wi,t ln[1+ εi,t]3.
Our first measure of firm specific stock price crash risk, NCSKEW, is computed as the negative of the third moment of firm specific weekly returns each sample year and divided by the standard deviation of firm specific weekly returns raised to the third power. Thus, for each firm i in year t, NCSKEW is computed as
 (2)
(2)
where Wi,t is firm specific weekly return as defined above and n is observation numbers of firm specific returns during the fiscal year t. A negative sign is placed in front of the third moment such that a larger value of NCSKEW signifies greater crash risk.
The second measure of firm specific crash risk is called the down to up volatility measure (DUVOL)
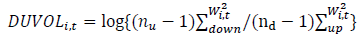 (3)
(3)
where nu and n d are the number of up and down weeks in year t, respectively. A higher value of DUVOL corresponds to a higher stock price crash risk. More specifically, for each firm i over a fiscal year period t, we separated all the weeks with firm specific weekly returns into t wo groups: when the returns are below (above) the annual mean, they are called ‘‘down’’ (‘‘up’’) weeks. We further computed the standard deviation for the two predefined groups separately. We then calculated the natural logarithm of the ratio of the standard deviation of the “down” weeks to the standard deviation in the ‘‘up’’ weeks.
Empirical Methodology and Variable Definitions
To test the effect of group aff iliated analyst following on future stock price crash risk, we estimated the following model (4):

where NCSKEW is the negative skewness of firm specific weekly returns, DUVOL is the log of the ratio of the standard deviations of down week to up week firm specific weekly returns, and GAGF is the number of group affiliated analyst following of company “i” (affiliate of that business group) in year “t”4 . Furthermore, SIZE is the logarithm of total assets value of a firm, and MB is the market value of equity divided by the book value of equity. ROA denotes return on assets to measure the firms’ performance, and TRADING denotes increment in monthly turnover rate year on year. MNRET and STDRET denote the arithmetic average and standard deviation of firm specific weekly returns, respectively. BETA represents the beta index of the market model during the previous 60 months, LEV is the firm leverage measures as the ratio of total liabilities to tot al asset, a nd OPAQUE denotes the 3 year moving sum of the absolute value of annual performance adjusted discretionary accruals BIG4 is the indicator variable for hiring Big 4 audit firms , and COVERAGE is the number of analyst following of company “i” in y ear “t” t”.
NCSKEWt+1 and DUVOLt+1 are used as a dependent variable CRASHt+1, and the number of group-affiliated analyst following (GAGFt) is applied as a main independent variable for testing hypothesis.
The following set of control variables are included in the model as they have been shown to affect subsequent stock price crash risk based on th e previous studies (Chen et al., 2001; Hutton et al. 2009; Callen and Fang , 2013, 2015 ): SIZEt MBt ROAt TRADINGt MNRETt STDRETt BETAt LEVt OPAQUEt BIG4t COVERAGEt NCSKEWt DUVOLt , Year Dummy, and Industry Dummy.
SIZEt , which was calculated by the logarithm of total assets value of a firm in year was included in the model to control for size effect because the size of companies has a significantly positive effect on stock price crash risk (Chen et al., 2001). The future prospect for growth has a positive relation with stock price crash risk (Kim et al., 2014); therefore, MBt was controlled in the model. Hutton et al. (2009) showed that operating performance is positively related to stock price crash risk; thus, the profitability measured by return on asset (ROAt) was included in the model. TRADINGt is a proxy for the disagreement among investor opinions, which is defined as the increment in monthly share turnover rate year on year in the fiscal year t. Higher TRADING values, which implies a larger difference in opinions amongst investors, have a positive effect on the risk of stock price crash (Chen, Che n and Cheng 2008) and was therefore included in the model. STDRETt and MNRETt are defined as the standard deviation and arithmetic average of firm-specific weekly returns in year t, respectively. A higher past mean return increases future stock price crash risk (Chen et al. 2001); therefore, MNRETt were controlled. To control systematic risk, BETAt was included in the model (Jo et al. 2015). Financial leverage has a positive effect on stock pric e crash risk (Kim et al. 2014); hence, LEVt was included in the model. OPAQUEt, the three year moving sum of the absolute value of discretionary accruals, can be used as a proxy for financial reporting opacity and was included in the model because of th e positive relation with stock price crash risk (Hutton et al. 2009). The companies hiring the Big 4 audit firms have a lower stock price crash risk (Jo et al. 2015), and BIG4t was thus controlled. Analyst following has a positive or negative effect on stock price crash risk (Xu et al., 2013; Bae et al., 2016); hence, COVERAGEt was included in our model. CRASHt was included because CRASHt has a positive relation with future CRASH measures (Kim et 2016). Lastly, year and industry indicators are in cluded to control for time and industry fixed effects.
Empirical Analyses
Descriptive Statistics
Table 2 shows the descriptive statistics of the variables used in our model. The mean (median) value of NCSKEWt+1 and DUVOLt+1, subsequent stock price crash risk measures, are −0.334 (−0.307) and −0.184 (−0.185), respectively. These values are similar to the mean (median) value found in the study of Bae et al. (2016) that used Korean firms’ data. The mean (median) value of GAGFt, the number of group-affiliated analyst following for a company within the same business group, is 0.053 (0.000). The mean (median) value of SIZEt, which is measured by the logarithm of total assets value of a firm, and the mean (median) value of MBt, which is the ratio of market value to book value, are 19.707 (19.392) and 1.478 (1.081), respectively. In the sample, the market value of equity is greater than the book value of equity. The mean (median) value of ROAt, which indicates return on assets, is 0.043(0.046). The mean (median) value of TRADINGt, which is the increment in monthly turnover rate year on year, is -0.001 (-0.000). The mean (median) value of MNRETt and STDRETt are −0.001 ( (−0.002) and 0.057 (0.054), respectively, which are similar to the estimates found in the study of Park and Jung (2017). The mean (median) value of LEVt , the ratio of total liabilities to total asset, is 0.414 (0.419). The mean (median) value of OPAQUEt , the sum of discretionary accruals over the previous 3 years, is 0.158 (0.131). The mean (median) value of BIG4 t, an indicator for hiring BIG4 audit firm, is 0.632 (1.000), which implies that 63.2% of the sample hires BIG4 audit firms. The mean (median) value of COVERAGEt, the number of analyst following, is 7.594 (4.000), which indicates about 7.6 analysts forecast earnings for a company, which is comparable with the value reported by Bae et al. (2016).
| Table 2 Descriptive Statistics of Main Variables | |||||||
| Variables | Mean | Std. Dev. | 25% | MED. | 75% | Min | Max |
| NCSKEWt+1 | -0.334 | 0.743 | -0.711 | -0.307 | 0.065 | -5.571 | 4.586 |
| DUVOLt+1 | -0.184 | 0.344 | -0.410 | -0.185 | 0.037 | -1.605 | 1.925 |
| GAGFt | 0.053 | 0.272 | 0 | 0 | 0 | 0 | 3.000 |
| SIZEt | 19.707 | 1.580 | 18.514 | 19.392 | 20.605 | 16.592 | 24.711 |
| MBt | 1.478 | 1.377 | 0.666 | 1.081 | 1.792 | -0.248 | 11.859 |
| ROAt | 0.043 | 0.125 | 0.015 | 0.046 | 0.083 | -3.478 | 3.364 |
| TRADINGt | -0.001 | 0.023 | -0.003 | -0.000 | 0.002 | -0.207 | 0.265 |
| MNRETt | -0.001 | 0.008 | -0.006 | -0.002 | 0.003 | -0.030 | 0.027 |
| STDRETt | 0.057 | 0.020 | 0.043 | 0.054 | 0.068 | 0.020 | 0.154 |
| BETAt | 0.909 | 0.411 | 0.629 | 0.907 | 1.190 | -0.148 | 2.019 |
| LEVt | 0.414 | 0.193 | 0.260 | 0.419 | 0.561 | 0.017 | 1.038 |
| OPAQUEt | 0.158 | 0.119 | 0.079 | 0.131 | 0.210 | 0 | 0.889 |
| BIG4t | 0.632 | 0.482 | 0 | 1.000 | 1.000 | 0 | 1.000 |
| COVERAGEt | 7.594 | 8.645 | 1.000 | 4.000 | 11.000 | 1.000 | 42.000 |
Table 3 reports the Pearson correlation coefficients for the variables that are used in our model. NCKEWt+1 and DUVOLt+1 are highly correlated with each other, and this result is similar to that of Chen et al. (2001). GAGFt and COVERAGEt have a significantly positive relation with NCKEWt+1 and DUVOL t+1, implying that the higher the group-affiliated analyst following or analyst following, the more likely the firm will experience subsequent stock price crash risk. Some correlations between variables are similar with the predicted signs based on the previous studies, but other correlations are not the same with the predicted ones. However, NCSKEWt+1 and DUVOLt+1 are reported to have a significant correlation with other controlled variables set in the empirical model; hence, drawing a definitive conclusion on the hypothesis is limited. Therefore, the results of the final empirical analysis are reported in the following section on the basis of the multivariate regression analysis.
| Table 3 Pearson Correlation Coefficients Between Variables Analyzed | |||||||
| NSKEWt+1 | DUVOLt+1 | GAGFt | SIZEt | MBt | ROAt | TRADINGt | |
| NSKEWt+1 | 1.000 | 0.949*** | 0.033*** | 0.165*** | 0.104*** | 0.038*** | 0.012 |
| DUVOLt+1 | 1.000 | 0.032** | 0.170*** | 0.106*** | 0.040*** | 0.015 | |
| GAGFt | 1.000 | 0.292*** | 0.043*** | 0.016 | 0.009 | ||
| SIZEt | 1.000 | -0.084** | 0.023* | 0.005 | |||
| MBt | 1.000 | 0.036*** | 0.049*** | ||||
| ROAt | 1.000 | -0.019 | |||||
| TRADINGt | 1.000 | ||||||
| MNRETt | |||||||
| STDRETt | |||||||
| BETAt | |||||||
| LEVt | |||||||
| OPAQUEt | |||||||
| BIG4t | |||||||
| COVERAGEt | |||||||
| MNRETt | STDRETt | BETAt | LEVt | OPAQUEt | BIG4t | COVERAGE t | |
| NSKEWt+1 | 0.060*** | -0.095*** | -0.008 | 0.020 | -0.048*** | 0.065*** | 0.158*** |
| DUVOLt+1 | 0.061*** | -0.106*** | -0.014 | 0.011 | -0.053*** | 0.070*** | 0.165*** |
| GAGFt | 0.004 | -0.091*** | 0.073*** | 0.060*** | -0.058*** | 0.126*** | 0.340*** |
| SIZEt | -0.009 | -0.334*** | 0.067*** | 0.289*** | -0.201*** | 0.354*** | 0.663*** |
| MBt | 0.225*** | 0.186*** | 0.193*** | -0.006 | 0.111*** | 0.044*** | 0.118*** |
| ROAt | 0.171*** | -0.143*** | -0.064*** | -0.261*** | -0.003 | 0.024* | 0.092*** |
| TRADINGt | 0.163*** | 0.100*** | -0.022* | 0.009 | -0.011 | 0.017 | -0.008 |
| MNRETt | 1.000 | 0.169*** | 0.286*** | 0.152*** | 0.181*** | -0.202*** | 0.010 |
| STDRETt | 1.000 | 0.003 | -0.007 | -0.013 | -0.012 | -0.218*** | |
| BETAt | 1.000 | 0.112*** | 0.166*** | 0.053*** | 0.124*** | ||
| LEVt | 1.000 | 0.021* | 0.029** | 0.063*** | |||
| OPAQUEt | 1.000 | -0.041*** | -0.086*** | ||||
| BIG4t | 1.000 | 0.250*** | |||||
| COVERAGEt | 1.000 | ||||||
Regression Analysis Results
Table 4 presents our multivariate analysis result on whether the subsequent stock price crash risk is impacted by the group-affiliated analyst following. The coefficient estimates on GAGFt in columns (1) and (2) are −0.069 and −0.037, which are significant at 10% and 5%, respectively. This result indicates that group-affiliated analysts effectively play the role of monitoring the managers’ reporting choices within the same business group and preventing the bad news hoarding with sufficient internal information, thereby ultimately reducing subsequent stock crash risk.
Table 4 Results of multivariate regression analysis of the effect of group-affiliated analysts (GAGFt) on stock price crash risk (NCSKEWt+1 and DUVOLt+1).  |
||
| Dep Var= | (1) NCSKEWt+1 Coefficient (t-statistics) | (2) DUVOLt+1 Coefficient (t-statistics) |
| Intercept | -0.663*** (-2.89) | -0.292*** (-2.76) |
| GAGFt | -0.069* (-1.94) | -0.037** (-2.26) |
| SIZEt | 0.033*** (3.30) | 0.016*** (3.43) |
| MBt | 0.048*** (6.00) | 0.022*** (6.06) |
| ROAt | -0.014 (-0.18) | -0.014 (-0.40) |
| TRADINGt | 0.294 (0.74) | 0.184 (1.00) |
| MNRETt | 6.420*** (4.89) | 3.387*** (5.58) |
| STDRETt | -2.088*** (-3.44) | -1.182*** (-4.24) |
| BETAt | -0.061** (-2.31) | -0.029** (-2.42) |
| LEVt | -0.015 (-0.27) | -0.023 (-0.88) |
| OPAQUEt | -0.053 (-0.64) | -0.023 (-0.62) |
| BIG4t | -0.009 (-0.41) | -0.004 (-0.39) |
| COVERAGEt | 0.009*** (5.33) | 0.004*** (5.45) |
| NSKEW(DUVOL)t | 0.049*** (3.44) | 0.056*** (4.18) |
| Year | Fixed | |
| Industry | Fixed | |
| Adjusted R2 | 0.070 | 0.081 |
| No. of samples | 6,355 | |
Turning to the control variables, we also find that coefficient on SIZEt, MBt, and MNRETt are significantly positive, which is consistent with the findings of Chen et al. (2001). The coefficients on BETAt , which represents a linear correlation between the stock returns and the market returns of the firm, and STDRETt , which denotes the overall volatility that does not separate the rise and fall of stock return, have significantly negative coefficients, similar to the findings of Lee Choi (2017); this finding is opposite to Chen et al. (2001)’s finding possibly because of the different sample market. COVERAGEt has a positive relation with future stock price crash risk, which is c onsistent with the findings of Xu et al. (2013). Analysts in emerging market tend to provide more market wide information than firm specific information (Chan Hameed 2006); thus, Xu et al. (2013) predicted and found that analyst coverage has a positive relation with stock price crash risk. Considering that Korea is still regarded as an emerging market, this positive relationship between COVERAGEt and CRASHt+1 could be considered plausible. NCSKEWt and DUVOLt have positive coefficients, indicating tha t price crash risk is generally persistent.
Additional Analysis
Effect of Internal Governance Mechanism on the Relationship between Group affiliated Analysts Following and Stock Price Crash Risk: Subsample Analysis by the Managerial Ownership
In Table 4, we provide evidence that group-affiliated analysts tend to play an external governance role effectively to monitor managers’ behavior as demonstrated in a reduced stock price crash risk. In this section, we specifically investigate the role of internal governance mechanism in the association between group-affiliated analysts and subsequent stock price crash risk by dividing the sample by the percentage of managerial ownership.
Some studies (e.g., Mak, 1991; Eng & Mak, 2003) showed a significant negative relationship between managerial ownership and the level of disclosure because of weaker pressure for disclosure. As managerial ownership increases to align the interests of shareholders and managers, there would be less agency problem between them (Jensen & Meckling, 1976), which reduces the need for supervising the management and ends up compromising the level of disclosure.
Sepasi et al. (2016) discovered that managerial ownership has a significant negative effect on disclosure quality. In this case, group-affiliated analysts are able to play an effective governance role by using more sufficient internal information in monitoring managers, preventing bad news hoarding of managers, and reducing stock price crash risk in the firm with higher managerial ownership. By contrast, another study (Nagar et al., 2003) presents that in cases where managers with higher ownership are more strongly motivated to maximize corporate values, they publicly disseminate their information to the market. In other words, there would be more room for group-affiliated analysts to conduct a governance role to monitor manager’s behavior in the firms with lower managerial ownership as bad news is more likely to be withheld in this situation. In line with this view, group-affiliated analysts are negatively related to future stock price crash risk when the firm has a lower percentage of managerial ownership.
We classify the sample firms into two subsamples on the basis of percentage of managerial ownership, namely the “Low” (below median) group and the “High” group (above median), and then re-run the regression model. As shown in columns (1) and (2) in Table 5, the coefficient of GAGFt is significantly negative for the firms with low managerial ownership (LOW), whereas the coefficient for firms with high managerial ownership (HIGH) is insignificant. This finding suggests that managers with lower ownership have incentives not to disclose their information to the market because of the high agency problem, and group-affiliated analysts might perform effective corporate governance function for companies with low managerial ownership, thereby ultimately reducing subsequent stock price crash risk.
| Table 5 Results of multivariate regression analysis of the effect of group-affiliated analysts (GAGFt) on stock price crash risk (high managerial ownership vs. Low managerial ownership). | ||||||
| High | Low | |||||
| Dep Var= | (1) NCSKEWt+1 Coefficient (t-statistics) |
(2) DUVOLt+1 Coefficient (t-statistics) |
(1) NCSKEWt+1 Coefficient (t-statistics) |
(2) DUVOLt+1 Coefficient (t-statistics) |
||
| Intercept | -0.861** (-2.43) | -0.391** (-2.41) | -0.501 (-1.50) | -0.210 (-1.36) | ||
| GAGFt | 0.001 (0.01) | 0.002 (0.03) | -0.070* (-1.73) | -0.039** (-2.10) | ||
| SIZEt | 0.055*** (3.55) | 0.027*** (3.77) | 0.019 (1.25) | 0.008 (1.23) | ||
| MBt | 0.046*** (3.95) | 0.019*** (3.65) | 0.047*** (4.09) | 0.024*** (4.47) | ||
| ROAt | 0.093 (0.81) | 0.047 (0.91) | -0.094 (-0.78) | -0.051 (-0.91) | ||
| TRADINGt | 0.364 (0.71) | 0.293 (1.26) | -0.057 (-0.08) | -0.059 (-0.19) | ||
| MNRETt | 6.154*** (3.34) | 3.320*** (3.91) | 7.051*** (3.58) | 3.482*** (3.83) | ||
| STDRETt | -1.373 (-1.54) | -0.846** (-2.08) | -3.140*** (-3.52) | -1.668*** (-4.08) | ||
| BETAt | -0.034 (-0.91) | -0.014 (-0.84) | -0.083** (-2.13) | -0.040** (-2.21) | ||
| LEVt | -0.058 (-0.74) | -0.036 (-1.01) | 0.056 (0.66) | 0.003 (0.07) | ||
| OPAQUEt | -0.059 (-0.52) | -0.023 (-0.45) | -0.059 (-0.46) | -0.024 (-0.41) | ||
| BIG4t | -0.002 (-0.07) | 0.001 (0.05) | -0.009 (-0.26) | -0.003 (-0.19) | ||
| COVERAGEt | 0.010*** (3.80) | 0.005*** (4.10) | 0.009*** (3.68) | 0.004*** (3.76) | ||
| NSKEW (DUVOL)t |
0.039* (1.90) | 0.039** (2.01) | 0.048** (2.35) | 0.061*** (3.16) | ||
| Year | Fixed | Fixed | ||||
| Industry | Fixed | Fixed | ||||
| Adjusted R2 | 0.068 | 0.079 | 0.065 | 0.079 | ||
| No. of samples | 3,069 | 3,060 | ||||
Subsample Analysis by the Level of Information Asymmetry
Kwak and Mo (2019) investigated whether the issuance of optimistic earnings forecasts by the affiliated analysts strategically occurred according to the level of information asymmetry. The result shows that the group-affiliated analysts issue more accurate and less optimistic earnings forecasts for the affiliated firms when the level of information asymmetry is low. Under the circumstance that the level of information asymmetry is low, the act of optimistic bias in an analysts’ forecasts would be easily detected by the investors. In this case, although group-affiliated analysts cannot conduct an information intermediary role, they would still be able to provide an effective governance role by monitoring the managers to enhance their quality of earnings forecast. Consequently, their reputation is maintained with more accurate forecasts, resulting in reduced subsequent crash risk. Therefore, we expect that the negative relationship between group-affiliated analysts following and future stock price crash risk is pronounced for the firm with low information asymmetry. By contrast, many studies have shown that the analysts reduce information asymmetry by providing public information to market participants (Yohn, 1998; Frankel & Li, 2004). Furthermore, Lobo, Song, and Stanford (2012) showed that analyst coverage is associated with a decrease in accrual quality and an increase in information asymmetry. This finding suggests that investors have a higher demand for financial analysts’ services when there is more information asymmetry. In line with this view, the group-affiliated analyst is able to play an effective role in reducing stock price crash risk with their sufficient internal information for the firms with high information asymmetry. To test these conjectures, we divide the sample firms into two subsamples on the basis of whether the firm’s level of information asymmetry proxied by stock return volatility is lower than the sample median. As shown in Table 6, the coefficient of GAGFt is significantly negative only for the firm with low information asymmetry (LOW). This result indicates that group-affiliated analysts provide effective governance function by monitoring the manager’s behavior and preventing the delay of bad news, thereby cutting the crash risk for the firms with low information asymmetry.
| Table 6 Results of Multivariate Regression Analysis of the Effect of Group-Affiliated Analysts (GAGFt) on Stock Price Crash Risk (High Information Asymmetry vs. Low Information Asymmetry). | ||||||
| High | Low | |||||
| Dep Var= | (1) NCSKEWt+1 Coefficient (t-statistics) |
(2) DUVOLt+1 Coefficient (t-statistics) |
(1) NCSKEWt+1 Coefficient (t-statistics) |
(2) DUVOLt+1 Coefficient (t-statistics) |
||
| Intercept | −0.169 (-0.52) | −0.053 (-0.35) | −1.336*** (-3.99) | −0.620*** (-3.97) | ||
| GAGFt | −0.041 (-0.66) | −0.023 (-0.82) | −0.073* (-1.66) | −0.038* (-1.86) | ||
| SIZEt | 0.017 (1.15) | 0.008 (1.21) | 0.056*** (3.90) | 0.026*** (3.86) | ||
| MBt | 0.039*** (3.80) | 0.017*** (3.68) | 0.070*** (5.08) | 0.034*** (5.30) | ||
| ROAt | −0.031 (-0.36) | −0.021 (-0.55) | 0.128 (0.57) | 0.051 (0.48) | ||
| TRADINGt | 0.510 (1.16) | 0.241 (1.21) | −1.082 (-0.98) | −0.265 (-0.51) | ||
| MNRETt | 5.588*** (3.35) | 3.023*** (3.96) | 8.371*** (3.72) | 4.619*** (4.39) | ||
| STDRETt | −2.463*** (-2.78) | −1.242*** (-3.11) | −0.688 (-0.44) | −0.325 (-0.45) | ||
| BETAt | −0.054 (-1.49) | −0.023 (-1.36) | −0.086* (-1.89) | −0.039* (-1.82) | ||
| LEVt | 0.060 (0.75) | 0.006 (0.17) | −0.109 (-1.31) | −0.055 (-1.41) | ||
| OPAQUEt | −0.048 (-0.44) | −0.015 (-0.31) | −0.091 (-0.69) | −0.048 (-0.79) | ||
| BIG4t | 0.005 (0.17) | −0.004 (0.32) | −0.026 (-0.83) | −0.015 (-1.06) | ||
| COVERAGEt | 0.011*** (4.14) | 0.005*** (4.46) | 0.006** (2.48) | 0.003** (2.41) | ||
| NSKEW(DUVOL)t | 0.053*** (2.78) | 0.061*** (3.30) | 0.035 (1.63) | 0.043** (2.21) | ||
| Year | Fixed | Fixed | ||||
| Industry | Fixed | Fixed | ||||
| Adjusted R2 | 0.058 | 0.067 | 0.078 | 0.086 | ||
| No. of samples | 3,175 | 3,180 | ||||
Exclusion of Confounding Effect of the 2008 Financial Crisis
Our sample includes the 2008 financial crisis, so there may be a confounding effect of the results. Hence, to exclude the confounding effect, we exclude the year 2008 samples and re-run our analysis5. As shown in columns (1) and (2) in Table 7, the coefficient on GAGFt is significantly negative, which is consistent with that of our main result in Table 4.
| Table 7 Results of Multivariate Regression Analysis of the Effect of Group-Affiliated Analysts (GAGF t) on Stock Price Crash Risk (Exclusion of the Year 2008). | ||
| Dep Var= | (1) NCSKEWt+1 Coefficient (t-statistics) |
(2) DUVOLt+1 Coefficient (t-statistics) |
| Intercept | −0.663*** (-2.75) | −0.296*** (-2.68) |
| GAGFt | −0.061* (-1.65) | −0.033* (-1.95) |
| SIZEt | 0.033*** (3.12) | 0.016*** (3.35) |
| MBt | 0.048*** (5.94) | 0.022*** (6.00) |
| ROAt | −0.002 (-0.02) | −0.009 (-0.25) |
| TRADINGt | 0.221 (0.53) | 0.148 (0.77) |
| MNRETt | 6.435*** (4.71) | 3.286*** (5.21) |
| STDRETt | −2.154*** (-3.40) | −1.194*** (-4.12) |
| BETAt | −0.062** (-2.29) | −0.031** (-2.47) |
| LEVt | −0.012 (-0.20) | −0.022 (-0.83) |
| OPAQUEt | −0.068 (-0.77) | −0.031 (-0.77) |
| BIG4 t | −0.012 (-0.50) | −0.005 (-0.50) |
| COVERAGEt | 0.009*** (5.08) | 0.004*** (5.11) |
| NSKEW(DUVOL)t | 0.046*** (3.10) | 0.055*** (3.92) |
| Year | Fixed | |
| Industry | Fixed | |
| Adjusted R2 | 0.067 | 0.078 |
| No. of samples | 5,931 | |
Endogeneity Consideration
One concern for our empirical analysis is reverse causality. We assume that the governance role of group-affiliated analysts influences crash risk. However, one may argue that group-affiliated analysts are less likely to cover the firm with high crash risk. In our regressions, in order to address the reverse causality issue, the independent variables are lagged by one year relative to the measures of stock price crash risk. We also control for lagged crash risk (NCSKEWt and DUVOLt) in the regression.
As an additional robustness check, we conduct the Heckman (1979) two-stage least squares (2SLS) regression analysis to mitigate potential endogeneity problem. In the first stage, we employed various variables that could affect analyst coverage following previous papers (Yu, 2008; Chun & Shin, 2018; Mo & Lee, 2019) and conducted the analysis. The first stage regression model is as follows.

where GAGF is the number of group affiliated analyst following of company “i” (affilia te of that business group) in year “t”. Furthermore, MV is the market value of a firm, and ROA denotes return on assets to measure the firms’ performance. GROWTH is the growth rate of assets and STDOCF denotes standard deviations of operating cash flow scaled by assets . FINANCING represents net cash proceeds from equity and debt financing scaled by total assets , INDMEANAC is the industry mean value of analyst coverage for firms in the same industry as company “i” in year “t” t”, and KOSPI200 is indicator va riable for KOSPI200 firms. In the second stage regression, the residuals from the first stage regression is included as independent variables of interest. The results of the first and second step regressions are illustrated in Table 8 The results show tha t the group affiliated analyst following are negatively and significantly associated with crash risk. The results corroborate that our empirical results are robust to endogeneity concerns.
| Table 8 Results of Multivariate Regression Analysis of the Effect of Group Affiliated Analysts (GAGF t) on Stock Price Crash Risk With Two-Stage Least Squares (2SLS) Regression | ||
|
Panel A. Regression result of first stage
|
||
| Dep Var= | GAGF Coefficient (t-statistics) |
|
| Intercept | -0.144 (-2.98) | |
| MVt | 0.023*** (2.83) | |
| ROAt | -0.000(-0.02) | |
| GROWTHt | 0.001 (0.10) | |
| STDOCFt | 0.149* (1.85) | |
| FINANCINGt | -0.014** (-2.30) | |
| INDMEANACt | 0.004 (1.26) | |
| KOSPI200t | 0.171*** (18.84) | |
| Year Industry |
Fixed Fixed |
|
| Adjusted R2 | 0.109 | |
| # of Samples | 6,355 | |
|
Panel B. Regression result of second stage
|
||
| Dep Var= | (1) NCSKEWt+1 Coefficient (t-statistics) |
(2) DUVOLt+1 Coefficient (t-statistics) |
| Intercept | -0.928*** (-3.39) | -0.416** (-3.30) |
| RES_GAGFt | -0.361** (-2.01) | -0.171** (-2.07) |
| SIZEt | 0.046*** (3.73) | 0.022*** (3.84) |
| MBt | 0.051*** (6.27) | 0.024*** (6.30) |
| ROAt | -0.011 (-0.14) | -0.013 (-0.36) |
| TRADINGt | 0.264 (0.66) | 0.166 (0.91) |
| MNRETt | 6.388*** (4.86) | 3.256*** (5.39) |
| STDRETt | -1.988*** (-3.27) | -1.139*** (-4.07) |
| BETAt | -0.066** (-2.51) | -0.032*** (-2.69) |
| LEVt | -0.029 (-0.52) | -0.032 (-1.21) |
| OPAQUEt | -0.052 (-0.63) | -0.024 (-0.64) |
| BIG4t | -0.007 (-0.34) | -0.003 (-0.31) |
| COVERAGEt | 0.009*** (5.20) | 0.004*** (5.37) |
| NSKEW(DUVOL)t | 0.049*** (3.46) | 0.025*** (3.86) |
| Year | Fixed | |
| Industry | Fixed | |
| Adjusted R2 | 0.069 | 0.080 |
| # of Samples | 6,355 | |


Conclusion
This study examines the relationship between group-affiliated analyst coverage and stock price crash risk by utilizing 6,355 observations of KOSPI and KOSDAQ listed firms over the period from 2000 to 2015. The Korean capital market has a unique form of fam ily run conglomerate economic entity called a business group, which is also known as chaebol. On the basis of the findings of Yu (2008) and Chen et al. (2015), this study explores how subsequent stock price crash risk is affected when analysts are hired by a securities firm within a business group known as group-affiliated analysts who have external corporate governance functions to monitor managers and prevent bad news hoarding behaviors. We find that there is a significantly negative relationship between group-affiliated analyst following and subsequent stock price crash. The result reveals that group-affiliated analysts with sufficient internal information effectively play the governance role over managers, thereby reducing one-year-ahead stock price crash risk. The results are robust with several additional tests.
Our study not only contributes to the group-affiliated analyst literature but also to the emerging stock price crash risk literature. Despite increasing attention to the issue of analyst coverage, there is remarkably little empirical research on how group-affiliated analysts would affect the possibility of a firm’s future stock price crash by conducting their governance role. We focus on the unique role of group-affiliated analyst following as one of the factors of crash risk enhancing the corporate sustainability and provide the evidence of the effect of large business group, that is, chaebol, on the stock price crash risk. This study clarifies the effectiveness of the group-affiliated analysts’ corporate governance role in monitoring management actions and the impact of group-affiliated analyst coverage on subsequent stock price crash risk in Korea’s stock market.
End Notes
1. Regulation Fair Disclosure (Reg. FD, hereafter), which was adopted in Nove mber 2002 in Korea, requires companies to disclose material private information to all market participants and prohibits selective disclosure of important information. To exclude the effect of Reg. FD on the activities of group affiliated analysts, we perf ormed the regression analysis using the sample from 2002 to 2015 and the results are qualitatively similar (untabulated).
2. According to the Korea Fair Trade Commission, a collection of companies that functions as one economic entity with a common source of control such as a single controlling shareholder, his/her relatives, or their affiliated companies owning more than 30% of the total equity value of the company is defined as a business group. In addition, companies with total assets of at least 5 trillion Korean Won (KRW) are designated as a large business group.
3. The residuals from Equation (1) is highly skewed; hence, the logarithm transformation is performed to obtain a more symmetric distribution (Hutton et al., 2009).
4. We performed the sensitivity test including the dummy variable for group affiliated analyst (GAGF_D) in model (4) and the results are consistent with the results using GAGF variable (untabulated).
5. Additionally, we separated our sample into two sub periods, for the fiscal years of 2002 2007 and 2009 2014, and replicate our analyses for the sub period; the regression analyses present similar results (untabulated).
References
- Andreou, P.C., Louca, C., & Petrou, A.P. (2017). CEO age and stock price crash risk. Review of Finance, 21(3), 1287-1325.
- Bae, J., Zhang, Q., & Goh, J. (2016). The direct and mediating effect of analyst following on stock price crash risk. Korean Accounting Information Review, 34(3), 215-248.
- Bae, K., Kang, J., & Kim, J. (2002). Tunneling or value added? Evidence from mergers by Korean business groups. The Journal of Finance, 57(6), 2695-2740.
- Baek, J., Kang, J., & Lee, I. (2006). Business groups and tunneling: Evidence from private securities offerings by Korean chaebols. The Journal of Finance, 61(5), 2415-2449.
- Baek, B.M., Lehavy, R., McNichols, M., & Trueman, B. (2001). Can investors profit from the prophets? Security analyst recommendations and stock returns. Journal of Finance, 56, 531-563.
- Bertrand, M., Mehta, P., & Mullainathan, S. (2002). Ferreting out tunneling: An application to Indian business groups. The Quarterly Journal of Economics, 117(1), 121-148.
- Brown, L.D., & Rozeff, M.S. (1978). The superiority of analyst forecasts as measures of expectations: Evidence from earnings. Journal of Finance, 33, 1-16.
- Callen, J.L., & Fang, X. (2013). Institutional investor stability and crash risk: Monitoring versus short-termism? Journal of Banking & Finance, 37(8), 3047-3063.
- Callen, J.L., & Fang, X. (2015). Short interest and stock price crash risk. Journal of Banking & Finance, 60, 181-194.
- Chan, L., & Hameed, A. (2006). Stock price synchronicity and analyst coverage in emerging markets. Journal of Finance and Economics, 80(1), 115-147.
- Chen, T., Harford, J., & Lin, C. (2015). Do analysts matter for governance? Evidence from natural experiments. Journal of Financial Economics, 115, 383-410.
- Chen, J., Hong, H., & Stein, J.C. (2001). Forecasting crashes: Trading volume, past returns, and conditional skewness in stock prices. Journal of Financial Economics, 61(3), 345-381.
- Chen, S., Chen, X., & Cheng, Q. (2008). Do family firms provide more or less voluntary disclosure? Journal of Accounting Research, 46(3), 499-536
- Chun, H., & Shin, S. (2018). Does analyst coverage enhance firms’ corporate social performance? Evidence from Korea. Sustainability 10, 2561
- Clement, M. (1999). Analyst forecast accuracy: Do ability, resources, and portfolio complexity matter? Journal of Accounting and Economics, 27, 285-303.
- Cowen, A., Groysberg, B., & Healy, P. (2006). Which types of analyst firms are more optimistic? Journal of Accounting and Economics, 41(1-2), 119-146.
- Dimson, E. (1979). Risk measurement when shares are subject to infrequent trading. Journal of Financial Economics, 7(2), 197-226.
- Dugar, A., & Nathan, S. (1995). The effect of investment banking relationships on financial analysts' earnings forecasts and investment recommendations. Contemporary Accounting Research, 12(1), 131-160.
- Eng, L., & Mak, Y. (2003). Corporate governance and voluntary disclosure. Journal of Accounting and Public Policy, 22, 325-345.
- Francis, J., & Philbrick, D. (1993). Analysts’ decisions as products of a multi-task environment. Journal of Accounting Research, 31(2), 216-230.
- Frankel, R., & Li, X. (2004). Characteristics of a firm's information environment and the information asymmetry between insiders and outsiders. Journal of Accounting and Economics, 229-259.
- Hamm, S.J.W., Li, E.X., & Ng, J. (2013). Management earnings guidance and stock price crash risk. Working Paper.
- Healy, P.M., & Palepu, K.G. (2001). Information asymmetry, corporate disclosure, and the capital markets: A review of the empirical disclosure literature. Journal of Accounting and Economics, 31, 405-440.
- Heckman, J.J. (1979). Sample selection bias as a specification error. Econometrica: Journal of the econometric society, 153-161.
- Hutton, A.P., Marcus, A.J., & Tehranian, H. (2009). Opaque financial reports, R2, and crash risk. Journal of Financial Economics, 94(1), 67-86.
- Jacob, J., Lys, T., & Neale, M. (1999). Expertise in forecasting performance of security analysts. Journal of Accounting and Economics, 28, 27-50.
- Jacob, J., Rock, S., & Weber, D.P. (2008). Do non-investment bank analysts make better earnings forecasts? Journal of Accounting, Auditing & Finance, 23(1), 23-61.
- Jensen M.C., & Meckling, W.H. (1976). Theory or the firm: Managerial behavior, agency costs, and ownership structure. Journal of Financial Economics, 3(4), 305-360.
- Jeong, S.W., Kim, J.B., & Lim, T.K. (2006). The association between analysts’ earnings forecasts and stock recommendations, and the business group affiliation of analysts and forecasted firms. Accounting and Auditing Research, 44, 27-55.
- Jin, L., & Myers, S.C. (2006). R2 around the world: New theory and new tests. Journal of Financial Economics, 79(2), 257-292.
- Jo, E., Moon, H., & Choi, Y. (2015). The effect of comparability on firm-level stock price crash risk. Korean Accounting Review, 40(4), 179-211.
- Johnson, S., La Porta, R., Lopez-de-Silanes, F., & Shleifer, A. (2000). Tunneling. American Economic Review, 90(2), 22-27.
- Khanna, T. (2000). Business groups and social welfare in emerging markets: Existing evidence and unanswered questions. European Economic Review, 44(4), 748-761.
- Khanna, T., & Yafeh, Y. (2005). Business groups and risk sharing around the world. The Journal of Business, 78(1), 301-340.
- Kim, J.B., Li, Y., & Zhang, L. (2011a). CFOs versus CEOs: Equity incentives and crashes. Journal of Financial Economics, 101(3), 713-730.
- Kim, J.B., Li, Y., & Zhang, L. (2011b). Corporate tax avoidance and stock price crash risk: Firm-level analysis. Journal of Financial Economics, 100(3), 639-662.
- Kim, J.B., Wang, Z., & Zhang, L. (2016). CEO overconfidence and stock price crash risk. Contemporary Accounting Research, 33(4), 1720-1749.
- Kim, J.B., & Zhang, L. (2016). Accounting conservatism and stock price crash risk: Firm?level evidence. Contemporary Accounting Research, 33(1), 412-441.
- Kim, Y., Li, H., & Li, S. (2014). Corporate social responsibility and stock price crash risk. Journal of Banking & Finance, 43, 1-13.
- Kwak, B., & Mo, K. (2019). Group-affiliated analysts’ strategic forecasts during a year: Evidence from Korea. Emerging Markets Finance & Trade, 55, 59-77.
- Lee, S.H., & Choi, S.U. (2017). The effect of accounting conservatism on future stock price crash risk the moderating effect of financial statements comparability and information asymmetry. Korea Business Review, 46(2), 561-594.
- Lobo, G., Song, M., & Stanford, M. (2012). Accruals quality and analyst coverage. Journal of Banking & Finance, 497-508.
- Lim, Y., & Jung, K. (2012). Conflict of interest or information sharing? Evidence from affiliated analyst performance in Korea. Contemporary Accounting Research, 29(2), 505-537.
- Lin, H.W., & McNichols, M.F. (1998). Underwriting relationships, analysts' earnings forecasts and investment recommendations. Journal of Accounting and Economics 25(1), 101-127.
- Mak, Y. (1991). Corporate characteristics and the voluntary disclosure of forecasts information: A study of New Zealand prospectuses. British Accounting Review, 23, 305-327.
- Mikhail, M., Walther, B., & Willis, R. (1997). Do security analysts improve their performance with experience? Journal of Accounting Research 35 (supplement), 131-166.
- Mo. K., & Lee, K.Y. (2019). Analyst following, group affiliation, and labor investment efficiency: Evidence from Korea. Sustainability, 11, 3152
- Nagar, V., Nanda, D., & Wysocki, P. (2003). Discretionary disclosure and stock-based incentives. Journal of Accounting and Economics, 34(1-3), 283-309.
- Park, S.Y., & Jung, H. (2017). The effect of managerial ability on future stock price crash risk: Evidence from Korea. Sustainability, 9, 2334.
- Powers, W.C., Troubh, R.S., & Winokur, H.S. (2002). Report of investigation by the special investigative committee of the board of directors of Enron Corp. Retrieved November 4, 2004.
- Sepasi, S., Kazempour, M., & Mansourlakoraj, R. (2016). Ownership structure and disclosure quality. Procedia Economics and Finance, 36, 108-112.
- Shin, H.H., & Park, Y.S. (1999). Financing constraints and internal capital markets: Evidence from Koreanchaebols’. Journal of Corporate Finance, 5(2), 169-191.
- Song, K.R., Mantecon, T., & Altintig, Z.A. (2012). Chaebol-affiliated analysts: Conflicts of interest and market responses. Journal of Banking & Finance 36(2), 584-596.
- Stickel, S.E. (1995). The anatomy of the performance of buy and sell recommendations. Financial Analysts Journal 51, 25-39.
- Xu, N., Jiang, X., Chan, K.C., & Yi, Z. (2013). Analyst coverage, optimism, and stock price crash risk: Evidence from China. Pacific-Basin Finance Journal, 25, 217-239.
- Yohn, T. (1998). Information asymmetry around earnings announcements. Review of Quantitative Finance and Accounting, 165-182.
- Yu, F. (2008). Analyst coverage and earnings management. Journal of Financial Economics, 88(2), 245-271.