Research Article: 2023 Vol: 27 Issue: 4S
Growing through M&A: Impact Analysis of Mergers and Acquisitions in the Technology Industry
Mayank Mathur, Academic Director, Indian School of Business, Hyderabad, Indian
Citation Information: Mathur, M. (2023). Growing through m&a: impact analysis of mergers and acquisitions in the technology industry. Academy of Accounting and Financial Studies Journal, 27(3), 1-21.
Abstract
This research aims to identify the trends in mergers and acquisitions and pinpoint the essential elements or driving forces behind a successful merger or acquisition. A few examples are competition with competitors, gaining market dominance, and maximizing return on investment. This empirical investigation into the short- and long-term financial benefits following mergers and acquisitions (M&As) in the technology sector. The research examines the post-M&A performance of businesses in the technology sector. The abnormal return, the discrepancy between a stock's anticipated and actual long- and short-term returns, is the variable used to evaluate performance. The results reveal exciting information about the elements causing the anomalous returns: high in the short run(Cumulative return) and low in the longer run ( buy and hold returns ).
Keywords
Impact Analysis, Investment, M&A, Technology, Industry.
Introduction
A merger is the integration of two or more companies to create newer market offerings, and the acquisition is the act of acquiring a company and running it under the same parent company. The abnormal return will be negative if the market average stock returns outperform the individual company returns, and the abnormal return will be positive if the individual stock returns are higher than the market average. The total of all abnormal returns in the near term during M&A is known as the cumulative abnormal return (CAR). CAR assesses the short-term impact of occurrences like acquisitions on stock prices. This long-term investment principle is the foundation of buy-and-hold abnormal returns (BHAR), which compute abnormal returns by subtracting the standard buy-and-hold return from the realized buy-and-hold return calculated over a longer time frame (Dranev et al., 2019). The research calculates BHAR to measure the long-term benefits of mergers and acquisitions and CAR to measure the short-term benefits (M&As). For estimating companies' post-M&A performance, similar studies most frequently use these two parameters. A long-term investment plan known as "buy-and-hold" involves purchasing stocks. The study emphasizes the expansion and development of the technology sector. Because there is such a largely untapped market for technology adoption, innovation, and automation, technology companies have unique growth possibilities (Dranev et al., 2019). A more precise meaning of technology includes a physical component of things like tools, techniques, and products and an informational component of administration, production, quality assurance, or labour (Kumar et al., 1999). The definition of technology used in the present study is taken from the one given above.
Organizations emphasizing the adoption of information technology have been the target of the data collection. The difficulties and barriers associated with horizontal and vertical development in trade and commerce are decreasing daily due to the quickening pace of technological advancement. The research verifies the model based on secondary data (such as financial ratios, related data, acquisition data, and stock price data) available to technology companies. By conducting an empirical analysis, the study establishes the value proposition. The model used in this research is built to calculate both short- and long-term performance returns in the technology sector. The two types of markets used in the research are developed and emerging. The empirical data was gathered from particular nations: M&A data from China and India for emerging nations and U.S., U.K., and Europe M&A data for developed nations.
Literature Review
There are published M&A literature covering various scenarios, domains, and businesses. In the global context, views on M&As are divided. According to research by Cockburn et al. (2001), the larger size of the companies aids in creating economies of scale that increase operational efficiency and market power that strengthens the companies' negotiating position with suppliers and customers. The operations strongly emphasize the managerial mentality, integration, and negotiation processes. The negotiations for a cross-border acquisition have a significant impact on the contract. According to Altunbas et al.(2008), cross-border mergers and acquisitions (CBMAs) in the European banking sector have shown a higher return on capital because of organizational fit. The research concludes that the similarities between the merged banks are responsible for the success of CBMAs. The leading cause of the improved performance for domestic M&A was also determined to be the partner bank's technological expenditure. An empirical model was developed by Ooghe et al. (2006) based on their hypothesis that purchasing one organization from another is still a standard strategic move. It is a contentious method of achieving business growth nonetheless. Private and public companies appear to have different levels of corporate control competition.
According to Da Silva Rosa et al. (2000), winning bids for specific targets produces favourable CARs for the bidders, but the CAR is unimportant for requests from the general public. Astha (2016) examined the financial results of different organizations that underwent mergers in the Indian industry. The study's findings show that after M&A, the financial performance of the companies significantly improved. It demonstrates how developing nations like India can benefit from the synergy in a comparable way to more developed nations. According to Chari & Chang (2009), cross-border acquisition is more profitable when the target business is in a less developed nation. It can be presumed that investors buying businesses in developing nations are more likely to favour domestic purchases, and the opposite is true for investors buying businesses in emerging nations.
There are some contrary views on M&As. Tarasofsky & Corvari (1991) provided the contrary results to earlier research during that timeframe, which differed from the M&A's older motivations. Their study showed that the profitability either remains unchanged or decreases after the acquisition. They used a model based on stock prices and estimated the profit distributed to shareholders. Humphry- Jenner et al. (2014) found that more significant acquisitions usually earn lower returns than small organizations in developed and more robust governance countries. They derived that large organizations could experience several disadvantages in weak governance markets. It could be because the large organizations' market powers and political connections can be a valued source of shareholders' wealth. Large size is believed to contribute to the primary source of value destruction and agency conflict in the well-governed economy. The concept here is known as the management entrenchment theory.
Aw & Chatterjee (2007) studied cross-border acquisitions, and the research showed that U.K.-based organizations acquiring significant acquisition targets resulted in negative CAR over the period examined. McCarthy & Aalbers (2016) suggested that technology M&As are generally hazardous. Investors reacted cautiously to technology companies' acquisitions in emerging countries like India and China, requiring an additional premium than developed markets. According to Ranft & Lord (2002), the knowledge-intensive and innovation-driven sectors depend on specialized skills and expertise and face some managerial problems that implementing a successful M&A strategy may solve. The Hubris hypothesis derived by Roll (1986) indicates that the acquirers are sometimes more optimistic about assessing future goals by their mistakes in making excellent choices because of the information asymmetry. The more prominent company managers are more arrogant as they can facilitate the company's growth. As per Brockman et al. (2014), large companies have more and more reliable political connections and market power to protect them from the government's rent-seeking, corruption, and expropriation in the M&A in a weak- governance environment, resulting in the shareholder's wealth. Ferrer (2012) defined the two major empirical indicators of the advantages of an M&A: the return on equity ratio and the return on assets ratio. The model suggested that most Mergers harm the organizations' financial performance. There is a significant negative relation with return on equity (ROE); the M&As provide an insignificant connection to the return on assets (ROA). Weber et al. (2009) derived some propositions that discussed the links among the three primary parameters: the M&A performance, the integration approaches, and the cultural differences.
A recent Zhao et al. (2018) survey examines the relationship between the acquirer organization size, announcement returns, and long-term performance. The study finds that acquirer size plays a significant adverse role in financial gains, implying that the acquirer size effect is present. Some studies have been done in the last two decades to minimize the gap. Fuller et al. (2002) hypothesized that the CAR obtained by the listed companies usually is far less than that received through private companies. Thus, acquiring publicly listed targets could destroy the organization's value. Antoniou (2008) proposed that investor optimism immediately causes positive earnings, but returns are reversed over time. The study examines how the number of paid merger premiums directly impacts both the long and short-term. No such result could show that the organization that pays more performs poorly compared to those that pay relatively low premiums in a few years following the M&A.
Prabhu et al. (2005) expressed that an organization should initially take part in internal information improvement before external connections for M&A. Paruchuri et al. (2006) determined that the efficiency of corporate researchers in a profitable organization is affected by the thought of acquisitions of any company, especially for technological organizations. Leger & Quach (2009) found out that the software product organizations' processes define the performance of firms that have undergone M&A recently. Their study showed that organizations ignore the technology-based characteristics of the product during the acquisitions.
Research Methodology
A few models of the organization's performance in M&A activities in the technology field have been used. While synergies are often mentioned as one of the main arguments for combining two organizations, the study found many more cases like distance, mode of payment, integration issues, and the estimates of abnormal returns. Whether the technology M&A adds value, whether they are sustainable in the short term or long term, and what are the financial parameters of the organizations these M&A depend on. Additionally, this study attempts to answer a few questions:
1. What is the post-merger and acquisition effect on the organization's performance?
2. Is there an impact of M&As on stakeholders' money based on the organization's stock price?
3. What is the effect of mergers and acquisitions on short-term and long-term returns?
The data used in the study is from the financial and statistical data collected from two sources. The sample includes M&A activities with completed, confirmed, announced, and pending status from January 2005 to December 2015. Standard Industrial Classification (SIC) are four-digit codes that categorize the industries they belong to based on their business activities. For the sampling data, the criteria for selection are that the M&A transactions have target companies in technology sectors according to the SIC code criteria, and the acquiring company must be a public company with shares listed on the stock exchange. The two M&A-specific databases also provide some characteristics of the target and acquiring firms, such as name, industry sector, or transaction history. The data is used to clarify how M&A investments impact respective organizations and the information technology sector. The following SIC codes from Table 1 below have been used for categorizing the organizations.
| Table 1 Standard Industrial Classification (Sic) Code And Description For The Technology Industry |
||
|---|---|---|
| SIC Code | Description of the Industry | Sub-category |
| 357 | Computer and office equipment | Hardware |
| 366 | Communications equipment | Hardware |
| 367 | Electronic components and accessories | Telecommunications |
| 369 | Equipment and supplies (batteries, disk, tape), electrical machinery. | Telecommunications |
| 7371 | Computer programs or systems software development, Software as a Service (SaaS) | Software |
| 7374 | Data Preparations and processing Services, Internet services | Software |
Source: Official website of SIC codes.
All other cases refer to unrelated M&As. The obtained dataset was screened and reduced by excluding deals from the sample if the target company does not relate directly to the technology sector. Transactions involving several acquiring companies were also removed from the sample due to the lack of information about the number of shares acquired by each company. The firms from developed and emerging countries have been picked up in the sample. The largest developed markets are considered: the USA, Canada, UK, and Europe, and emerging markets: China and India. In the United States, there are outliers in the sample with large transactions for the estimated period. Most acquiring organizations belong to or are related to the technology sector, and such companies invest in their technology development and prefer to expand by purchasing other technology firms. With access to the above three databases, takeovers were filtered to ensure that target companies can be considered 'technology' firms. Orbis's technology category covers various sub-categories, including the markets related to technology hardware, calculating and accounting machines, artificial intelligence, the internet, computer, and electronics.
IMAA returns the number of previous M&A transactions the acquirer has undertaken, which will be essential in testing one of the hypotheses. The sample initially included 385 public acquirers engaging in M&A transactions with announced, closed, effective, settled, or successful status in the USA, Canada, Europe, China, and India from 2005 to 2015. It is to ensure market data as this study uses one-year BHARs to measure the acquirer's performance in the largest developed and emerging markets. However, after removing observations with missing stock prices and returns data, this sample was reduced to 174 organizations engaging in transactions between 2005 and 2015. The target organizations are divided into the technology companies' three sub-categories – hardware, telecommunications, and Software. It is based on the SIC codes from Table 1. Of the 174 transactions, 51 organizations with the SIC codes 357 and 366 belong to the hardware category, 63 organizations with the SIC codes 367 and 369 belong to the telecommunications category, and 60 organizations with the SIC codes 7371 and 7374 belong to the Software and Internet category.
Most technology transactions occurred in North America (the U.S. and Canada). The U.K. and Europe had nearly 30% of the total deals, while China and India had roughly 10% each. 2006 and 2007 were the most active years in the sample, potentially due to a large amount of consolidation during that period (Guerrera et al., 2008).
Some relevant information and statistical data are also collected from online publications. The data points, like the rate of returns, have been derived from research papers of a similar research genre in the financial technology industry (Dranev et al., 2019). India- based companies' stock price to estimate the abnormal returns is collected from investment websites like indiainfoline.com and BSE and NSE websites. For other stock prices from other organizations, the event prices have been picked up from their respective index stock market websites.
Cumulative Abnormal Returns
Cumulative abnormal returns, or CAR, is a primary dependent variable estimated with the given data to validate the hypothesis. The event window is often taken a few days to evaluate CAR. A few days before and after the announcement day can be added to the event window, as it helps capture the market reaction to possible information leakages before the official deal announcement and the effects after the announcement. The following linear relationship between the return of any security and the return of the market portfolio:

t is the time index, i = 1, 2, ..., N stands for stocks,
Rit and Rmt are the returns on stocks i and the market portfolio, respectively, during period t,
β is the return on the market portfolio on day t,
εit is the error term for security i.
The prediction error (εit) is estimated to be an abnormal return (AR) and is then calculated from the following equation:

where ARit is the Abnormal Return for firm i on day t,Rit is the actual return for firm i on day t. Abnormal returns due to the acquisition announcement were determined by subtracting the expected share returns from the actual returns.
The event window is where stock prices of the sample are examined; this period must be shorter than the estimation window, which precedes it (MacKinlay, 1997). The estimation window is the benchmark model, the returns (Rit) are subtracted from those in the event window (Rit) to provide abnormal returns.

where ARit is the Abnormal Return for firm i on day t and Rit is the actual return for firm i on day t. the expected return must first be defined, and there are three standard models to measure the abnormal return. The constant mean return model assumes the mean return is constant over time, as derived by

The market-adjusted model assumes the expected return equals the return of an appropriate market index.

The market model assumes a stable, linear relation between the market return and the stock's return and will require Software to estimate this OLS regression.

The above three models from equations (4), (5), and (6) will be used and compared with each other in this study. An estimation event window of 41, 21, and 3 days will be employed to estimate the model parameters, except the market-adjusted model, which does not require an estimation period. It does not depend on the short range of the event window (MacKinlay, 1997). CARs for each firm can then be calculated by taking the sample CAR from, for example, period  . In this case, the CAR from t1 to t2 is given by equation (7). For instance, the period of 41 days event window would mean the calculations for CAR to be done for 20 days before and 20 days after the event. Abnormal returns are calculated by subtracting the expected share returns from the actual returns, as shown in equation (3). The daily abnormal returns are added over the event window to calculate the CAR for each firm throughout t.

CARi is the cumulative abnormal return for firm i over the event window ( t1 to t2). Based on the sample data used for the analysis, the mean value of the CAR is around 1.075% for the constant mean, 1.17% for the market models, and 1.942% for the market-adjusted model. The analysis here is based on various expected return models like a market model, constant mean returns model, and market-adjusted model used in event studies over the years. Brown & Warner (1980) describe the three models in their study. Since then, it has been used to estimate the returns in various scenarios and compare the three to see which suits the most in the given scenarios. These models of the return-generating process are also discussed earlier by (Brown & Warner, 1980). Comparing the summary statistics further in Table 2 shows how the variance exists in each model (Zhang et al., 2018).
| Table 2 Summary Statistics: Cars Across Risk Models |
|||
|---|---|---|---|
| Summary Statistics | Constant Mean Model | Market Model | Market-Adjusted |
| Observations | 174 | 174 | 174 |
| Mean | 0.01075 | 0.0117 | 0.01942 |
| Minimum | -0.00071 | 0.0014 | -0.001 |
| Maximum | 0.02788 | 0.0291 | 0.0376 |
| Standard Deviation | 0.01530 | 0.01151 | 0.01734 |
Source: own estimates from Orbis data 2005-2015.
Buy and Hold Abnormal Returns (BHARs)
BHAR (Buy and Hold Abnormal Returns) is another estimated variable for evaluating the long-term performance of mergers and acquisitions. It is based on the strategy for investment for buying and holding stocks for a long time. It is determined by finding the abnormal returns and deducting the normal BHAR from the realized BHAR. Mitchell & Stafford (2000) suggested using the BHAR approach to estimate long-term performance. Bessembinder & Zhang (2013) indicated that BHAR provided insight into the benefits or losses the investors get in the long term from the M&A. BHAR is based on the geometric mean and is defined as:

where  is the actual return on stock i for time t and
  is the expected return on stock i for time t. In estimating BHAR for many other industries, different event windows have been considered to collect information about stock prices for the event study procedure. MacKinlay (1997) recommended using short event windows for the event study in M&As since the long windows may be affected by various factors. Using a three-year BHAR to capture significant long-term effects is more appropriate. Previous research by Kohers & Kohers (2001) found that technology acquirers performed poorly over three years despite a positive initial return. However, the validity of these performance measures may be affected due to other significant events in the period under study. Thus, taking on a one-year event window for calculating BHAR is the most logical way to see unbiased trends (Dranev et al., 2019). The stock price for the 250 trading days post-M&A event window has been considered. The BHARs will use an estimation window of 365 calendar days or roughly 250 trade days. It is easier to estimate based on the month-on-month performance in long-term estimates of the returns. Thus, the event window used here is [1,12] based on months rather than days to calculate the BHAR.

The descriptive statistics for the cross-sectional mean one-year BHAR across all three risk models (constant mean, market, and market-adjusted) are given in Table 1. The mean BHAR is relatively high, at 12.91%. Skewness is present, as shown by the median value of 10.87% and the significantly higher standard deviation and variance statistics than the CAR statistics. It turns out to be expected for many BHARs to be over 100% because BHARs include the effect of compounding, and it can be common to observe an annual firm return over 100%. Based on the summary data provided in Table 3, it can be observed that there are extreme BHAR values of -132% and 243%. The summary indicates negative one-year BHARs as below.
| Table 3 Mean 1-Year Bhar Across All Risk Models |
|
|---|---|
| Mean 1-Year BHAR(1,12) in terms of months | |
| Mean | 0.1291 |
| Standard Error | 0.03276 |
| Median | 0.1087 |
| Standard Deviation | 0.76352 |
| Sample Variance | 0.48763 |
| Minimum | -1.3234 |
| Maximum | 2.43876 |
Source: own estimates from Orbis data 2005-2015
Due to the dataset having substantial data for emerging markets, the market model provides the most significant results. It compares the firm's returns to the market's instead of its mean return over the estimation window. As a result, the market model accounts for changes in the market index, which lowers the long-term return compared to the mean return model.
Hypothesis Development
The studies from the past indicate specific hypotheses to be derived. The two parameters define the M&A's overall performance or the acquisition in the short and long run. This study is presented below based on the detailed descriptions of the hypothesis development of CARs and BHARs in various scenarios and categories. Twenty-one days is a standard period taken here to see the effect of technology firms just before and after the acquisition announcement. A sample of 50 firms has been selected to arrive at the hypothesis.
Positive Cumulative Abnormal Returns
Technological mergers and acquisitions, especially cross-border acquisitions, create positive abnormal returns in the short term for the companies due to the technological benefits they can provide (Kohers & Kohers, 2000). It suggests that the expected benefits of these mergers do not materialize. Based on this hypothesis, investors react positively to the companies' intention to improve technological development, and the investors overreact to these announcements and expect the acquirer to increase their future growth potential dramatically. The study aims to identify whether the technology acquisition can stimulate investors to purchase the acquiring company stock in the short term. The average abnormal returns are the average of all the abnormal returns from the various organizations averaged over the total number.
Figure 1 is a line chart to display the short-term trend of the mean growth of average returns for the sample of 50 technology organizations in the event period of 21 days of stock price trends around the announcement dates. It means that for all 50 organizations, ten days before and ten days after the acquisition's announcement, the average abnormal returns on the stock price of the acquiring firm are plotted to see the short-term trends. The hypothesis could be derived based on the above trend showing that technology organizations typically have a growing trend of CARs for the short-term benefits of mergers and acquisitions. Looking at the data trend in Figure 1, for the technology organizations sample selected, the following hypothesis has been derived:

Figure 1: The Average Abnormal Return On The Window[-10,+10] Of The Event Of M&A Announcement.
H1: Technology M&A will positively affect the acquiring company's cumulative abnormal returns of the acquiring company in the short term.
Developed vs. Emerging Markets
Developed nations have more advanced economies, infrastructure, and higher living standards. Emerging economies have developing manufacturing bases with more rudimentary infrastructure; they may be components or natural resources suppliers to other more advanced manufacturing nations. The short-term effects of technology M&A have been studied in detail. Companies from developed markets like North America(the U.S. and Canada), the U.K., and Europe may have more technology resources and advanced infrastructure to apply the processes successfully compared to emerging countries like India and China. The acquirers from mature markets like North America and Europe adopt new technologies more effectively than firms from emerging markets like India and China.
Figure 2 shows a chart to display the short-term trend of the average returns of the organizations from the developed countries (North America, U.K., and Europe) along with the organizations from the emerging countries (India and China) for the sample of a total of 50 technology organizations in the event period of 21 days of stock price trends around the announcement date. The event window implies ten days before and ten days after the acquisition announcement. The average growth of the acquiring firm's stock price is plotted to observe the short-term trends in the two scenarios. Looking at Figure 2 above, the returns from the developed countries in the short term have been better than the returns from emerging countries. The following hypothesis has been derived:

Figure 2: The Average Returns On The Window [-10,10] Of The Event Of M&A Announcement For Developed vs. Emerging Countries.
H2: The acquiring companies' short-term returns of developed countries will perform better than those of emerging countries during technological companies' acquisition.
Cross Border vs. Domestic M&A
Domestic M&A involves two companies within the same country, and in contrast, cross-border mergers are made between companies from different countries. The sample technology organizations' average has been selected based on the data's acquisition type. Lusyana et al. (2016) compared the returns in domestic and cross-border M&As. They found that domestic acquisitions demonstrated significant positive abnormal returns and brought more value to the company buyers than cross-border transactions. The factors like cultural dependencies and knowledge and experience of the processes help the organizations in the acquisition process. However, acquiring companies from developed countries and acquiring companies from emerging countries have been taken as samples.
The average CAR around the event period of 21 days of stock price trends around the announcement date from the two categories of cross-border and domestic acquisitions has been shown in Figure 3 and Figure 4 for the acquisitions from the developed countries and emerging countries, respectively. The event window implies that ten days before and ten days after the acquisition announcement, the acquiring firm's stock price is plotted to observe the short-term trends in the two scenarios.

Figure 3: The Average Returns On The Window [-10,10] Of The Event Of M&A Announcement For Domestic And Cross Border M&A In Developed Countries.

Figure 4: The Average Returns On The Window [-10,10] Of The Event Of M&A Announcement For Domestic And Cross Border M&A In Emerging Countries.
Figure 3 and Figure 4 show that cross-border acquisitions have shown more CAR in developed countries than domestic acquisitions in the technology industry, and cross-border acquisition shows lesser CAR in emerging countries.
H3a: Acquiring companies from developed countries will have better short-term returns in cross-border acquisitions than domestic acquisitions.
H3b: Acquiring companies from emerging countries will have better short-term returns in domestic acquisitions than cross-border acquisitions.
Experience
This research concluded from the literature that first-time acquisitions of technological target businesses could maximize the benefits of the acquiring companies' stock price effect. Investors may respond to future M&A less strongly. As a result, businesses without prior merger and acquisition experience tend to generate more abnormal returns than acquiring companies with prior M&A experience.
The short-term CAR tendency for acquiring organizations with M&A experience and those without M&A experience is shown in Figure 5. The companies were chosen randomly from a sample of 50 technology companies during the 21-day event surrounding the announcement date. The stock price of the acquiring firm is plotted to observe the short-term trends in the two situations ten days before and ten days after the acquisition announcement, respectively, according to the event window. According to Figure 5 above, organizations with no prior experience have experienced better short-term returns than organizations with expertise.

Figure 5: The Average Returns On The Window [-10,10] Of The Event Of M&A Announcement For Experienced And First Timer M&A In Emerging Countries.
H4: The CAR of acquiring companies without experience will outperform those with experience.
Buy-and-hold Abnormal Returns
According to Rau & Vermaelen (1998), low book-to-market ratios of the acquiring businesses cause managers to overestimate their ability to manage the acquisitions, which results in long-term underperformance. Generally speaking, the event study literature uses BHAR to evaluate long-term stock performance. The study aims to determine whether acquiring a technology can encourage investors to purchase and hold the acquiring company's stock over the long run. Figure 6 shows a line graph to illustrate the short-term trend of the mean of purchase growth and hold abnormal returns for the sample of 27 technology companies during the event period of 12 months of stock price trends around the announcement dates. It indicates that the acquiring company's stock price is plotted to observe long-term trends twelve months after the announcement of the purchase.

Figure 6: The Long-Term Average Returns On The Window Of [1,12] Months.
After the acquisition procedure and execution of the same, the long-term returns typically decline.
H5: The long-term abnormal returns of companies acquiring Technology firms will be negative.
Variables
Variables used in this study, their definition, deflators (as applicable) and sources are given in Table 4:
| Table 4 Variables Used In This Study And Database Sources |
|
|---|---|
| Variable | Definition |
| CAR | Cumulative Abnormal Returns: Sum of the differences between the expected return on a stock and the actual return often used to evaluate news's impact on a stock price. |
| BHAR | Buy and Hold Abnormal Returns: Sum of the difference between normal buy-and-hold returns and the realized buy-and-hold return. |
| MBRatio (Number) | Market to Book Ration: The ratio of the market capitalization to book value |
| LNAsset (USD) | The logarithm value of acquiring a company's total assets |
| DEALSIZE (USD) | The ratio of the transaction value to the market capitalization of the acquiring company |
| DUMH (Dummy) | 1 - target company i is related to computer hardware and equipment, 0 - otherwise |
| DUMC (Dummy) | 1 - target company i is related to communications equipment, 0 - otherwise |
| DUMS (Dummy) | 1 - target company i is related to Software, eCommerce and internet, 0 - otherwise |
Empirical Model and Analysis
The variables outlined below have created a linear regression model based on the hypotheses. The equations below predict the company's short- and long-term performance following a merger or acquisition. The parameters specified in the theories mentioned above form the basis for the independent variables. CAR and BHAR, which reflect the short- and long-term abnormal returns of the M&A event, respectively, are the two estimated dependent variables.
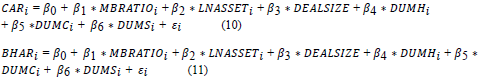
Here,  are the cumulative abnormal returns for acquirer organization i,
 are the long-term Buy and Hold abnormal returns for acquirer organization i,
 is the market-to-book ratio for the acquired organization i,
 is the logarithm of the asset value of the acquirer organization i during acquisition,
 is the cost of the acquisition in U.S. dollars for an acquired organization i,
 = 1, if the target company i is related to computer hardware and equipment,
= 0 otherwise.
 =1if the target company i is related to communications equipment,
= 0 otherwise.
 =1 if the target company i is related to Software, e-commerce, and the internet,
=0 otherwise
Correlation Analysis
The correlation matrix for the variables, including the dummy variables for the categories of technology companies, is shown in Table 5 and is applied to the mean-adjusted return model, the market model, and the market-adjusted model. No correlation coefficient between the independent variables in the model has been higher than one or lower than -1. The term "autocorrelation" describes the degree of correlation between the values of the same factors across various data observations. Regression models were examined for clustering using the Wooldridge test procedure. Table 5, in the next section, shows the results of the Wooldridge test.
| Table 5 Correlation Matrix For The Independent Variables Of The Market Model |
||||||
|---|---|---|---|---|---|---|
| 1 | 2 | 3 | 4 | 5 | 6 | |
| DUMH | 1 | |||||
| DUMC | -0.341 | 1 | ||||
| DUMS | -0.273 | 0.552 | 1 | |||
| MBRATIO | -0.183 | 0.124 | 0.176 | 1 | ||
| LNASSET | 0.277 | -0.303 | -0.065 | 0.226 | 1 | |
| DEALSIZE | 0.083 | -0.172 | -0.023 | -0.166 | 0.102 | 1 |
Source: own estimates from Orbis data 2005-2015
Regression Analysis
The model and regression methodology will be compared based on the type of data used for the analysis and estimation of the abnormal returns for all regression models (the distinction is in the profitability variable). Panel data suggests the use of the proper approach to the data. The Hausman test results are presented in Table 7. It can be seen that Prob> chi2 = 0.000 means p-value = 0.000 <α = 5%, so there is enough basis to reject the hypothesis, then the fixed effects model (FEM) is more appropriate than the random effects model (REM). FEM was the best model selected by testing the running model methods. To test the dependence of abnormal return on other factors, the three specifications of the market model with different combinations of the variables that describe the impact of M&A parameters on CAR during the event windows: [-20,+20], [-10,+10], and [-1,+1].
The VIF indicators of Models 1 and 2 exhibit less than 2; in the third model, it is less than 3, as shown in Table 6 below. Hence, there is no evidence of multicollinearity in these models.
| Table 6 Car For Different Event Windows And Different Models |
|||
|---|---|---|---|
| Event window | Market model | Market adjusted model | The mean adjusted return model |
| CAR [-20,+20] | 0.22% | -0.39% | 0.73% |
| CAR [-10,+10] | 1.35%* | 1.06% | 1.98%** |
| CAR [-3,+3] | 1.05% ** | 0.89%* | 1.26%** |
| CAR [-1,+1] | 1.04% *** | 1.01%*** | 1.09%*** |
| CAR [0,+1] | 1.73%*** | 1.56%*** | 1.25%*** |
| VIF | 1.543 | 1.735 | 2.117 |
Notes: The significance of independent variables are marked as follows: * significant at 10%; ** significant at 5%;
*** significant at 1%. This Table shows the CAR estimated by different models on several event windows for acquiring firms.
Source: own estimates from Orbis data 2005-2015
Bruesh Pagan test has been done to test whether or not the model was subject to heteroskedasticity. Breusch-Pagan heteroskedasticity tests imply the two following hypotheses. H0: The data is homoskedastic. H1: The data is heteroskedastic. If the p-value associated with the test falls below a threshold of 0.05, the conclusion is that the data is heteroskedastic. The test results produced a small p-value (less than 0.05 default), and that hypothesis was rejected.
The findings shown in Table 7 lead to a coefficient p-value of 0.05. According to the findings of the testing model, all of the obtained p-values were equivalent to 0.000 (5%), indicating that the hypothesis that heteroskedasticity did not exist in the model was rejected at a 5% significant level. The variables influencing the abnormal return of stocks have been subjected to studies for heteroskedasticity and autocorrelation. To overcome the limitations of the model, the required adjustments are made. The Table above shows the findings of the Breusch Pagan test, and three models do not have heteroskedasticity.
| Table 7 Tests Performed On The Data For Testing The Hypothesis For The Model Selection, Autocorrelation And Heteroskedasticity |
|||
|---|---|---|---|
| Tests Performed | Test Details | Test Results | Interpretations |
| Hausman test (for deciding between fixed effects model and the random-effects model) |
The Hausman test can help you choose between the fixed or random-effects models in panel data analysis. The null hypothesis is that the preferred model is random effects; The alternate hypothesis is that the model has fixed effects. |
Chi-Square = 74.535 p_value = 0.0000 >a = 0.05 | Do not reject the H0 hypothesis. Use FEM |
| Wooldridge test | For the Panel data, the Wooldridge test is used to identify the data's first-order autocorrelation. The null hypothesis is no first-order autocorrelation and the alternate hypothesis for the presence of autocorrelation | Chi-square = 73.608 Prob> F = 0.000 <a = 5%, | Reject the H0 Hypothesis. No autocorrelation |
| Breusch Pagan test | It is a chi-squared test: the test statistic is distributed chi-square with k degrees of freedom. A p-value below an appropriate threshold (e.g., p < 0.05) implies that the null hypothesis of homoskedasticity is rejected and heteroskedasticity assumed. |
BP = 173.08 p-value <a = 0.05. |
Do not reject the H0 Hypothesis. No heteroskedasticity |
Source: own estimates from Orbis data 2005-2015
Results and Hypothesis Test
The three datasets have been used in the regression based on the samples available for the regression—the first sample contained all the 174 M&A technology company deals. The second was tested on 142 companies from developed countries, and the third was tested on only 32 companies from emerging countries. The results are tabulated below in Table 8. Each dataset was used after the data cleansing. This kind of distribution was done to balance the mixes of the types of markets and identify the various combinations of CARs based on the acquiring company belonging to the developed and emerging countries. The results show that regression on datasets 1 and 2 have a higher significance of determinants than dataset 3. This result may be due to the exclusion of sector indicators and the small number of observations used to estimate dataset 3.
| Table 8 Fem Regression Results For Car(P-Values In Brackets) |
|||
|---|---|---|---|
| Dependent variable: CAR | |||
| Dataset 1 | Dataset 2 | Dataset 3 | |
| DUMH | -0.0189* (0.008) |
-0.0213* (0.016) |
|
| DUMC | -0.032** (0.023) |
-0.027** (0.018) |
|
| DUMS | -0.042 (0.007) |
-0.0342 (0.005) |
|
| MBRATIO | -0.002 (0.002) |
-0.001* (0.001) |
0.002 (0.002) |
| LNASSET | -0.002* (0.001) |
-0.001* (0.0002) |
0.006** (-.002)** |
| DEALSIZE | 0.035 (0.033) |
0.076* (0.034) |
-0.092 (0.042) |
| Constant | 0.062* (0.022) |
0.029 (0.044) |
0.066 (0.077) |
| Observations | 174 | 142 | 32 |
| R2 | 0.512 | 0.662 | 0.532 |
| Adjusted r2 | 0.475 | 0.629 | 0.489 |
| Residual std. Error | 0.061 | 0.055 | 0.038 |
| Akaike criterion | 213.32 | 232.21 | 301.27 |
| Schwartz criterion | 209.21 | 223.62 | 342.36 |
| F statistic | 17.41 (df = 7) | 20.78 (df =7 ) | 3.52 (df = 4) |
Notes: The independent variables' significance is marked as follows: * significant at 10%; ** significant at 5%; *** significant at 1%. The dependent variable is CAR estimated for the event window [0,1]. Dataset 1 is tested for the entire sample, dataset 2 is tested for companies from developed markets, and dataset three is tested for companies from emerging markets.
Source: own estimates from Orbis data 2005-2015.
The coefficient of LNASSET (log of total assets value) is significantly negative for datasets 1 and 2. It indicates that the smaller the acquirer, the higher its abnormal return after acquiring a technology company. The result corresponds to other findings (e.g., Narayan et al., 2017) about side effects (higher returns volatility for smaller firms) after significant events. The variable DEALSIZE has a significant positive effect in dataset 1 and dataset 2, while in dataset 3, the value is negative and significant. The negative influence may indicate that companies in emerging countries consistently overpay to acquire technology companies. The variable MBRATIO has a significant negative effect in dataset 1 and dataset 2, while in dataset 3, the value is positive and significant. It implies that in developed countries, the low market-to-book ratio acquirers have a positive impact post-merger.
In contrast, in emerging markets, the low market-to-book ratio acquirers have a negative impact post-merger. It is consistent with the study by Rau & Vermaelen (1998), who found that low market-to-book firms tend to underperform those with high book-to-market ratios in emerging markets. The results from Table 8 describe the impact of sector-based factors using dummy variables on the CAR. The acquiring firms belonging to computer hardware negatively affect CAR for datasets 1 and 2 with −0.0189 and −0.0213, respectively, at a 1% significance level. The acquiring firms belonging to electronics and communications negatively affect the CAR for dataset 1 and dataset 2 with −0.032 and −0.027 at a 5% significance level. Acquiring firms belonging to Software, e-commerce, and the internet negatively affects the CAR in dataset 1 and dataset 2 with −0.042 at a 5% significance level. All the technology segments harm cumulative abnormal returns, as the data shows. However, again based on dataset 1 and 2 estimates, it is evident that software internet and e-commerce sectors have marginally more impact on the profitability post-M&A than the hardware and communications sector.
Robustness Testing
Three alternative Model 1 specification were used with various combinations of the variables that describe the impact of M & A parameters on CAR during the event window of 2 days from the day of announcement defined as [0,1] in order to test the robustness of the regression method being used for dependencies of abnormal return on other factors. On the complete sample of M&A transactions, the first specification was tested. In organizations from developed markets, the alternative specification approach was tried. The third plan was put to the test of businesses from developing nations. The third case dummy factors were removed from the third model due to the small sample size. The following criteria are used to evaluate how stable the model is.
The criterion considers the number of parameters used and how well the points match the model. According to AIC and S.C., the best-fit model explains the most significant variation with the fewest independent variables. According to the two factors mentioned above, the first model is the best fit, as shown in Table 8. Apart from the other parameters like the Akaike Criterion (AIC), the F-statistic is another robustness check applied to the models and found the three models significant for the given datasets.
Hypothesis Testing
| Table 9 Car-Related Hypothesis And Results |
||||
|---|---|---|---|---|
| Hypothesis | Results | t-stat | p-value | |
| H1 CAR > 0 |
CAR 1.67% |
3.271 | 0.0023 | |
| H2: CARdeveloped > CARemerging |
CARdeveloped 1.73% | CARemerging 0.95% | 4.827 | 0.0053 |
| H3a: CARdeveloped, cross-border > CARdeveloped, domestic |
CARdeveloped, cross-border 1.83% |
CARdeveloped, domestic 0.96% | 13.727 | 0.001 |
| H3b: CARemerging, domestic > CARemerging, cross-border |
CARemerging, domestic 1.64% |
CARemerging, cross-border -0.78% | 7.646 | 0.0001 |
| H4: CARwithoutExp > CARwithExp |
CARwithoutExp 1.98% |
CARwithExp 0.07% |
12.682 | 0.005 |
Notes: All the presented results are obtained using the market model. CAR was estimated on the event window [- 10,+10]. The formula was used to test the statistical significance of CAR.
Source: own estimates from Orbis data 2005-2015
With a cumulative average return (CAR) for the market model of +1.67%, CAR is notable for all models at a 1% level within the event window [-10,+10]. As a result, at a 5% threshold of significance, hypothesis H1 regarding the positive value of the CAR is not rejected. Companies from developed markets have a better CAR than emerging markets for the event window [0,1]. The test data indicate that the developed countries' CAR value is estimated at +1.73%, while the emerging countries' CAR value is at +0.96%.
At the 1% level, the findings are significant. It demonstrates that investors accept that developed markets represent less risky business opportunities than emerging markets. As a result, at a 1% level of significance, hypothesis H2 regarding established and emerging markets are not rejected. Domestic M&As produce higher stock returns when acquiring companies from established countries, and local deals are more lucrative when acquiring companies from emerging nations. Results from developed countries indicate that CAR in local and cross-border transactions is equivalent to +1.83% and +0.96%, respectively. Domestic transactions are more profitable for businesses in emerging countries (+1.64%), while cross-border transactions have a negative CAR (-0.78%). In light of this, hypotheses H3a and H3b regarding the developed and developing cross-border situations are not ruled out at a 1% significance level. The results indicate that the CAR of the acquiring companies without experience is +1.98%.
In contrast, the CAR of acquiring companies with experience in acquiring technology companies is 0.07%, which is considerably lower. Investors are assumed not to think that seasoned businesses can add value by frequently acquiring new technologies through M&A. Again, this means that at a significance level of less than 1%, hypothesis H4 should not be dismissed. Examining the event's long-term effects on the market price came next, and BHAR was computed within a 1-year event window (250 trading days or 12 months).
The models' results showed negative significant BHAR values, as seen in Table 10. It implies that technology mergers and acquisitions decrease the value of the acquiring company in the long run. Thus, hypothesis H5 is not rejected by any of the abovementioned models.
| Table 10 Estimated Value Of Bhar For Event Window [1,12] In Months |
|||
|---|---|---|---|
| BHAR for the 12-month Event Window | |||
| Event Window | Constant Mean Return Model | Market Model | Market-Adjusted Model |
| BHAR (1,12) | - 0.1317** | -0.1147*** | -0.1135* |
Notes: The significance of independent variables are marked as follows: * significant at 10%; ** significant at 5%;
*** significant at 1%. The Table shows long-term abnormal returns measured by BHAR.
Source: own estimates from Orbis data 2005-2015.
The following are some specific findings and conclusions based on the data shown in the above tables. There are positive short-term abnormal returns for the stocks of the companies acquiring technology firms, consistent with some earlier studies on technology M&A as detailed in the literature review section. However, technology M&As do not generate value for the acquiring companies over time. It could simply be a sign of the investors' early overreaction to the news of the technology M&A and the later effects of the declining returns. According to Rosen's (2006) research, if there is a high level of M&A activity in the market, the acquiring companies experience high returns in the near term, but their profitability declines over time. However, once more, some studies have predicted the exact opposite of the results. According to Schoar (2002) and Braguinsky et al. (2015), the acquirer's productivity declines after a merger for a brief time before rising and significantly improving over the long run. The negative long-term results could be the result of some exceptional circumstances.
The external factors influencing economic and financial conditions are crucial when estimating long-term abnormal returns. Beginning in 2008 and lasting for two years in both established and developing markets, there has been a financial recession. It affects technology organizations' overall profitability over the long run. As a result, the returns of the M&A deals may have had an effect. However, the study time was extended to 10 years to normalize such events. M&A in technology that includes acquiring businesses This conclusion appears to be accurate given that the developed country businesses work in a setting that supports the adoption of the target technology, as suggested by the literature. Compared to businesses from emerging markets, firms from developed nations offer higher returns.
According to research by Lusyana & Sherif (2016) on the performance of acquiring companies, domestic acquisitions are more successful than cross-border ones in the near term. However, the research here found that cross-border acquisitions showed higher CAR for acquirers from developed countries, suggesting that investors reacted favourably to the growth strategy in emerging countries. Due to the cost of conducting business outside emerging countries, domestic transactions suggest greater short returns for companies looking to acquire businesses from those countries. Investors from emerging nations may view cross-border acquisitions as riskier than investors from established nations.
Cross-border acquisitions showed higher CAR for acquirers from developed nations, demonstrating that the investors well-received the expansion plan. Domestic acquisitions suggest greater returns for companies from developing nations, whereas investors may view foreign acquisitions as carrying more significant risk. Arguments from Eun et al. (1996) and Seth et al. (2002), who found that the primary factor for successful cross-border technological acquisitions is the expectation of acquiring companies that the knowledge of target firms will be rapidly adopted in their home markets, lend support to that conclusion.
According to the results based on the categories of sectors in the technology industry, the Software, internet, and e-commerce sectors have a more significant effect on the organization's profitability than the hardware and communications sectors. According to Hui-Shan Lee et al. (2016), the nature of the company experiencing the event may have an additional effect on the overall abnormal returns. In terms of how an occurrence like a merger and acquisition will affect the market, the hardware and communication sectors are more established, more stable, and less volatile.
Conclusion
Some technology-related acquisitions might not fall under the suggested definition of technology M&A. The study, however, can be helpful for academics and practitioners to analyze the post-merger investor behaviour of the technology sector because the considered approach explains which target firms are connected to the technology sector. The following issues with the data gathering, the study's scope, and some exclusions limit this study:
1. Since there is a lack of information on M&A transactions, particularly for businesses in developing nations like China and India, it is difficult to draw firm conclusions from the findings of empirical analysis.
2. The suggested classification of technology Some possible acquisitions related to financial technologies may not be included in M&A.
3. The research can, however, assist academics and practitioners in their analysis of post-merger investor behaviour because the considered approach explains which target firms are associated with the technology sector using the categories of dummy variables.
References
Antoniou, A., Guo, J., & Petmezas, D. (2008). Merger momentum and market valuations: the UK evidence. Applied Financial Economics, 18(17), 1411-1423.
Indexed at, Google Scholar, Cross Ref
Aw, M.S.B., & Chatterjee, R. A. (2004). The performance of UK firms acquiring large cross-border and domestic takeover targets. Applied Financial Economics, 14(5), 337-349.
Indexed at, Google Scholar, Cross Ref
Bessembinder, H., & Zhang, F. (2013). Firm characteristics and long-run stock returns after corporate events. Journal of Financial Economics, 109(1), 83-102.
Indexed at, Google Scholar, Cross Ref
Braguinsky, S., Ohyama, A., Okazaki, T., & Syverson, C. (2015). Acquisitions, productivity, and profitability: evidence from the Japanese cotton spinning industry. American Economic Review, 105(7), 2086-2119.
Indexed at, Google Scholar, Cross Ref
Brockman, P., Rui, O.M., & Zou, H. (2013). Institutions and the performance of politically connected M&As. Journal of International Business Studies, 44, 833-852.
Indexed at, Google Scholar, Cross Ref
Brown, S.J., & Warner, J.B. (1980). Measuring security price performance. Journal of Financial Economics, 8(3), 205-258.
Indexed at, Google Scholar, Cross Ref
Chari, M. D., & Chang, K. (2009). Determinants of the share of equity sought in cross-border acquisitions. Journal of International Business Studies, 40, 1277-1297.
Indexed at, Google Scholar, Cross Ref
Da Rosa, R.S., Izan, H.Y., Steinbeck, A., & Walter, T. (2000). The method of payment decision in Australian takeovers: An investigation of causes and effects. Australian Journal of Management, 25(1), 67-94.
Indexed at, Google Scholar, Cross Ref
Dewan, A. (2017). Organizational Culture & Human Resource Management: A Scenario in The Case of Mergers & Acquisitions. Global HRM Review, 62.
Dranev, Y., Frolova, K., & Ochirova, E. (2019). The impact of fintech M&A on stock returns. Research in International Business and Finance, 48, 353-364.
Indexed at, Google Scholar, Cross Ref
Eun, C.S., Kolodny, R., & Scheraga, C. (1996). Cross-border acquisitions and shareholder wealth: Tests of the synergy and internalization hypotheses. Journal of Banking & Finance, 20(9), 1559-1582.
Indexed at, Google Scholar, Cross Ref
Ferrer, R.C. (2012). An Empirical Investigation of the Effects of Merger and Acquisition on Firms' Profitability. Academy of Accounting and Financial Studies Journal, 16(3), 31-56.
Fuller, K., Netter, J., & Stegemoller, M. (2002). What do returns to acquiring firms tell us? Evidence from firms that make many acquisitions. The Journal of Finance, 57(4), 1763-1793.
Indexed at, Google Scholar, Cross Ref
Kish, R.J., & Vasconcellos, G.M. (1993). An empirical analysis of factors affecting cross-border acquisitions: US-Japan. MIR: Management International Review, 227-245.
Kohers, N., & Kohers, T. (2001). Takeovers of technology firms: Expectations vs. reality. Financial Management, 35-54.
Indexed at, Google Scholar, Cross Ref
Kohers, N., & Kohers, T. (2000). The value creation potential of high-tech mergers. Financial Analysts Journal, 56(3), 40-51.
Indexed at, Google Scholar, Cross Ref
Lee, H.S., Cheng, F.F., & Chong, S.C. (2016). Markowitz portfolio theory and capital asset pricing model for Kuala Lumpur stock exchange: A case revisited. International Journal of Economics and Financial Issues, 6(3), 59-65.
Lusyana, D., & Sherif, M. (2016). Do mergers create value for high-tech firms? The hounds of dotcom bubble. The Journal of High Technology Management Research, 27(2), 196-213.
Indexed at, Google Scholar, Cross Ref
MacKinlay, A.C. (1997). Event studies in economics and finance. Journal of Economic Literature, 35(1), 13-39.
McCarthy, K.J., & Aalbers, H.L. (2016). Technological acquisitions: The impact of geography on post-acquisition innovative performance. Research Policy, 45(9), 1818-1832.
Indexed at, Google Scholar, Cross Ref
Mitchell, M.L., & Stafford, E. (2000). Managerial Decisions and Long-Term Stock Price Performance. Journal of Business.
Indexed at, Google Scholar, Cross Ref
Ooghe, H., Van Laere, E., & De Langhe, T. (2006). Are acquisitions worthwhile? An empirical study of the post-acquisition performance of privately held Belgian companies. Small Business Economics, 223-243.
Indexed at, Google Scholar, Cross Ref
Paruchuri, S., Nerkar, A., & Hambrick, D.C. (2006). Acquisition integration and productivity losses in the technical core: Disruption of inventors in acquired companies. Organization Science, 17(5), 545-562.
Indexed at, Google Scholar, Cross Ref
Prabhu, J.C., Chandy, R.K., & Ellis, M.E. (2005). The impact of acquisitions on innovation: poison pill, placebo, or tonic? Journal of Marketing, 69(1), 114-130.
Indexed at, Google Scholar, Cross Ref
Graebner, M.E., Eisenhardt, K.M., & Roundy, P.T. (2010). Success and failure in technology acquisitions: Lessons for buyers and sellers. Academy of Management Perspectives, 24(3), 73-92.
Indexed at, Google Scholar, Cross Ref
Roll, R. (1986). The Hubris hypothesis of corporate governance. The Journal of Business, 59(2).
Rosen, R.J. (2006). Merger momentum and investor sentiment: The stock market reaction to merger announcements. The Journal of Business, 79(2), 987-1017.
Indexed at, Google Scholar, Cross Ref
Schoar, A. (2002). Effects of Corporate Diversification on Productivity. Journal of Finance.
Indexed at, Google Scholar, Cross Ref
Schoefer, K., Wäppling, A., Heirati, N., & Blut, M. (2019). The moderating effect of cultural value orientations on behavioral responses to dissatisfactory service experiences. Journal of Retailing and Consumer Services, 48, 247-256.
Indexed at, Google Scholar, Cross Ref
Seth, A., Song, K.P., & Pettit, R.R. (2002). Value creation and destruction in cross-border acquisitions: an empirical analysis of foreign acquisitions of US firms. Strategic Management Journal, 23(10), 921-940.
Indexed at, Google Scholar, Cross Ref
Sunje, A., Rahimi?, Z., & Filipovi?, D. (2012). The importance of compatibility in management style for successful change management in acquired companies. Ekonomski Pregled, 63(7-8), 379-396.
Tarasofsky, A., & Corvari, R. (1991). Corporate Mergers and Acquisitions: Evidence on Profitability. Economic Council of Canada.
Weber, Y., Yedidia Tarba, S., & Reichel, A. (2009). International mergers and acquisitions performance revisited–the role of cultural distance and post. In Advances in mergers and acquisitions (pp. 1-17). Emerald Group Publishing Limited.
Indexed at, Google Scholar, Cross Ref
Zhang, Y., Wu, X., Zhang, H., & Lyu, C. (2018). Cross-border M&A and the acquirers’ innovation performance: an empirical study in China. Sustainability, 10(6), 1796.
Indexed at, Google Scholar, Cross Ref
Received: 14-Mar-2023, Manuscript No. AAFSJ-23-13333; Editor assigned: 16-Mar-2023, PreQC No. AAFSJ-23-13333(PQ); Reviewed: 30-Mar-2023, QC No. AAFSJ-23-13333; Revised: 03-Apr-2023, Manuscript No. AAFSJ-23-13333(R); Published: 10-Apr-2023