Research Article: 2022 Vol: 26 Issue: 5
How did Coronavirus Differently Affect the Volatility of the Major Indices of Eurasian Countries?
Manan Agrawal, Fountainhead School
Janki Mistry, Veer Narmad South Gujarat University
Citation Information: Agrawal, M., & Mistry, J. (2022). How did coronavirus differently affect the volatility of the major indices of eurasian countries?. Academy of Accounting and Financial Studies Journal, 26(5), 1-15.
Abstract
Coronavirus was able to spread way more quickly than expected, destroying the daily functioning of many of the major economic centres and forced people away from each other Roy. Today, the world has reached new heights of interdependence which allows for great opportunities to rise, however, the negative effects of the same such as the pace at which pandemics such as the coronavirus spread, cannot be ignored. Coronavirus absolutely destroyed Europe as the nations were unprepared for self-sustenance. COVID-19 has also helped Europe question its intercontinental dependence. The political situation too is destructive, this can be seen through the dilemma governments are facing. For instance, in India during the first wave when the lockdown was imposed, the government was criticized for the economic loss, in contrast, during the second wave as the lockdown was not timely imposed, the government was criticized for the rise in the number of deaths and cases. Nations around Europe have adopted strict policies to stop the spread of the virus. Complete lockdowns, work from home, social distancing and usage of face masks in public places have become commonplace in most countries of the world. Japan has allocated more than 4.5 trillion Japanese yen in just two supplementary budgets in 2020 for healthcare (Asgari, 2021).The Indian government has spent more than half that amount for medical equipment such as personal protective equipment kits, ventilators as well as test kits until April 2020 and the European Union has spent 2,364.3 billion Euro on coronavirus recovery till 17th May 2021 European Council. There is hope though as it is obvious that coronavirus will one day be a thing of the past. This paper aims at examining the impact of the Covid-19 Pandemic on stock markets of selected Eurasian countries. Covid-19 disrupted economic activities across all sectors, including the stock markets. It has become amply clear that the government systems all over the world have collapsed and have been largely unable to control both the first and the second wave of the Covid-19 pandemic. This paper analyzes the volatility of the Eurasian stock markets pre coronavirus, during coronavirus and post coronavirus periods for the first wave of the pandemic. Stock market data of France, Britain, India, Japan, and Germany were analyzed and compared to see the impact of the pandemic on the major indices of Eurasian countries. It has been found that there is a definite difference in the volatility of the above mentioned stock market returns pre, during and post coronavirus periods of the first wave. This is found through comparison between the pre and during period, during and post period, and pre and post period.
Keywords
Covid-19, Volatility, Eurasian Stock Market, Event Study, Pandemic.
Introduction
The world is going through one of the most unsettling events since the second world war. The Covid-19 Pandemic has drastically altered the social and economic fabric of the world. Global destruction in all forms is being caused as a result of the Coronavirus disease (Billon-Galland, 2020). The pandemic is changing the way people live. Economic progress is expected to deteriorate, and the negative effect it has around the world could increase further (Cimmino et al., 2020) as the healthcare mechanisms set in place globally are failing (World Health Organisation, 2020). It has affected the social, economic as well as political environment of the world. Even developed economies have buckled under the massive slap of the pandemic. Society today is facing a lot of problems, people are being separated from their families; they have been forced to work from their home and social gatherings have been severely limited as government restrictions were put into place (Roy, 2020; Goh, 2020; Hackenbroich et al., 2020).
Volatility, uncertainty, complexity and ambiguity have been beyond imagination during coronavirus. These factors (especially volatility) have clearly been observed in the stock markets. This is dominant because the stock market is the economic cardiogram of every country. The performance of the stock market this year though has been unconventional, with a path being followed that is failing to show a proper relationship with the state of the economy. This can be seen through the indices that have been behaving in a manner that cannot be easily explained by the current situation. Even in the middle of all this, the Eurasian markets are not properly researched upon in comparison to America. Thus, this paper aims to analyze how the Covid-19 pandemic differently affected the volatility for the Eurasian benchmark indices (Corke, 2020; Anderson et al., 2020; Feely & Jennings, 2020).
Review of Literature
COVID-19 PANDEMIC
As far as diseases go, nothing has affected the stock market as profoundly as the Covid-19 pandemic. With past diseases just causing temporary discrepancies, the reason for such a devastating impact is because of the strict government actions on business functions as well as social distancing requirements (Baker et al., 2020) APPENDIX.
The high volatility seen due to coronavirus in the stock market can find its roots in risk aversion; additionally, the way the Federal Reserve System promised for loans worth trillions of dollars, also had an effect on the volatility. However, the action taken is limited, which shows that the market movements were primarily based on opinions (Cox et al., 2020).
In the United Kingdom, as coronavirus progressed, the productivity of firms decreased further as the pandemic increased the intermediate costs. The problems caused by the coronavirus were for the most part restricted to firms that did not contribute much to the economy. In the long-run, however, productivity would be affected severely as funds are given to firms which were severely hampered due to the pandemic (Bloom et al., 2020).
Coronavirus has devasted the emerging markets. This is proven by the loss in the Gross Domestic Product, the number of deaths and the problems faced by the governments. In these markets Arellano et al. (2020) have analyzed debt relief programs and have concluded that their important because they have large social gains.
In Europe, the lack of government intervention has led to an increase in the failure of small and medium enterprises by 9.1 per cent. This is equivalent to 4.6 per cent of total employment in the private sector. The same however failed to make a noticeable impact on defaults on loans. Nonetheless, it was able to reduce the capital adequacy ratio. Moving on, it would be imperative that the government chose to support firms facing a high risk (Gourinchas et al., 2021).
Accordingly, there is a need for a study based on the inquiry raised after understanding the above papers which demand an answer to how coronavirus differently affected the volatility of the major indices of Eurasian countries. To analyze this specific event, researches that have already been conducted on specific events have to be reviewed to help form the methodology.
Event Studies
The behavior of daily stock returns before, during and after the October 1987 crash has been documented by (Schwert, 1989). It compares and contrasts the 1987 crash with previous crashes. It also analyzes the behavior of prices for options on stock market portfolios and for futures contracts on the S&P 500; these contingent claims contracts reinforce the conclusion that stock market volatility returned to lower, more normal levels quickly following the 1987 crash. This is unusual, relative to the evidence from previous crashes.
A paper by Gilchrist & Zakrajsek (2013) employed a heteroskedasticity-based approach to estimate the structural coefficient measuring the sensitivity of market-based indicators of corporate credit risk to declines in the benchmark market interest rates prompted by the large-scale asset purchases announcements. The results indicated that the large-scale asset purchases announcements led to a significant reduction in the cost of insuring against default risk--as measured by the credit default swap indexes-for both investment- and speculative-grade corporate credits.
Another article aims to test whether an announcement regarding a possible intervention and/or investment of a Private Equity in a company already listed has a signalling effect that can influence the behavior of investors and whether this potential difference is affected by the characteristics of the financial system of the country where companies are listed. The analysis leads to the conclusion that the certification role recognized to Private Equity during the listing process persist also for companies already listed in the financial markets, but mainly in market-oriented financial systems (Rizzotti & Nicosia, 2014).
Another paper evaluated the efficacy of the Secondary Market Corporate Credit Facility, a program designed to stabilize the corporate bond market in the wake of the Covid-19 shock. A diff-in-diff analysis shows that both announcements had large effects on credit spreads, narrowing spreads 20 basis points on eligible bonds relative to their ineligible counterparts within the same set of issuers across the two announcement periods (Gilchrist et al., 2020).
An event study published in 2021 itself analyzed the effect of 30 quantitative easing announcements made by 21 central banks in the midst of the global financial turmoil triggered by the coronavirus outbreak on daily government bond yields and bilateral US dollar exchange rates in March and April 2020. The paper also investigated the transmission of innovations to long-term interest rates in a standard global vector autoregressive model estimated with quarterly pre-coronavirus data. They find that quantitative easing has not lost effectiveness in advanced economies and that its international transmission is consistent with the working of long-run uncovered interest rate parity and a large dollar shortage shock during the coronavirus period. In emerging markets, the quantitative easing impact on bond yields is much stronger and its transmission to exchange rates is qualitatively different than in advanced economies (Rebucci et al., 2021).
Purpose
To study the stock market volatility during and after the peak COVID-19 effect of select Eurasian countries.
To examine how the event period volatility during the peak COVID-19 effect for France, Britain, India, Japan and Germany are different from each other.
Hypotheses
H0: The volatility of the Eurasian stock market was unaffected by the first wave of Covid-19 pandemic.
H1: The volatility of the Eurasian stock market was affected by the first wave of Covid-19 pandemic.
Approach
CAC 40, FTSE 100, Nifty 50, Nikkei 225, and DAX have been chosen as the benchmark indices for France, Britain, India, Japan, and Germany respectively. A peak coronavirus effect period has been observed for all the countries where as the name suggests, the effect of coronavirus was at its peak in the stock market in the specific nation. Data six months prior to the peak period, as well as post the peak period up till February 2021 has been considered under study. The peak period for France, Britain, Japan and Germany was from February 2020 to January 2021 and for India it was from March 2020 to October 2020 (Reuters, 2021).
Three countries from Europe and two from Asia have been chosen for the study. The three countries with the highest market capitalization in their stock markets in Europe have been selected. Euronext has the highest market capitalization and has its headquarters in Paris, France, followed by the London Stock Exchange, and 3rd on this list is Deutsche Bourse, which has its headquarters in Frankfurt, Germany. In Asia, again selection is on the basis of market capitalization. Only two countries – Japan and India were selected. China was avoided of the culture of excessive government intervention and lack of data transparency. The data was taken from Yahoo Finance and the analysis was conducted on Excel 2016.
After taking the adjusted closing price for any dividends or splits the returns are calculated using 100*LN(Adjusted Close/Previous Day’s Adjusted Close). Then the average return is calculated for the pre-coronavirus period which is the estimation window. This gives the average daily returns we should have expected if coronavirus had not occurred. So now, in order to calculate the abnormal returns, the expected returns are subtracted from the actual returns. Post this, we estimate the standard deviation of the pre-coronavirus period. After that, T Statistic is derived by using the formula, Abnormal Returns/Standard Error for the event window. T value above 1.96 is considered statistically significant.
Analysis
Days only refer to working stock market days shown in the data set (this means days such as weekends are not counted in the interpretation when explaining the analysis).
T-values refers to the results obtained from the t-test.
In March, the most statistically significant differences were seen for all the countries. April has the second highest difference in returns for all the countries. Most of the countries observed their lowest differences in December.
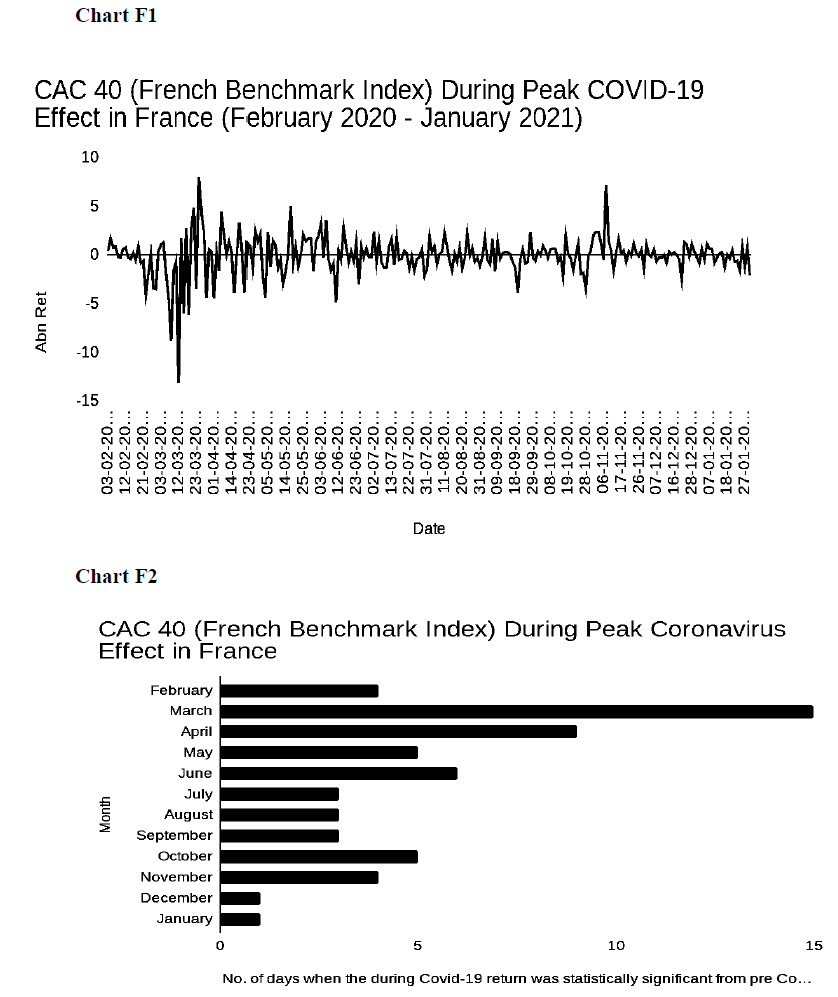
Cac 40 (French Benchmark Index) During Peak Coronavirus Effect In France
The difference in returns during February was observed in the last five days, four of which saw a rise in their return difference Table 1 and Table 2. The result had high differences throughout the month of March with only seven days being without the same. April noticed statistically significant results spread out through the month. May began with a little rise continuing the trend from April, however, the rest of the month observed only 3 statistically significant days. June saw three out of its first five days having notable differences, but is comparatively calmer in the middle. July and August saw only three days which were extremely well distributed. September again only saw three days, however it is slightly more concentrated towards the end. October saw five statistically significant days in the set of two and three in the middle and end of the month respectively. November observed all of its days with great differences in returns during the first six days. December saw only a single day of high difference. Only the last day of January was statistically significant.
| Table 1 French Benchmark Index |
|||
|---|---|---|---|
| Period Analysed | Pre-Covid-During Covid | During Covid-Post Covid | Pre-Covid-Post Covid |
| Dates | Aug 2019-Jan 2020 AND Feb 2020-Jan 2021 | Feb 2020-Jan 2021 AND Feb 2021 | Aug 2019-Jan 2020 AND Feb 2021 |
| Days for which Returns were statistically significant | 16, 17, 19, 20, 24, 25, 26, 29, 30, 31, 32, 33, 34, 35, 36, 37, 38, 39 40, 43, 46, 47, 51, 53, 55, 59, 61, 62, 63, 64, 70, 73, 78, 85, 86, 88, 91, 94, 100, 106, 115, 126, 128, 134, 143, 150, 153, 168, 181, 182, 188, 189, 190, 193, 194, 195, 198, 228, 255 | No statistically significant T-values | One, two |
| Table 2 Coronavirus Effect In France |
||
|---|---|---|
| Month | No. of Working days | No. of days when the during Covid-19 return was statistically significant from pre Covid-19 return |
| February | 20 | Four |
| March | 22 | 15 |
| April | 20 | Nine |
| May | 19 | Five |
| June | 22 | Six |
| July | 23 | Three |
| August | 21 | Three |
| September | 22 | Three |
| October | 22 | Five |
| November | 22 | Four |
| December | 22 | One |
| January | 20 | One |
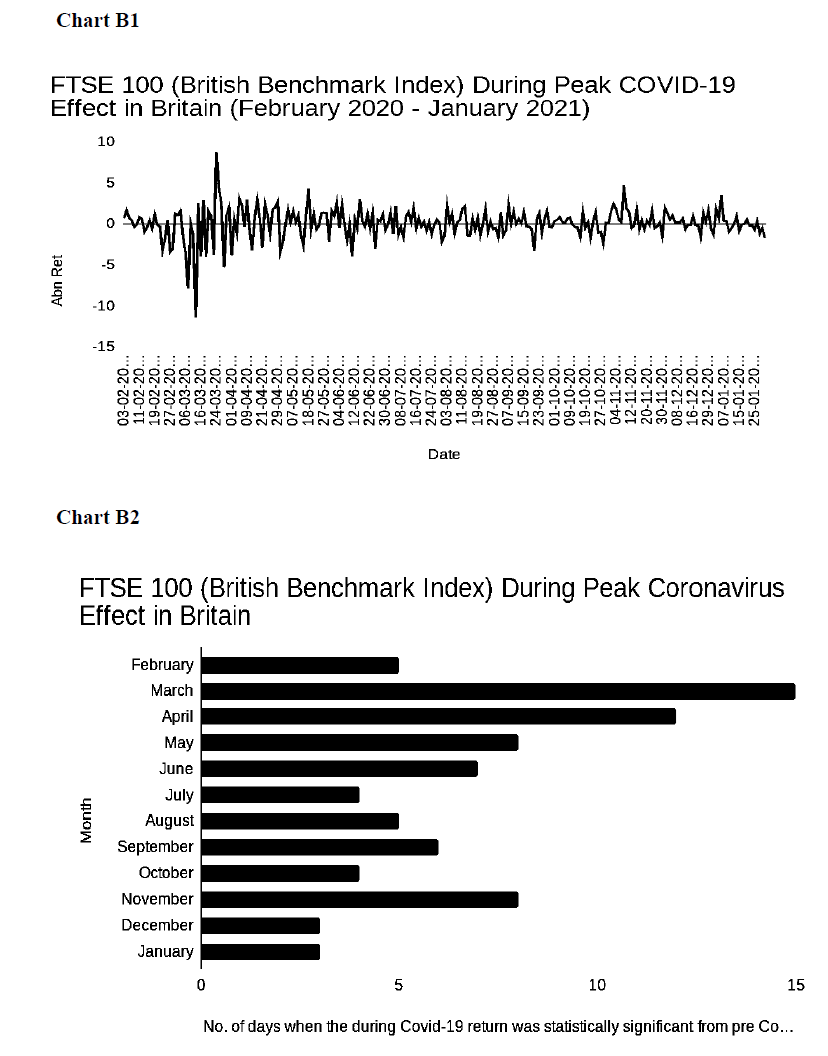
Ftse 100 (British Benchmark Index) During Peak Coronavirus Effect In Britain
The second day of February observes a high difference in return from the previous day, after this, the last five days see four of their days with great difference in results Table 3. March and April are full of these with only seven and eight days respectively not having statistically significant results. May, June and July all saw a strong effect in the beginning of the month. August notes a more even spread for its five days. September saw six days, however, the majority of them were in the beginning. October has its difference after the beginning, near the middle and end of the month. There is a significant increase in November in the significant differences, however, they are mainly in the beginning to the middle of the month. December saw only three days with one in the beginning and two in the end. The opposite can be observed for January with two of its three days in the beginning and one in the end Table 4.
| Table 3 Coronavirus Effect In Britain |
|||
|---|---|---|---|
| Period Analysed | Pre-Covid-During Covid | During Covid-Post Covid | Pre-Covid-Post Covid |
| Dates | Aug 2019-Jan 2020 AND Feb 2020-Jan 2021 | Feb 2020-Jan 2021 AND Feb 2021 | Aug 2019-Jan 2020 AND Feb 2021 |
| Days for which Returns were statistically significant | Two, 16, 17, 19, 20, 23, 25, 26, 29, 30, 31, 32, 33, 34, 36, 37, 38, 39, 40, 42, 43, 46, 47, 49, 51, 53, 55, 56, 59, 60, 61, 62, 63, 65, 67, 71, 73, 81, 82, 84, 86, 88, 90, 93, 99, 107, 110, 114, 125, 127, 133, 134, 140, 141, 142, 147, 148, 151, 153, 161, 164, 166, 179, 180, 183, 188, 191, 192, 193, 196, 197, 198, 201, 207, 212, 226, 229, 232, 234, 251 | No statistically significant T-values | One, 11, 20 |
| Table 4 Coronavirus Effect In Britain |
||
|---|---|---|
| Month | No. of Working days | No. of days when the during Covid-19 return was statistically significant from pre Covid-19 return |
| February | 20 | Five |
| March | 22 | 15 |
| April | 20 | 12 |
| May | 19 | Eight |
| June | 22 | Seven |
| July | 23 | Four |
| August | 20 | Fiv |
| September | 22 | Six |
| October | 22 | Four |
| November | 21 | Eight |
| December | 20 | Three |
| January | 20 | Three |
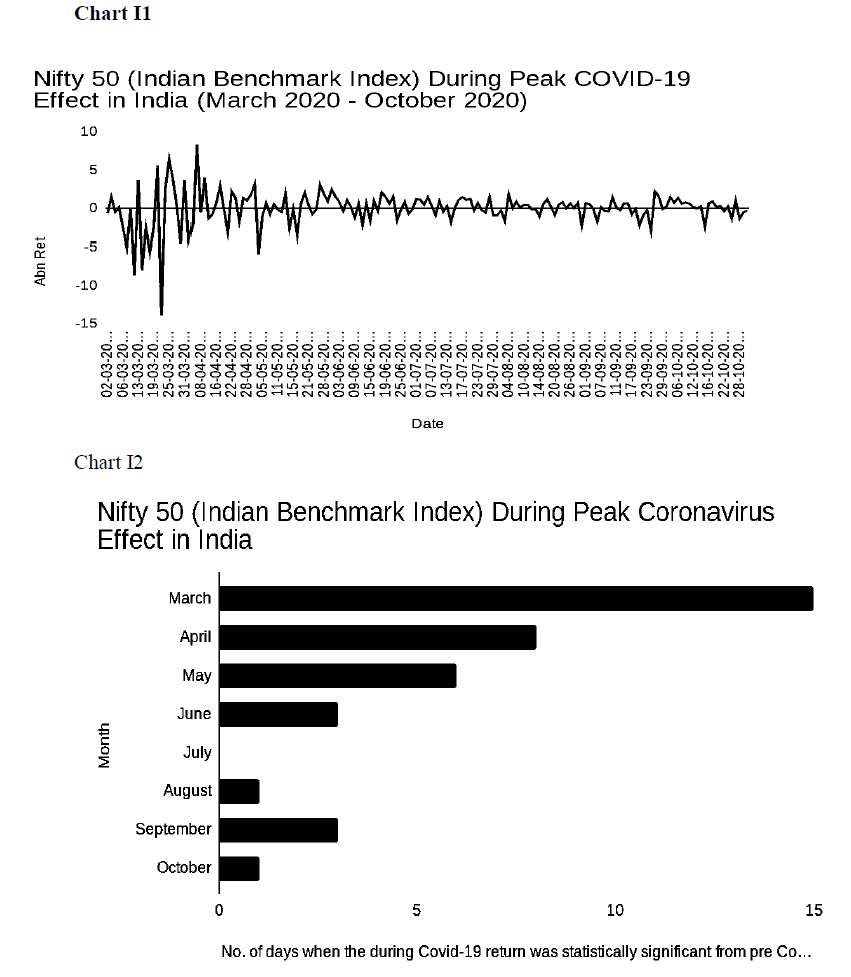
Nifty 50 (Indian Benchmark Index) During Peak Coronavirus Effect In India
In March, after the first four days, the month sees only days with great differences in the results except for three days Table 5. April sees days with great differences mostly near the beginning and middle of the month. May can be observed to have more statistical significance in the middle. June sees three days, but they are only in the beginning and middle of the month. July sees no days with statistically significant results. August has only its last day with statistically significant results. September does have three days that have high differences in their results towards the end of the month. October again sees only one day, but it is in the middle Table 6.
| Table 5 Coronavirus Effect In India |
|||
|---|---|---|---|
| Period Analysed | Pre-Covid-During Covid | During Covid-Post Covid | Pre-Covid-Post Covid |
| Dates | Sep 2019-Feb 2020 AND Mar 2020-Oct 2020 | Mar 2020-Oct 2020 AND Nov 2020-Feb 2021 | Sep 2019-Feb 2020 AND Nov 2020-Feb 2021 |
| Days for which Returns were statistically significant | Five, six, eight, nine, 10, 11, 12, 13, 14, 15, 16, 17, 18, 20, 21, 22, 23, 24, 26, 30, 32, 33, 39, 40, 47, 48, 50, 52, 56, 59, 67, 72, 124, 139, 142, 143, 156 | No statistically significant T-values | 58, 61, 62, 76, 80 |
| Table 6 Coronavirus Effect In India |
||
|---|---|---|
| Month | No. of Working days | No. of days when the during Covid-19 return was statistically significant from pre Covid-19 return |
| March | 21 | 15 |
| April | 18 | Eight |
| May | 19 | Six |
| June | 22 | Three |
| July | 23 | Zero |
| August | 21 | One |
| September | 22 | Three |
| October | 21 | One |
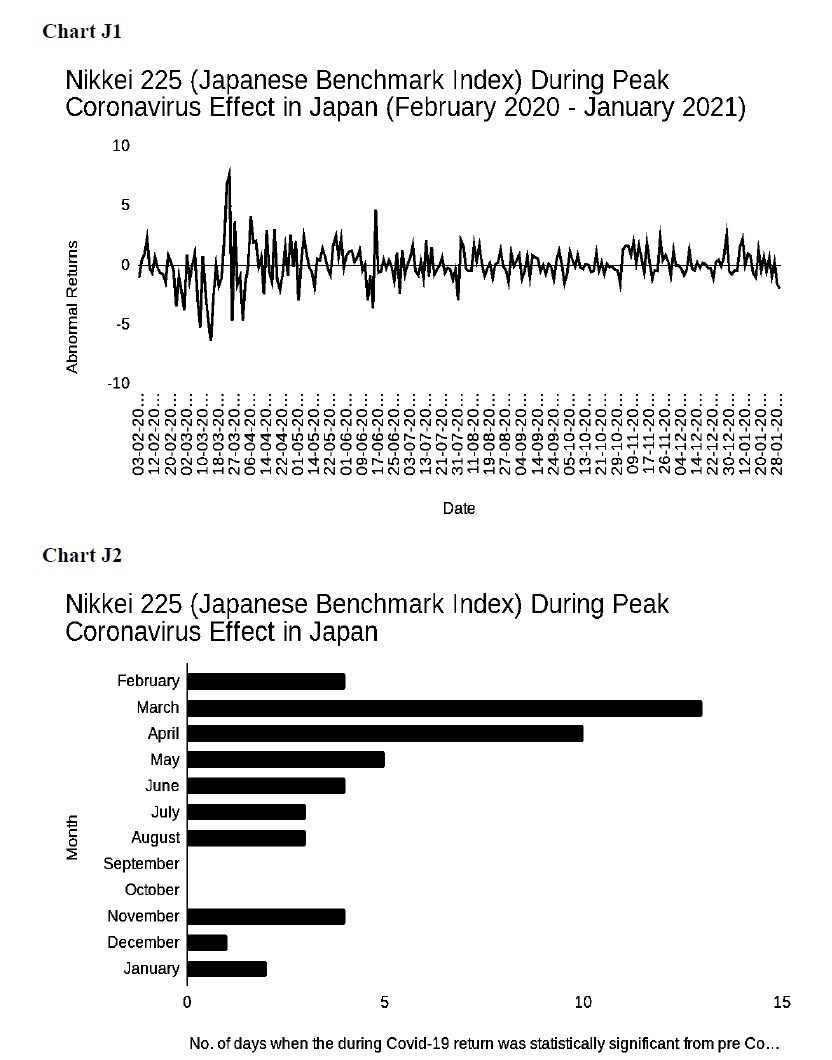
Nikkei 225 (Japanese Benchmark Index) During Peak Coronavirus Effect In Japan
February observed one statistically significant day in the beginning and three near the end Table 7. March was filled with unexpected movements of markets as only the first four days, three days in the middle, and the last day did not see this. April again saw high differences in returns, this was observed throughout the month in every one to three and lasted for one to three days. Statistically significant results seen in May were either in the beginning or in the end of the month with only one day near the middle. This is in contrast to June which saw this in the middle. July has only three days which are spread in a slightly more even manner. August observed statistical significance in the beginning. September and October did not see any notable difference in the prices. November had four statistically significant days that were concentrated in the middle. December saw only one day with a strong difference, which was towards the end of the month. January sees two days, one in the beginning and one in the end Table 8.
| Table 7 Coronavirus Effect In Japan |
|||
|---|---|---|---|
| Period Analysed | Pre-Covid-During Covid | During Covid-Post Covid | Pre-Covid-Post Covid |
| Dates | Aug 2019-Jan 2020 AND Feb 2020-Jan 2021 | Feb 2020-Jan 2021 AND Feb 2021 | Aug 2019-Jan 2020 AND Feb 2021 |
| Days for which Returns were statistically significant | Four, 15, 17, 18, 23, 24, 26, 27, 28, 29, 31, 33, 34, 35, 36, 37, 38, 39, 40, 43, 44, 45, 48, 49, 52, 54, 58, 60, 61, 63, 67, 75, 77, 87, 89, 90, 104, 109, 121, 122, 127, 129, 187, 189, 192, 197, 222, 228, 242 | 18 | Six, 10, 16, 18 |
| Table 8 Coronavirus Effect In Japan |
||
|---|---|---|
| Month | No. of Working days | No. of days when the during Covid-19 return was statistically significant from pre Covid-19 return |
| February | 18 | Four |
| March | 21 | 13 |
| April | 24 | 10 |
| May | 18 | Five |
| June | 22 | Four |
| July | 21 | Three |
| August | 20 | Three |
| September | 20 | Zero |
| October | 21 | Zero |
| November | 19 | Four |
| December | 22 | One |
| January | 19 | Two |
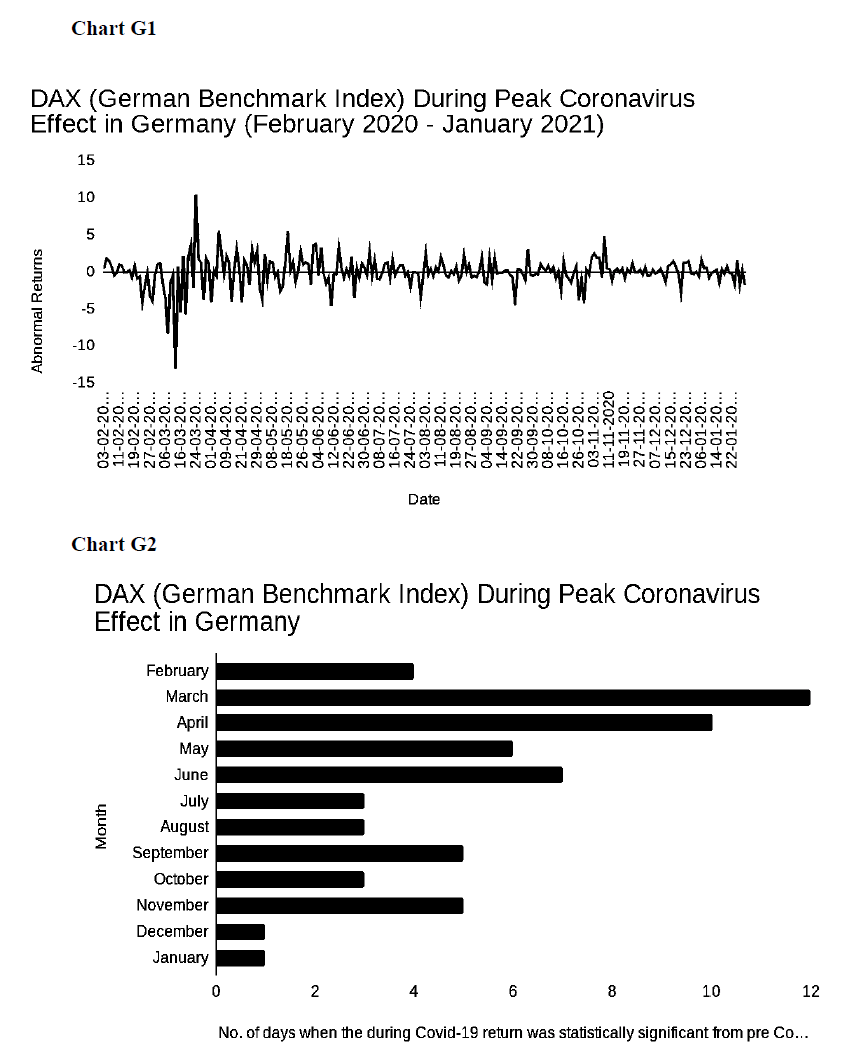
Dax (German Benchmark Index) During Peak Coronavirus Effect In Germany
In February, statistically significant results are only visible towards the end Table 9. March sees these results in abundance but it only begins after the first four days. April sees them almost as frequently as March, but it is better spread throughout the month. May and June observe high differences in the beginning-mid period, but also a few days near the end. July sees a day in the beginning and two in the end. August also sees only three statistically significant days, but they are more evenly spread. This increases in September to five days, three of which were in the beginning. October again observed only three days, two of these were in the end and one in the middle of the month. Although November did observe five days with high differences in the results they were all in the first six days. December and January notice the same only near the end Table 10.
| Table 9 Coronavirus Effect In Germany |
|||
|---|---|---|---|
| Period Analysed | Pre-Covid-During Covid | During Covid-Post Covid | Pre-Covid-Post Covid |
| Dates | Aug 2019-Jan 2020 AND Feb 2020-Jan 2021 | Feb 2020-Jan 2021 AND Feb 2021 | Aug 2019-Jan 2020 AND Feb 2021 |
| Days for which Returns were statistically significant | 16, 17, 19, 20, 24, 25, 28, 30, 31, 32, 33, 34, 35, 36, 39, 40, 42, 45, 46, 48, 50, 52, 58, 60, 61, 62, 63, 69, 70, 72, 77, 82, 83, 85, 89, 92, 97, 98, 104, 120, 124, 126, 132, 138, 141, 148, 151, 153, 161, 166, 179, 186, 188, 191, 192, 193, 194, 196, 226, 249 | No statistically significant T-values | No statistically significant T-values |
| Table 10 Coronavirus Effect In Germany |
||
|---|---|---|
| Month | No. of Working days | No. of days when the during Covid-19 return was statistically significant from pre Covid-19 return |
| February | 20 | Four |
| March | 22 | 12 |
| April | 20 | 10 |
| May | 20 | Six |
| June | 21 | Seven |
| July | 23 | Three |
| August | 21 | Three |
| September | 22 | Five |
| October | 22 | Three |
| November | 21 | Five |
| December | 20 | One |
| January | 20 | One |
Findings
1. There were 59 statistically significant days of high volatility during the peak coronavirus effect period in France and no statistically significant days after the peak coronavirus effect period.
2. There were 80 statistically significant days of high volatility during the peak coronavirus effect period in Britain and no statistically significant days after the peak coronavirus effect period.
3. There were 37 statistically significant days of high volatility during the peak coronavirus effect period in India and no statistically significant days after the peak coronavirus effect period.
4. There were 60 statistically significant days of high volatility during the peak coronavirus effect period in Japan and one statistically significant days after the peak coronavirus effect period.
5. There were 49 statistically significant days of high volatility during the peak coronavirus effect period in France and no statistically significant days after the peak coronavirus effect period.
Research Limitations
The effectiveness of sample sizes taken for the study can be questioned, also, usually event studies are only conducted for the first five-seven days after the event, taking the whole period could average out the results, lastly, only the first wave is analyzed and analysis of other waves could help better understand the situation. The importance of the study, however, remains, as this study analyzes the impact of coronavirus on Eurasian nations.
Conclusion
It has been found that France, Britain, India, Japan, and Germany all faced high volatility during the peak coronavirus effect period and insignificant volatility post that. The reasons for the same could include loosened government restrictions, fiscal policy and monetary policy being implemented, vaccine expectations, economic recovery beliefs, and rise in tech stocks. Only Japan possessed significant volatility in the post period, however, even that was only for a single day, which was the last day of the event window.
Appendix
Cac 40 (French Benchmark Index) During Peak Covid-19 Effect In France
Ftse 100 (British Benchmark Index) During Peak Covid-19 Effect In Britain
Nifty 50 (Indian Benchmark Index) During Peak Covid-19 Effect In India
Nikkei 225 (Japanese Benchmark Index) During Peak Covid-19 Effect In Japan
Dax (German Benchmark Index) During Peak Covid-19 Effect In Germany
References
Anderson, J., Tagliapietra, S., & Wolff, G. (2020). (Rep.). Bruegel. Retrieved from http://www.jstor.org/stable/resrep28618
Arellano, C., Bai, Y., & Mihalache, G.P. (2020). Deadly debt crises: COVID-19 in emerging markets (No. w27275). National Bureau of Economic Research.
Asgari, N. (Ed.). (2021). COVID-19 Health System Response Monitor: JAPAN. World Health Organization. Retrieved from http://www.jstor.org/stable/resrep27945.9
Baker, S. R., Bloom, N., Davis, S. J., Kost, K. J., Sammon, M. C., & Viratyosin, T. (2020). The unprecedented stock market impact of COVID-19. National Bureau of economic research.
Indexed at, Google Scholar, Cross Ref
Bhatia, G., Dutta, P. K., & McClure, J. (2021). COVID-19: the latest global statistics, charts and maps. Reuters.
Billon-Galland, A. (2020). (Rep.). NATO Defense College. Retrieved from http://www.jstor.org/stable/resrep26865.
Bloom, N., Bunn, P., Mizen, P., Smietanka, P., & Thwaites, G. (2020). The impact of COVID-19 on productivity. National Bureau of Economic Research.
Cimmino, J., Kroenig, M., & Pavel, B. (2020). (Rep.). Atlantic Council. Retrieved from http://www.jstor.org/stable/resrep24633
Corke, S. (2020). (Rep.). IstitutoAffariInternazionali (IAI). Retrieved from http://www.jstor.org/stable/resrep27583
COVID-19: the EU's response to the economic fallout. Consilium. (2021). https://www.consilium.europa.eu/en/policies/coronavirus/covid-19-economy/.
Cox, J., Greenwald, D. L., & Ludvigson, S. C. (2020). What explains the COVID-19 stock market? (No. w27784). National Bureau of Economic Research.
Indexed at, Google Scholar, Cross Ref
Feely, G., & Jennings, P. (2020). After COVID-19: volume 3. Australian Strategic Policy Institute.
Gilchrist, S., & Zakrajšek, E. (2013). The impact of the Federal Reserve's large?scale asset purchase programs on corporate credit risk. Journal of Money, Credit and Banking, 45(s2), 29-57.
Indexed at, Google Scholar, Cross Ref
Gilchrist, S., Wei, B., Yue, V. Z., & Zakrajšek, E. (2020). The Fed takes on corporate credit risk: An analysis of the efficacy of the SMCCF (No. w27809). National Bureau of Economic Research.
GOH, E. (2020). (Rep.). S. Rajaratnam School of International Studies. Retrieved from http://www.jstor.org/stable/resrep25386.
Gourinchas, P. O., Kalemli-Özcan, ?., Penciakova, V., & Sander, N. (2020). Covid-19 and SME failures (No. w27877). National Bureau of Economic Research.
Hackenbroich, J., Shapiro, J., & Varma, T. (2020). (Rep.). European Council on Foreign Relations. Retrieved from http://www.jstor.org/stable/resrep25376
India's spending on Covid-19 tests crosses Rs 100 crore. The Economic Times. (n.d.). https://economictimes.indiatimes.com/news/politics-and-nation/indias-spending-on-tests-crosses-100-cr/articleshow/75259416.cms?from=mdr.
Rebucci, A., Hartley, J. S., & Jiménez, D. (2022). An event study of COVID-19 central bank quantitative easing in advanced and emerging economies. In Essays in Honor of M. Hashem Pesaran: Prediction and Macro Modeling. Emerald Publishing Limited.
Rizzotti, D., & Nicosia, A. (2014). Italian Stock Market Reaction to Announcements of Private Equity Investments. The Journal of Private Equity, 17(2), 60-68.
Indexed at, Google Scholar, Cross Ref
Roy, A. (2020).The pandemic is a portal. Financial Times, 3(4).
Schwert, G. W. (1989). Stock Volatility and the Crash of '87. NBER. https://www.nber.org/papers/w2954.
World Health Organization. (2020). Global Spending on Health: Weathering the storm .World Health Organization. Retrieved from http://www.jstor.org/stable/resrep30130.9.
Received: 12-Jun-2022, Manuscript No. AAFSJ-22-11698; Editor assigned: 14-Jun-2022, PreQC No. AAFSJ-22-11698(PQ); Reviewed: 28-Jun-2022, QC No. AAFSJ-22-11698; Revised: 30-Jul-2022, Manuscript No. AAFSJ-22-11698(R); Published: 06-Aug-2022