Research Article: 2022 Vol: 26 Issue: 3S
Identifying Systemically Important Cryptocurrencies: Evidence from Aparch-Fdcc and Delta Covar
Jules Clement Mba, University of Johannesburg
Citation Information: Mba, J.C. (2022). Identifying systemically important cryptocurrencies: evidence from aparch-fdcc and delta covar. Academy of Accounting and Financial Studies Journal, 26(S3), 1-13.
Abstract
The events leading to the recent financial crisis caused by the Covid-19 pandemic have under- lined the importance of financial contagion. This paper studies the connectedness among top ten cryptocurrencies by market capitalization using a combination of econometric tools which include, APARCH(1,0)-FDCC(1,1) framework to assess systemic risk with Systemic Expected Shortfall (SES) and Delta Conditional Value-at-Risk (Delta CoVaR) risk measures. The study uses contin- uously compounded daily data ranging from November 2017- January 2021. The empirical finding provide strong evidence of systemic risk during the in-sample period under review, with Bitcoin and Ethereum ranking the highest of the systemically important cryptocurrencies. This study is important for both investors to improve portfolio optimization strategies and also help regulatory authorities implement effective policy framework for monitoring the systematic risks of cryptocur- rencies.
Keywords
Cryptocurrency, Systemic Risk, APARCH, FDCC, CoVaR, SES.
Introduction
Over the last decade, the literature on the stylized facts and econometric behavior of crypto currency returns has been analyzed in several research papers. However, the events leading to the recent financial crisis caused by the Covid-19 pandemic have underlined the importance of financial contagion and in particular addressing systemic risk of a financial system. Taking into consideration the recent turbulent market volatility, an important question discuss, to what extent this pandemic has affected inter-dependencies among the cryptocurrency returns. The question is important for both investors and policy makers to understand the extent of systemic risk, and portfolio diversification.
Research into financial markets systemic risk is still in infancy and Kaufman & Scott (2003) and Scott & Shultz (2013)) and many others argue that there is no general consensus on the exact definition of systemic risk. The financial system is not deterministic and systemic risk describes an event that can trigger a major disruption or collapse of capital flows in a specific market industry or the broader economy. Despite the large volume of recent articles on the topic of systemic risk, there has been little attention paid to systemic risk in cryptocurrency markets.
Fouque & Langsam (2013) describes the financial system as a system in which the interaction of markets with humans, their emotions, politics and responses to incentives play a critical role. The system does not recognize national boundaries, for example events in one country/market can impact other countries/markets across the continent
A number of methodological approaches to measure systemic risk have been proposed in the literature that aim at the identification of systemically important financial institutions (SIFIs). The term SIFIs was first coined by Tarullo and defines “Financial institutions are systemically important if the failure of the firm to meet its obligations to creditors and customers would have significant adverse consequences for the financial system and the broader economy”. The SIFI concept assess the riskiness of financial institutions on the entire financial system, see for example Benoit et al. (2011) for a complete survey of available methods.
Adrian & Brunnermeier (2016) seminal paper introduced the Conditional Value-at-Risk (CoVaR) sys- temic risk measure which postulates the idea of capturing the Value-at-Risk (VaR) of the financial system under normal operating conditions against the VaR of the system conditional on the fact that a given institution or asset in a portfolio is under distress whereas, in a different setting, Acharya et al. (2012) introduced the concept of Systemic Expected Shortfall (SES) in terms of the Marginal Expected Shortfall(MES), which focuses on the average return of each firm during the 5% worst days for the market.
Another standard risk measure is systemic risk measure (SRISK) first proposed by (Acharya et al., 2012). It is a variant of the systemic expected shortfall (SES) of Acharya et al. (2017) and was originally developed by Brownlees & Engle (2017) building upon the idea of (Pedersen et al., 2010; Acharya et al., 2012). Other methods include the use of network analysis introduced by Billio et al. (2012) and Cont et al., (2010) which applies directly on the structure and the degree and extent of relationships between financial institutions in the market.
The cryptocurrency (or Cryptoassets or Cryptos) market is a decentralized financial system developed on Block-chain technology that arose as digital currency. Bitcoin (BTC) is the most famous and earliest cryptocurrency, which was originally introduced in a paper by (Nakamoto, 2019). These currencies have captivated, academics, policymakers, and the entire financial investment community (Yousaf & Ali, 2020; Böhme et al., 2015). The crypto currency represent a complex financial system in the field of financial economics with a market capitalization of USD 1.044 trillion consisting of total of 8, 380 cryptocurrencies in circulation and only 3, 999 actively traded. Bitcoin (BTC) and Ethereum (ETH) have a market dominance of 61.974%c and 16.171% respectively.
The Covid-19 financial crisis has negatively impacted the prospective role of cryptocurrencies as di- versifying investments see, Umar & Gubareva (2020) and references therein. We investigate the impact of individual currencies on the overall market performance and its contribution to the systemic risk. Therefore, it is important to analyze the behavior of cryptocurrencies to assess the degree of systemic risk in the during the periods of global financial crisis, such as Covid-19 pandemic market turbulence.
In recent empirical research, Conditional Value-at-Risk (CoVaR) has been applied to investigate systemic risk (risk spillover) among different financial markets including among others, exchange rates markets, crude oil market, BRICS markets and sovereign debt markets, (Ji et al., 2019; Reboredo & Ugolini, 2015; Reboredo et al., 2016; Girardi & Ergün, 2013; Benoit et al., 2011). Within the crypto market, Borri (2019) uses CoVaR to estimate the conditional tail- risk in the markets for bitcoin, ether, ripple and litecoin and find that these cryptocurrencies are highly exposed to tail-risk within cryptomarkets. Ji et al. (2020) examine connectedness via return and volatility spillovers across six large cryptocurrencies. Using the spillover index approach and its variants, Yi et al. (2018) examine both static and dynamic volatility connectedness among eight typical crypto currencies.
A number of authors have examined return and volatility transmission among cryptocurrencies during the Covid-19 pandemic. Umar & Gubareva (2020) use a non-linear Autoregressive Distributed Lag (ARDL) framework, to investigate the hedging effectiveness Bitcoins for equities. Their result show that cryptocurrency does not significantly affect stock market. In the most recent publication, Iqbal et al. (2021) study the impact of Covid-19 outbreak on the top 10 cryptocurrencies’ returns using a Quantile-on-Quantile Regression (QQR) approach and find the majority of the cryptocurrencies performed better against small shocks of COVID-19.
Others like a study by Aslanidis et al. (2021) investigate the dynamic market linkages among cryptocurrencies and find an increase in market linkages for both returns and volatili- ties. They use Principal Component Analysis (PCA) to obtain pair-wise cross-sectional correlations of the cryptocurrencies. Bouri et al. (2021) study investor sentiment and volatil- ity connectedness involving fifteen major cryptocurrencies using a dynamic conditional correlation- generalized autoregressive conditional heteroscedasticity (DCC-GARCH) model. Whereas, Wajdi et al. (2020) based on VAR, GJR-GARCH and DCC-GJR-GARCH models investigate the presence of contagion effect among cryptocurrencies to capture spillover dynamics. Their empirical analysis shows a dynamic conditional correlation between Bitcoin and other cryptocurrencies returns and a dynamic spillover effect.
The currencies safe haven properties is investigated by Conlon et al. (2020) and they find evidence pointing against Bitcoin and Ethereum not to be safe haven for a number of equity markets. A similar study was done by Mariana et al. (2021) using Dynamic Conditional Correlation (DCC) and corrected-DCC (cDCC) proposed by Aielli (2013), and they find Bitcoin and Ethereum show desirable short-term safe-haven properties. Aziz et al. (2019) provide a survey of advanced multivariate econometric models, which forecast the mean and variance-covariance of the asset returns for optimal asset allocation models.
Contrary to what others have done, this study fills the gap by contributing to the existing literature in two subtle ways. First, we employ a traditional Autoregressive conditional (AR) mean process to model returns dynamics and then use the Asymmetric Power Autoregressive Conditional Heteroskedasticity process (APARCH) proposed by (Ding et al., 1993). The model accounts for stylized facts such as volatility clustering, long memory property of returns, asymmetry and leverage effects. Our approach differs from most GARCH models used in the empirical study of cryptocurrencies models which focus on squared return as the innovation to volatility. APARCH models use absolute returns which show more persistence than squared returns. Forsberg & Ghysels (2007) analyze the benefits of using absolute returns instead.
Furthermore, to study the effect of crytpo market return interdependency, a Flexible Dynamic Component Correlations (FDCC) model is outlined. In contrast to other multivariate GARCH type models
Which have been used in the literature, Billio et al. (2006) and Billio & Caporin (2009) introduced the FDCC is a multivariate GARCH model to generalize the Dynamic Conditional Correlation (DCC) multivariate GARCH model proposed by (Engle, 2002). The FDCC model relaxes the restrictive assumption of having common dynamics driving all assets as in the DCC model. In reality, we cannot enforce that the correlation dynamics of high cap cryptocurrencies are the same as those of medium or low cap currencies. In our model framework, the FDCC the dynamics are constrained to be equal among two groups of high cap and medium cap random variables. Failure to account for this flexible dynamical correlation could lead to underestimating or overestimating the dynamical correlations.
In our second contribution, we combine the market capitalization and the variance-covariances estimates to investigate evidence of systemic risk using two risk measures, the Marginal Expected Shortfall (MES) and Delta Conditional Value-at-Risk (Delta-CoVaR) and rank the systemically important financial currencies (SIFCs).
The main findings of this empirical study indicate that the long-run behavior in dynamical conditional market return correlations among the top cryptocurrencies have increased. This has resulted in the increased systemic risk with Bitcoin and Ethereun ranking the highest systemic risk contributors.
The remainder of this paper is organized as follows: Section 2, provides the econometric methodology to measure systemic risk, Section 3 describes the dataset and some descriptive statistics, Section 4 presents the empirical results from the proposed models, while the last Section 5 presents the concluding remarks and identifies the shortcomings and future implications of the study.
Methodological Framework
This methodology section consists of three subsections: In the first section we explain the CoVaR and Delta CoVaR model framework for the asset returns, then in the second subsection, we formulate the APARCH(1,1) process for the distribution of marginals and volatility process, and in the third subsection, we bring together all components to formulate a multivariate GARCH with a Flexible Dynamic Conditional Correlation (FDCC(1,1)) model which accounts for the dynamical correlation structure in the returns.
Specification of a Measure of Systemic Risk
We consider system composed of d random vector of cryptocurrencies and denote rit the return of cryptocurrency i at time t. Similarly, let 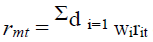 denote the aggregate value of market returns in the system at time t, where wit denotes the relative market capitalization of cryptocurrency1 i. The CoVaR with a confidence level α, corresponds to the α%-VaR quantile of the market returns obtained conditionally on the financial stress of cryptocurrency i such that,

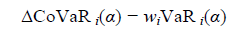
Where each individual LSFI conditional expected value is VaR it = μit + σitFi−1(α). Following Adrian & Brunnermeier (2016), we consider a situation in which the loss is exactly equal to its VaR. Thus, ΔCoVaR α is then defined as the difference between the VaR of the financial system conditional on the distress of a particular cryptocurrency i and the VaR of the financial system conditional on the median state of the cryptocurrency i.

In the case when (rmt, rit) is a bivariate normal distribution, then (rmt|rit) is normally distributed and it is straightforward to derive closed-form expressions for ΔCoVaR. To be able to obtain time- varying estimates of VaRit(α) and CoVaRit(α) for the quantile-based systemic risk measures, we adopt a multi-dimensional process, where rt is a vector (rmt, rit)?? and Ht is a time-varying conditional vari- ance–covariance matrix.
rt = qHtzt (3)
where the random vector zt=(?mt, rit) is i.i.d: and the first and second moments are E = 0 and E(zt, zt??=I2) a two-by-two identity matrix. The conditional covariance matrix for a bivariate model (n=2) is then given,
where σit and σit denote the conditional standard deviations and ρit the conditional correlation. The daily conditional volatility for each asset are estimated using APARCH(1,1) model, while the daily conditional correlation (ρit) is estimated using the APARCH(1,1)-FDCC(1,1) model and is assumed to capture the dependence structure between the cryptocurrency and the market
Specification of Marginals With Univariate APARCH (1,1) Process
We assume that the marginals rit have a time-varying mean (μit) and variance (σ2it ), which follow a asymmetric power ARCH (1,1) process2 proposed by Ding & Granger (1996). The model is flexible and does not assume that the conditional variance is a linear function of lagged squared returns. Let rt = (r1t, · · · , rdt) denote a d-dimensional vector of returns. Then, an AR(1)-APARCH(1,1) process can be written as follows:
where μit is the expected return and at is a zero-mean white noise, ω>0, α ≥ 0, β ≥ 0, δ > 0 and −1<γ<1. α and β are the ARCH and GARCH coefficients respectively, the parameter δ plays the role of a Box-Cox transformation of the conditional standard deviation σt. The parameter γ captures the leverage effect of the returns, and a positive (negative) value of the γ coefficient means that past negative (positive) return has a stronger effect on current volatility than past positive (negative) return. For the stable APARCH(1,1) model, the stationarity condition for the variance is given by α(1−γ)δ+β<1 and can be seen as a measure of the persistence in the volatility model.
In order to account for excess kurtosis (fat tails) of the underlying APARCH process, we assume that the innovations follow a standard Student t-distribution with, εit ~ tνi , with νi d.o.f, zero and variance νi/(νi−2) see, Bollerslev(1987). The density function is given by,
where the degrees of freedom ν>2 and  is the gamma function. The Student t is symmetric around a mean of zero. For ν>4 the conditional kurtosis is 3(ν − 2)(ν − 4)−1 which exceeds the normal value of 3 and as ν→∞ the distribution converges the normal distribution. The conditional distribution function for each marginal series is F
Specification of Time-Varying FDCC (1,1) process
This section builds from the results in section (2.2). In order to investigate evidence of market contagion among asset returns, we focus on joint dynamic correlations structure of asset returns. Let, rt denote the d×1 time-series vector consisting of d series of log-returns at time t, conditional on Ωt−1, the information set available at time (t − 1). We assume that, ait = rit − μit is the mean-corrected log-return
In the following specification, the d conditional variances follow a univariate ait ~APARCH(1,1) pro- cess specified in equation (6). The notation, Rt=ρij where ρii=1 will denote the d × d time-varying correlation matrix, and Dt the d × d time-varying diagonal matrix, with the conditional standard devia- tions elements Dt=diag (√h11t, · · · , √hddt) obtained from univariate APARCH(1,1) process {at}. The seminal dynamic flexible conditional correlation (FDCC) covariance structure in the Gaussian case can be first be represented as follows:
where the symbol ? is the Hadamard product (element-wise matrix multiplication), Ht is the conditional covariance matrix3,4 with off-diagonal elements, ρijhithjt. [Qt]ij =(qijt) is the d×d symmetric definite matrix and describes the the evolution of the correlation in the FDCC model. The elements on its main diagonal are the conditional standard deviations of the returns on each asset5.
εt =D−1at denotes the APARCH standardized residuals, thus, the transformed stock returns by their standard deviations 5 , and the variables γ, α and β are partitioned d × 1 dimensional vectors of groups of assets,

where wi(i = 1, • • • , g) is the number of assets in the group i; and similarly for β and γ. ijw are vectors of ones with size equal to the number of elements in the market sector w.
The coefficients must satisfy these constraints, αiαj+βiβj<1 for all i, j = 1, 2, • • • , g such that g is the number of blocks or asset classes/sectors. For example, in our case the number of markets/sectors is g=2, hence the total number of parameters in the FDCC reduces to 2w. The long run correlation matrix in the FDCC is given by γγ/ ÷ (1−ααj−ββj)), where ÷ denotes element-wise division see, Aziz, Vrontos & Hasim (2019) for a survey of other dynamic correlation models. All FDCC estimations are performed in the R programming environment using the Package “rmgarch” of Ghalanos 2019.
Empirical Results and Discussion
Exploratory Data Analysis
In this section we present preliminary descriptive summary statistics for 10 major cryptocurrencies ranked by market capitalization which include: Bitcoin (BTC), Ethereum (ETH), Ripple(XRP), Car- dano(ADA), Chainlink (Link), Litecoin(LTC), Bitcoin Cash(BCH), Stella(XLM), Binance Coin(BNP), Dogecoin(DOGE). The sample data covers the period from November, 2017 to 29 January, 2021, and are downloaded from CoinMarketCap database. Due data challenges to obtain the top ten data series with the same time length, we included DOGE and XRP in list because they have a longer time series Table 1.
| Table 1 Summary Of Descriptive Statistics |
|||||||||||
|---|---|---|---|---|---|---|---|---|---|---|---|
| Bitcoin | Ethereum | Ripple | Cardano | Chain link | Litecoin | Bitcoin Cash | Stella | Binance Coin | Dogecoin | ||
| Mean | 0.139 | 0.129 | 0.027 | 0.216 | 0.407 | 0.07 | 0.077 | 0.187 | 0.269 | 0.315 | |
| Min | 43.4 | 56.3 | 55 | 52.4 | 66.2 | 47.1 | 58 | 43.9 | 57.1 | 40.1 | |
| Max | 28.7 | 26.3 | 59.3 | 87.2 | 47.9 | 38.4 | 39 | 55.5 | 75.6 | 148 | |
| SD | 4.21 | 5.31 | 6.45 | 7.15 | 7.63 | 5.72 | 6.75 | 6.64 | 6.62 | 7.69 | |
| Ann.SD | 66.6 | 84 | 102.000 113.000 | 121 | 90.4 | 107 | 105 | 105 | 122 | ||
| Skewness 13.100 | 12.7 | 19.4 | 28.1 | 8.55 | 8.89 | 9.34 | 11.2 | 29 | 123 | ||
| Kurtosis | 0.831 | 1.14 | 0.937 | 2.19 | 0.133 | 0.16 | 0.193 | 1.18 | 0.814 | 7.01 | |
| JB | 8,617 | 8,159 | 18,740 | 39,855 | 3,604 | 3,900 | 4,303 | 6,465 | 41,557 | 7,52,888 | |
| Q(10) | 17.1 | 21 | 36.7 | 47.5 | 14.5 | 17.9 | 6.13 | 21.2 | 24 | 12.9 | |
| Q2(10) | 27 | 27.8 | 145 | 76.8 | 35.2 | 103 | 47.2 | 97.8 | 178 | 5.86 | |
| ACF | 0.069 | 0.09 | 0.169 | 0.139 | 0.121 | 0.23 | 0.137 | 0.166 | 0.353 | 0.07 | |
| Spearman Correlation Matrix | |||||||||||
| btc | 1 | 0.765 | 0.662 | 0.683 | 0.497 | 0.767 | 0.713 | 0.64 | 0.627 | 0.65 | |
| eth | 0.765 | 1 | 0.771 | 0.779 | 0.576 | 0.811 | 0.79 | 0.697 | 0.635 | 0.621 | |
| xrp | 0.662 | 0.771 | 1 | 0.746 | 0.508 | 0.728 | 0.675 | 0.748 | 0.557 | 0.612 | |
| ada | 0.683 | 0.779 | 0.746 | 1 | 0.555 | 0.746 | 0.691 | 0.773 | 0.604 | 0.607 | |
| link | 0.497 | 0.576 | 0.508 | 0.555 | 1 | 0.509 | 0.495 | 0.537 | 0.489 | 0.443 | |
| ltc | 0.767 | 0.811 | 0.728 | 0.746 | 0.509 | 1 | 0.775 | 0.671 | 0.631 | 0.641 | |
| bch | 0.713 | 0.79 | 0.675 | 0.691 | 0.495 | 0.775 | 1 | 0.614 | 0.577 | 0.591 | |
| xlm | 0.64 | 0.697 | 0.748 | 0.773 | 0.537 | 0.671 | 0.614 | 1 | 0.555 | 0.586 | |
| bnp | 0.627 | 0.635 | 0.557 | 0.604 | 0.489 | 0.631 | 0.577 | 0.555 | 1 | 0.508 | |
| doge | 0.65 | 0.621 | 0.612 | 0.607 | 0.443 | 0.641 | 0.591 | 0.586 | 0.508 | 1 | |
We note that all four moments (mean, variance, skewness and kurtosis) show significant variation. The skewness is negative, which means that returns are negatively skewed, an indication of lack of symmetry in the underlying data distribution. This is evidence of a higher probability of losses in the lower tails during markets downturn (bear markets). We also observe a strong positive peaked distribution characterized by a Kurtosis >3, an indication of heavy tailed distribution than a normal distribution, which is a measure of risk during the periods of high volatility. The corresponding linear based Pearson correlation matrix highlights a strong currency dependence. Our modelling strategy aims to account for the observed asymmetry in the data using a Student-t distribution for the volatility innovations and a FDCC modelling framework for the time-varying correlations.
Figure 1 shows combined plots for log-prices and currency returns. Evidence from the plots highlights volatility clustering, an indication of heavy-tailed distributions. Preliminary diagnostics tests using Ljung–Box Q statistic under the null hypothesis of no serial correlation is rejected for correlation coef- ficients in the return series up to lag 10, an indication of linear dependence. Similarly, Ljung–Box Q test for squared returns provides evidence serial correlation, which affirms the presence of time-varying volatility in the return series. The ARCH test of McLeod & Li (1983) yields similar results where the null hypothesis for conditional homoscedasticity is strongly rejected.

Figure 1: Log Prices And Log-Returns Plots From 14 January, 2018 To 29 Jan 2021.
Estimating Volatility and Correlations with APARCH-FDCC (1,1) process
In this section we begin by fitting a Flexible Dynamic Conditional Correlation, AR(1)-APARCH- FDCC(1,1) model. The currencies are divided into two groups, one representing high cap (BTC,ETH, XRP and ADA) with a combined market capitalization of (USD729.56bn) and the other representing medium cap (LINK, LTC,BCH, XLM, BNP, DOGE) with a total market capitalization of (USD35.82). We argue that the dynamical behavior of time-varying conditional correlations of the two groups are different and should therefore be accounted for appropriately1. Based on the results in Table 2 we learn that the parameter estimates for both the univariate APARCH(1,1) process and the multivariate FDCC(1,1) process, are statistically significant at 5% level. There is strong evidence to suggest that the dynamical correlation coefficients within the two groups are driven by different correlation parameters. These results remove the bias in the DCC model framework and allows for equal correlation dynamics between groups of currencies, providing a flexible parameterization of correlation dynamics. The es- timated pair-wise correlation between currencies will be used as input to test systemically important currencies.
| Table 2 Estimates Of Marginal Expected Shortfall | |||||||||||
|---|---|---|---|---|---|---|---|---|---|---|---|
| $bn | (%) | $bn | (%) | $bn | α0.05 | α0.5 | Loss Beta(bps) Coin | ? Loss | Beta(bps) | Coin | |
| Asset | wi | VaR α | VaR α | MES | SES | CoVaR 0.05 | CoVaR 0.5 | ?CoVaR α | ?(L) | β(w) | Ranki |
| BTC | 566.7 | 11.6 | 65.6 | 14.2 | 80.6 | 103 | 17.5 | 85.5 | 19.9 | 184.7 | 1 |
| ETH | 141.8 | 14.6 | 20.7 | 15.2 | 21.6 | 120.9 | 48.2 | 72.8 | 52.1 | 157.1 | 3 |
| XRP | 11.4 | 13 | 1.5 | 9.1 | 1 | 121.1 | 72.5 | 48.6 | 47.1 | 104.9 | 9 |
| ADA | 9.7 | 13.7 | 1.3 | 12.6 | 1.2 | 123.3 | 59.2 | 64.1 | 62.8 | 138.5 | 4 |
| Link | 8.4 | 16.2 | 1.4 | 12.3 | 1 | 122.3 | 69.5 | 52.7 | 51.4 | 113.9 | 8 |
| LTC | 8.2 | 11.7 | 1 | 12.7 | 1 | 119.2 | 43.7 | 75.5 | 74.6 | 163.1 | 2 |
| BCH | 7 | 17.2 | 1.2 | 15.4 | 1.1 | 123.4 | 61 | 62.4 | 61.2 | 134.8 | 5 |
| XLM | 5.3 | 16.8 | 0.9 | 13 | 0.7 | 122.6 | 68.4 | 54.1 | 53.2 | 116.9 | 7 |
| BNP | 6 | 7.3 | 0.4 | 6.5 | 0.4 | 123.4 | 62.2 | 61.2 | 60.8 | 132.3 | 6 |
| DOGE | 0.9 | 149 | 1.4 | 80.3 | 0.8 | 116.3 | 78.8 | 37.5 | 36.1 | 81 | 10 |
| 765.4 | 95.4 | 191.3 | 109.4 | 1195.5 | 581 | 614.4 | 519.2 | ||||
The Implications For Investment Portfolios
Table 2 indicates a snapshot of the current time varying estimates of marginal expected shortfall(MES), systemic expected shortfall (SES) and delta CoVaR for a system composed of top ten cryptocurrencies with a total market capitalization of (USD 765.38bn). We infer that the systemic expected shortfall (SES) 95% of the entire system currently stands at total of (USD 109.44bn) whereas, the delta CoVaR totals (USD 614.47).
As observed, the ΔCoVaR, can be used to rank the relative systemic risk in decreasing order of all cryptocurrencies according to the less risky currency to the highest risk currency as follows: Bitcoin 1
> Litecoin 2>Ethereum 3>Cardano 4>Bitcoin Cash 5 >Binance Coin 6 >Stella 7 >Chainlink 8 >Ripple 9 >Dogecoin 10.
The corresponding Figure 2 shows trajectory of in-sample estimates of ΔCoVaR t(α) where, the period ranging from the beginning of November 2017 up to mid February 2018 is characterized by higher systemic risk. This is followed by a tranquil period from end of February 2018 up to mid of November 20120 which is characterized by relatively lower systemic risk. However, from beginning of December 2020 up until recently in January 2021, is characterized by higher systemic risk (Bollerslev & Mikkelsen, 1996).

Figure 2:Delta Covar Plots From 10 November, 2017 To 29 Jan 2021.
Furthermore, the results draw attention to important information on the estimated 95% CoVaR measure. For example, if Bitcon (BTC) suffers a loss larger than its 95% value-at-risk (USD 65.6bn), it induces a Delta CoVaR of (ΔCoVaR=85.5 bn). This systemic loss includes the initial loss of Bitcoin, but also additional losses of the other nine cryptocurrencies due to their relative dependence structure. The dependence structure between cryptocurrencies plays a significant role in estimating the CoVaR measure. If we define systemic risk as the additional loss on the other components of the cryptocurrency system by
We find that the stress on Litecoin (LTC) currently induces the largest loss (USD74.6bn) on the other cryptocurrencies in the portfolio.
1. For example, the system in our case is defined as the set of 10 largest cryptocurrencies and wi is the size of cryp to currencies i measured by the market capitalization
2. It includes seven ARCH models as special cases (ARCH, GARCH, AGARCH, GJR, TARCH, NARCH and Log- ARCH)
3. The square root of Ht1/2 has to be understood in the sense of the Cholesky factorization, that t is Ht1/2H1/2 = Ht
4. Ht is a positive definite matrix of conditional variances of rt at time t
5. Where the random variable, εit is then used to estimate the parameters of the conditional correlation
The recent financial crisis caused by the COVID-19 pandemic has raised responsiveness of regulators, and investors to measuring systemic risk in financial markets. While Value-at-Risk (VaR) and Expected shortfall (ES) are the most common-approaches to measuring measure risk, they have been criticized for falling short to quantifying systemic risk contribution of financial assets in a portfolio. The marginal expected shortfall (MES) has been criticized because it measures the systematic risk of financial institution/assets, and not necessarily its systemic risk.
Conclusion
This study contributes to the existing literature on cryptocurrencies in a number of subtle ways. First, the empirical study focused on investigating spillover effects and systemic risk among a set of top ten cryptocurrencies by market capitalization using a combination of econometrics methods which include, autoregressive AR(1) approaches combined with APARCH (1,1) and a novel flexible Dynamic Condi- tional Correlation (FDCC).
We find strong evidence of systemic risk spillover, where we identified periods characterized by a “tranquil market” with low systemic risk and another characterized by “turbulent market” with high systemic risk. Our findings highlight motivating results with significant policy implications and complement the conclusions found in previous literature. We argue that, Bitcoin(BTC), Ethereum (ETH) market have a strong influence on other markets performance. This means other global market cryptocurrencies share the same sources of systematic risks.
In addition, the estimates of ΔCoVaR for four high cap and six medium cap currencies markets shows that the time-varying correlation of the APARCH-FDCC model provides important information about the dependence structure in these markets and the strength of systemic risk. The study has some limitations mainly on the narrow scope of the empirical research. The study only focuses on in-sample tests on a selected cryptoassets. We therefore suggest incorporating more currencies and conduct out- sample tests in order be draw robust econometric inferences. Furthermore, future direction of research could be extended in countless, such as copula models combined with a long memory volatility model such as the FIGARCH model of (Baillie et al., 1996). Our study is important in many ways and can be used by various international investor’s and policymakers to help diversify international asset portfolios and drive regulatory and policy recommendations during crises periods.
References
Acharya, V., Engle, R., & Richardson, M. (2012). Capital shortfall: A new approach to ranking and regulating systemic risks. American Economic Review, 102(3), 59-64.
Index at, Google Scholar, Cross Ref
Acharya, V.V., Pedersen, L.H., Philippon, T., & Richardson, M. (2017). Measuring systemic risk. The Review of Financial Studies, 30(1), 2-47.
Index at, Google Scholar, Cross Ref
Adrian, T. & Brunnermeier, M.K. (2016), ‘Covar’, American Economic Review 106(7), 1705–41.
Index at, Google Scholar, Cross Ref
Aielli, G.P. (2013). Dynamic conditional correlation: on properties and estimation. Journal of Business & Economic Statistics, 31(3), 282-299.
Index at, Google Scholar, Cross Ref
Aslanidis, N., Bariviera, A.F., & Perez-Laborda, A. (2021). Are cryptocurrencies becoming more interconnected?. Economics Letters, 199, 109725.
Index at, Google Scholar, Cross Ref
Aziz, N.S.A., Vrontos, S., & Hasim, H.M. (2019). Evaluation of multivariate GARCH models in an optimal asset allocation framework. The North American Journal of Economics and Finance, 47, 568-596.
Index at, Google Scholar, Cross Ref
Baillie, R.T., Bollerslev, T., & Mikkelsen, H.O. (1996). Fractionally integrated generalized autoregressive conditional heteroskedasticity. Journal of Econometrics, 74(1), 3-30.
Index at, Google Scholar, Cross Ref
Benoit, S., Colletaz, G., & Hurlin, C. (2011). A theoretical and empirical comparison of systemic risk measures: Mes versus covar. SSRN Electronic Journal.
Billio, M., & Caporin, M. (2009). A generalized dynamic conditional correlation model for portfolio risk evaluation. Mathematics and Computers in Simulation, 79(8), 2566-2578.
Index at, Google Scholar, Cross Ref
Billio, M., Caporin, M., & Gobbo, M. (2006). Flexible dynamic conditional correlation multivariate garch models for asset allocation. Applied Financial Economics Letters, 2(02), 123-130.
Index at, Google Scholar, Cross Ref
Billio, M., Getmansky, M., Lo, A.W., & Pelizzon, L. (2012). Econometric measures of connectedness and systemic risk in the finance and insurance sectors. Journal of Financial Economics, 104(3), 535-559.
Index at, Google Scholar, Cross Ref
Böhme, R., Christin, N., Edelman, B., & Moore, T. (2015). Bitcoin: Economics, technology, and governance. Journal of Economic Perspectives, 29(2), 213-38.
Index at, Google Scholar, Cross Ref
Bollerslev, T. (1987). A conditionally heteroskedastic time series model for speculative prices and rates of return. The Review of Economics and Statistics, 542-547.
Borri, N. (2019). Conditional tail-risk in cryptocurrency markets. Journal of Empirical Finance, 50, 1-19.
Index at, Google Scholar, Cross Ref
Bouri, E., Gabauer, D., Gupta, R., & Tiwari, A.K. (2021). Volatility connectedness of major cryptocurrencies: The role of investor happiness. Journal of Behavioral and Experimental Finance, 30, 100463.
Index at, Google Scholar, Cross Ref
Brownlees, C., & Engle, R.F. (2017). SRISK: A conditional capital shortfall measure of systemic risk. The Review of Financial Studies, 30(1), 48-79.
Index at, Google Scholar, Cross Ref
Conlon, T., Corbet, S., & McGee, R. J. (2020). Are cryptocurrencies a safe haven for equity markets? An international perspective from the COVID-19 pandemic. Research in International Business and Finance, 54, 101248.
Index at, Google Scholar, Cross Ref
Cont, R., & Moussa, A. (2010). Network structure and systemic risk in banking systems. Edson Bastos e, Network Structure and Systemic Risk in Banking Systems.
Index at, Google Scholar, Cross Ref
Ding, Z., & Granger, C.W. (1996). Modeling volatility persistence of speculative returns: a new approach. Journal of Econometrics, 73(1), 185-215.
Index at, Google Scholar, Cross Ref
Ding, Z., Granger, C.W. & Engle, R.F. (1993), ‘A long memory property of stock market returns and a new model’, Journal of Empirical Finance, 1(1), 83-106.
Index at, Google Scholar, Cross Ref
Engle, R. (2002). Dynamic conditional correlation: A simple class of multivariate generalized autoregressive conditional heteroskedasticity models. Journal of Business & Economic Statistics, 20(3), 339-350.
Index at, Google Scholar, Cross Ref
Fouque, J.P., & Langsam, J.A. (Eds.). (2013). Handbook on systemic risk. Cambridge University Press.
Girardi, G., & Ergün, A.T. (2013). Systemic risk measurement: Multivariate GARCH estimation of CoVaR. Journal of Banking & Finance, 37(8), 3169-3180.
Iqbal, N., Fareed, Z., Wan, G., & Shahzad, F. (2021). Asymmetric nexus between COVID-19 outbreak in the world and cryptocurrency market. International Review of Financial Analysis, 73, 101613.
Index at, Google Scholar, Cross Ref
Ji, Q., Bouri, E., Lau, C.K.M., & Roubaud, D. (2019). Dynamic connectedness and integration in cryptocurrency markets. International Review of Financial Analysis, 63, 257-272.
Index at, Google Scholar, Cross Ref
Ji, Q., Liu, B.Y., Zhao, W.L., & Fan, Y. (2020). Modelling dynamic dependence and risk spillover between all oil price shocks and stock market returns in the BRICS. International Review of Financial Analysis, 68, 101238.
Index at, Google Scholar, Cross Ref
Kaufman, G.G., & Scott, K.E. (2003). What is systemic risk, and do bank regulators retard or contribute to it?. The Independent Review, 7(3), 371-391.
Mariana, C.D., Ekaputra, I.A., & Husodo, Z.A. (2021). Are Bitcoin and Ethereum safe-havens for stocks during the COVID-19 pandemic?. Finance research letters, 38, 101798.
Index at, Google Scholar, Cross Ref
McLeod, A.I., & Li, W.K. (1983). Diagnostic checking arma time series models using squared-residual autocorrelations, Journal of Time Series Analysis, 4(4), 269–273.
Index at, Google Scholar, Cross Ref
Nakamoto, S. (2019). Bitcoin: A peer-to-peer electronic cash system, Technical report, Manubot.
Pedersen, L.H., Acharya, V., Philippon, T., & Richardson, M. (2010). Measuring systemic risk, NYU Working Paper.
Reboredo, J.C., Rivera-Castro, M.A., & Ugolini, A. (2016). Downside and upside risk spillovers between exchange rates and stock prices. Journal of Banking & Finance, 62, 76-96.
Index at, Google Scholar, Cross Ref
Reboredo, J. C., & Ugolini, A. (2015). Systemic risk in European sovereign debt markets: A CoVaR-copula approach. Journal of International Money and Finance, 51, 214-244.
Index at, Google Scholar, Cross Ref
Scott, K.E., & Shultz, G.P. (2013). Ending government bailouts as we know them, Hoover Press.
Umar, Z., & Gubareva, M. (2020). ‘A time–frequency analysis of the impact of the covid-19 induced panic on the volatility of currency and cryptocurrency markets’, Journal of Behavioral and Experimental Finance, 28, 100404.
Index at, Google Scholar, Cross Ref
Wajdi, M., Nadia, B., & Ines, G. (2020). Asymmetric effect and dynamic relationships over the cryptocurrencies market. Computers & Security, 96, 101860.
Index at, Google Scholar, Cross Ref
Yi, S., Xu, Z., & Wang, G.J. (2018). Volatility connectedness in the cryptocurrency market: Is Bitcoin a dominant cryptocurrency?. International Review of Financial Analysis, 60, 98-114.
Index at, Google Scholar, Cross Ref
Yousaf, I., & Ali, S. (2020). The COVID-19 outbreak and high frequency information transmission between major cryptocurrencies: Evidence from the VAR-DCC-GARCH approach. Borsa Istanbul Review, 20, S1-S10.
Index at, Google Scholar, Cross Ref
Received: 24-Dec-2021, Manuscript No. AAFSJ-21-10608; Editor assigned: 27-Dec-2021, PreQC No. AAFSJ-21-10608(PQ); Reviewed: 10-Jan-2022, QC No. AAFSJ-21-10608; Revised: 18-Jan-2022, Manuscript No. AAFSJ-21-10608(R); Published: 25-Jan-2022