Research Article: 2021 Vol: 27 Issue: 5S
Impact of Accounting Fraud on Stock Price Formation before Its Discovery-The Period from the Start of Fraud to Its Discovery
Syed Raziuddin Ahmad, Department of Accounting, Faculty of Business Studies, Arab Open University
Odunayo Magret Olarewaju, Durban University of Technology
Ijaz Ali, College of Business and Management, Fahad Bin Sultan University
Asif Baig, Jubail University College, Saudi Arabia
Imran Ahmad Khan, Creative Heads Consultants
Abstract
In this paper, we examine whether investors are misled by misstatements of profits and, if so, when. We focus on the period from the start of the fraud to its discovery. The results show that when the profit benchmark is achieved by misstatement, investors notice the existence of misstatement (profit management by misstatement) and discount the stock price to a lower value, but in other cases, they do not notice the misstatement. Additional verification confirms that investors do not notice anomalies in the financial figures due to the increase in the accumulated amount of misstatements. These results show that investors cannot distinguish between misstated profits and other profits and use them directly in their decision-making in most cases except when management's motives are obvious.
Keywords
Misstatement, Profit, Investor, Fraud, Information, Correction
Introduction
Management has a responsibility to disclose information that is useful for investors' decision-making. On the other hand, management also has incentives to disclose accounting information that distorts the facts to maximize their (or their company's) profits. Auditors take these incentives into account when auditing the accounting information prepared by management. Nevertheless, a considerable number of accounting frauds are uncovered every year, and the reliability of disclosure systems and accounting audits is being questioned.
Market participants who are concerned about this situation are proceeding with a series of institutional reforms to prevent the circulation of fraudulent accounting information, but these institutional reforms seem to be based on the assumption that investors will be misled by misstatements and make mistakes in assessing stock prices. Consistent with this, many previous studies on financial corrections have reported that stock prices fall when fraud is discovered and that the larger the profit correction, the greater the decline (Desai, 2020; Gupta, 2015; Beasley et al., 2010). On the other hand, many previous studies on profit management have shown that investors may be aware of management's discretion (Marquardt & Wiedman, 2004; Christensen, 1999).
Therefore, the purpose of this paper is to examine whether investors are misled by the misstatements included in profits, and if they are misled (or not misled), for the period from the start of fraud to the period before the discovery of fraud of the companies that have corrected their securities reports after the discovery of accounting fraud.
The results show that when profit benchmarks are achieved by misstatement, investors notice the existence of misstatement (profit management by misstatement) and discount the stock price to a lower value, but in other cases, they do not notice the misstatement. This result indicates that investors do not distinguish misstated profits from other profits and use them in their decision-making, except when management's motives are clear.
The structure of this paper is as follows. Section 2 summarizes the related previous studies and confirms the position of this paper. Section 3 presents the hypotheses. Section 4 describes the sample selection method and its basic characteristics, and Section 5 describes the validation model and validation results. Then, additional verification is performed in Section 6. Section 7 is a summary of the paper, pointing out the contributions and limitations of the paper.
Previous Research
The subject of this paper is to clarify whether investors are misled by misstatements of profits (MST) and, if so, when they are (or are not) misled, for the period from the start of fraud to its discovery (ERROR period).
Kinney & McDaniel (1989) are among the earliest studies to examine the relationship between profit and stock prices, including MST, in the period before the announcement of corrections. They found that the stock price of U.S. companies that corrected their quarterly profits in the notes to their annual financial statements declined before the correction was announced and that the decline in stock price was greater for companies with deteriorating annual performance that overstated their quarterly profits. Subsequent research has been divided into two categories: those that argue that investors can predict corrections by showing stock price declines before the announcement of corrections or the disposal of shareholdings by certain investors (Bhasin, 2012; Bardos et al., 2011) and those that argue that investors are aware of MST because of the relationship between MST or accounting information including MST and stock prices (Bhasin, 2012; Dang et al., 2011).
The subject of this paper is also related to studies that look at the relationship between profit and stock prices when profit management is suspected. These studies have shown that investors use profit information in light of managerial incentives (Nwaeze, 2011; Bartov et al., 2002; Christensen et al., 1999) and that the discretionary part of the profit is discounted when managers have opportunity-based profit management incentives (Marquardt & Wiedman, 2004; Balsam et al., 2002).
Of these, the closest to the subject of this paper is the relationship between MST or accounting information including MST and stock prices, so in the following, we will take a closer look at the studies of Bhasin (2012); Bardos, et al., (2011).
A Study of Investors' Reactions to Profits, Including Misstatements (MST)
Bardos, et al., (2011) tested whether investors are misled by the MST included in profits. (2011) examined whether investors are misled by the MST included in earnings. The sample consisted of 406 companies and quarters (147 companies and quarters) for which the necessary data for verification was available among initial profit announcements by U.S. companies that announced corrections to a fiscal year or annual and quarterly profit (quarterly profit only) between January 1, 1997, and June 30, 2002. Quarterly profit corrections that are offset during the fiscal year are excluded from the validation. The databases used are GAO (2006), IBES, Lexis-Nexis and Factiva, Compustat, and CRSP. The correction announcement date, the period covered by the correction, the originally announced profit, and the corrected profit were manually compiled from SEC file materials.
The verification was done by regressing the Cumulative Abnormal Returns (CAR) for the three days before and after each profit announcement during the ERROR period on the components of profit surprises (MST and true surprises) and examining the statistical significance of the coefficients of each component and the difference between them. CAR is the weighted average CRSP return net of the market return. Profit Surprise is the difference between the initially announced profit and the analysts' forecast. Initial and corrected profits are adjusted to be the same as IBES street earnings and deflated by the end-of-period stock price. In addition, the variables used in the validation are winsorized at 1% each on the top and bottom. This test is based on a sample that includes control companies and a subsample of that sample that is divided into companies with and without annual profit corrections. The control companies are those with the closest book-to-market ratio of net assets among companies in the same industry at the beginning of the ERROR period and with similar market capitalization (70% to 130%). The MST of the control companies is zero. The results show that the coefficients of MST and true surprise are both statistically significantly positive, except for the subsample with only quarterly profit correction, and there is no statistically significant difference between them. This result indicates that investors are unable to identify the MST in profits.
They further tested the above regression equation with a variable indicating the number of quarters before the quarter in which the correction was announced and a cross term between the variable and the MST for the subsample of the above with a correction in annual profits. The validation was conducted by examining the statistical significance of the coefficients of the cross terms. The results showed that the coefficients of the cross terms were statistically significant (positive at the 10% level). This result indicates that investors place less emphasis on MST as the correction announcement approaches. Bhasin (2012) examines how surprises in each income statement presentation are incorporated into stock prices on the day of incorrect earnings announcements that are later corrected. The analysis covers 881 initial profit announcements by 612 Indian companies that announced corrections to their income statements in their annual reports and/or financial statements due to errors or frauds between May 1, 2006, and June 15, 2011. The database used is the Reuters Point-in-time financial database.
The verification was conducted by regressing the average Buy-and-Hold Abnormal Returns (BHAR) for the three days before and after the earnings announcement on the components of the surprise (MST and true surprise) and looking at the coefficients of each component and the statistical significance of the difference between them. The BHAR is the net of the return on equity of the control companies. The control companies are those with the closest book-to-market capitalization ratios among companies in the same industry and with or without TOPIX adoption and with similar market capitalization (0.7 to 1.3 times). Surprise is the difference between the company's forecast before the initial event date and the corrected value, deflated by market capitalization. This validation is based on a subsample of companies with corrections to their securities reports, divided by whether or not they include stocks designated as Securities Under Supervision. The coefficients of MST are positive and statistically significant (at the 10% level) for both subsamples, but the coefficients of true surprise are not statistically significantly different from zero. The difference between the coefficients of MST and true surprises was not statistically significantly different from zero, except that the difference was statistically significant (at the 10% level) for ordinary income in the subsample excluding stocks designated as supervisory issues. These results indicate that the MST can surprise investors to some extent.
A Study on the Stock Price Explanatory Power of Accounting Information Including Misstatements (MST)
Dang, et al., (2011) examined the value relevance of accounting information when an unqualified opinion of probable cause is issued for financial statements containing material MST (audit failure). The subjects of the study were 616 companies and years, 346 of which were subject to either SEC enforcement, corrections resulting from MST, or litigation against auditors resulting from audit failures, for fiscal years ending between 1980 and 2000. We exclude from the scope of verification those cases that relate only to the quarter, those for which the auditor is not responsible, and those other than unqualified opinions. The databases used were Accounting and Auditing Enforcement Releases, WSJI and LexisNexis Database, the database of lawsuits against auditors (Palmrose, 1999), Compustat, and CRSP.
The validation was done by regressing the stock prices of the companies with Audit Failures (AF) and their control companies (NAF) on their profit and book value of equity capital and looking at the magnitude of their respective coefficients of determination (R2). NAFs were selected from non-AFs with the same fiscal year and industry as AFs, and similar total asset size (within 10% difference), based on the auditor's reputation. The size of the R2 was determined by the range of the 83.4% confidence interval for each of the 1,000 R2s calculated from 1,000 bootstraps resamples of AF and NAF with the same AF and auditor reputation, respectively. 83.4% is the confidence interval required to test the difference between the two R2 using this method at the 5% level of significance. The stock price is three months after the closing date and the profit is before abnormal items. Profit and book value of equity capital is per share. The results show that the R2 of AF is smaller than the R2 of NAF. This result indicates that investors will notice significant MST and discount the accounting information before the audit failure is announced.
They then tested the effect of auditor reputation by controlling for it in two ways: by comparing AF with (1) NAF, whose auditor reputation is the same as that of AF, and (2) NAF, whose auditor reputation is different from that of AF. The validation results showed that the R2 of AF was smaller than the R2 of NAF in both methods. These results indicate that the auditor's reputation is not the reason why investors become aware of MST before the audit failure is announced.
Position of this Paper in Previous Studies
As mentioned above, few studies look at the relationship between MST and stock prices before the announcement of corrections. Some studies show that investors become aware of MST (Dang et al., 2011), some show that investors become aware as the announcement of corrections approaches (Bardos et al. 2011), and some show that investors are misled (Bhasin, 2012). Of these, Dang, et al., (2011) found that the decline in the value relevance of accounting information, including MST, is not due to the auditor's reputation, and Bardos, et al., (2011) found that investors place less emphasis on MST as the correction release date approaches, but none of the studies have revealed why investors notice. As for verification methods, Bardos, et al., (2011); Bhasin (2012) examine the relationship between MST and stock returns but do not examine the relationship with stock prices. Dang, et al., (2011) examine the relationship between accounting information including MST and stock prices but do not examine the relationship between MST and stock prices.
For this reason, this paper uses the profit capitalization model, which is the theoretical basis of the corporate valuation model, to examine public profits by dividing them into MST and others. By doing so, we clarify whether MST is reflected in the stock price or not, and if so, whether it is reflected in the stock price as well as the other parts. In this paper, we also examine whether investors' evaluation of MST is different when the profit benchmark is achieved by MST and when it is not, taking into account previous studies (Balsam et al., 2002; Bartov et al., 2002) that show the influence of managers' opportunity-based profit management incentives on the relationship between profit and stock price. This paper examines whether investors' evaluation of MST is different when MST achieves the profit benchmark and when it does not. This will reveal when investors are (or are not) misled by MST.
Hypothesis
In the previous section, we confirmed the position of this paper in previous studies. In this section, we construct a hypothesis based on the findings of the previous studies.
It is generally believed that investors evaluate (estimate) corporate value according to corporate valuation models such as the discounted present value of future dividends, the discounted present value of free cash flows attributable to shareholders, and the residual income model. Regardless of which model is used, information on future cash flows is an essential input for corporate valuation. If investors revise their expectations based on new information, the stock price will fluctuate. Many previous studies have shown that there is a positive correlation between stock prices and the sign and magnitude of performance changes or profits (Hayn, 1995; Beaver et al., 1979; Ball & Brown, 1968).
Given this relationship (the functional fixation hypothesis), managers can avoid the undesirable economic consequences (Kaplan et al., 1994) of weak earnings and stock prices by manipulating profits. If the manipulation deviates from the generally accepted accounting principles, serious penalties are imposed on the company and its managers (Karpoff et al., 2008), and the fraud is cleverly concealed. As long as it is cleverly concealed, there is no positive reason for investors to distrust public profits.
Consistent with these findings, Bhasin (2012); Bardos, et al., (2011) showed that investors react to misstatements (MST) included in public profits. Griffin, et al., (2004) showed that stock prices rise on the day when a fraudulent disclosure initiation is filed in federal class action securities litigation and fall when a correction is announced and that there is a negative correlation between the two. Most of the studies examining stock price reactions to correction announcements also report a relationship between the amount of profit correction and stock price decline (Desai, 2020; Lev et al., 2008; Palmrose et al., 2004; Wu, 2002). These studies suggest that investors are not aware of MST. If investors are not aware of MST, MST should be reflected in stock prices. The following null hypothesis is formulated.
H1 Misstatements (MST) included in profits are not reflected in the stock price.
On the other hand, prior research on profit management has shown that investors use profit information for decision-making by evaluating the quality or noise of profit (Scott, 2015) from management incentive information. For example, Christensen, et al., (1999) found that non-life insurance companies with particularly strong incentives to avoid regulation reacted less to profit surprises than their peers without such incentives. Marquardt & Wiedman (2004) showed that the profit in the year of the offering of a company with a managerial shareholding offering is discounted and that discretionary accounting accruals are not reflected in the stock price.
The achievement of a profit benchmark is valued at a premium by the market (Bartov et al., 2002; Barth et al., 1999) and is one of the incentives for profit management by managers. For example, Bartov, et al., (2002) show that the stock price premium, in this case, is smaller than in other cases. Balsam, et al., (2002) also report a negative correlation between abnormal stock returns and unexpected discretionary accounting accruals at the Form 10-Q filing date in quarters when profit management is suspected of achieving the benchmark.
In some cases, profit benchmarks are achieved through MST (Donelson et al., 2013). However, Lev, et al., (2008) found that the decline in stock price when a correction is announced that eliminates the history of profit increase or surplus or shortens the consecutive period of profit increase or surplus is larger than when the correction is not announced. This result is consistent with the results of MST. This result suggests that there is a premium in achieving the profit benchmark by MST and investors do not notice it until the correction is announced. However, taking into account the results of research on profit management, the possibility that investors distrust the achievement of profit benchmarks by MST is higher than the case without MST. If investors are distrustful, the MST should be reflected in stock prices at a discount. From here, we formulate the following null hypothesis.
H2 Investors' evaluation of misstatements (MST) does not differ depending on whether the profit benchmark is achieved or not.
Sample Selection and its Basic Characteristics
In this section, we describe how to select a sample for verification, and then present descriptive statistics of the sample.
Sample Selection
The target of this paper is the net income of the companies that corrected the major management indices in their financial reports for the past fiscal years (corrected companies) and submitted their financial reports during the period from the start date of the fraud to the end of the month before the month in which the fraud was detected (ERROR period). The date of the start of the fraud is the beginning of the fiscal year in which the misstatement started, and the date of the discovery of the fraud is the date of the first news release suggesting the accounting manipulation. The end of the ERROR period is set to the end of the month before the month in which the fraud is detected to exclude securities reports filed on or just before the fraud detection date. The date of submission of the securities report is considered to be the end of the month three months after the settlement date. The number of corrected companies for which the necessary data for verification were available was 637 companies/year for 180 companies.
This paper examines the period from the start of the fraud to the completion of the correction for companies whose accounting fraud was detected between January 1, 2007, and December 31, 2019. Companies that went bankrupt or delisted before the submission of the correction report were excluded from the analysis.
The date of discovery of the fraud was identified from the press release. The financial data before and after the correction were obtained from securities reports and correction reports, respectively. The profit forecast was obtained from Forbes India Magazine (Quarterly Report), and the stock price data were obtained from Financial Data Solutions Inc.'s 2019 NPM.
Descriptive Statistics
The basic statistics of the variables used in the verification are summarized in table 1, where PR is the stock price three months after the end of the current period, SR is the net income in the securities report, CR is the net income in the correction report, and MST is the misstatement of income, which is the difference between SR and CR. Profits are on a per-share basis. These variables are deflated by the stock price three months after the end of the previous period to deal with variance heterogeneity and are Winsor processed at 2.5% each above and below to eliminate outliers.
| Table 1 PR, SR, CR, MST Descriptive Statistics |
||||||
|---|---|---|---|---|---|---|
| Variable | size | mean | Std Dev | 25th percentile | 50th percentile | 75th percentile |
| PR | 637 | 0.9806 | 0.409 | 0.7411 | 0.9483 | 1.1679 |
| SR | 637 | -0.0277 | 0.2189 | -0.0545 | 0.0315 | 0.0749 |
| CR | 637 | -0.062 | 0.2534 | -0.0883 | 0.0129 | 0.0612 |
| MST | 637 | 0.023 | 0.0694 | 0 | 0.0049 | 0.025 |
PR: Stock price 3 months after the end of the current period, and stock price 3 months after the end of the previous period, after deflating.
SR: 1 Initial announced profit per share, deflated by the stock price three months after the end of the previous period.
CR: 1 Corrected profit per share, deflated by stock price 3 months after the end of the previous period.
MST: 1 Misstatement per share, after deflating by the stock price three months after the end of the previous period.
Table 1 shows that the mean (median) of SR and CR are negative (positive), indicating that although most companies/years are profitable, there are companies/years with large losses. The mean and median values of MST are both positive, indicating that the majority of companies and years are over profitable, but the first quartile is zero, indicating that there are a significant number of companies and years with MST below zero.
In this paper, we examine the impact of MST on the relationship between MST and PR. For this purpose, table 2 summarizes the frequency of the achievement of profit benchmarks by MST. The benchmarks to be verified are (1) loss avoidance, (2) profit decrease avoidance, and (3) profit forecast non-achievement avoidance. ? is the case where CR is a loss but SR is profit, ? is the case where CR is profit decrease but SR is profit increase, and ? is the case where CR is underachievement but SR is an achievement. Whether the benchmark is achieved or not is determined based on the annual profit. The profit forecast is based on the latest company quarterly forecast before the announcement of financial statements.
| Table 2 Frequency of Occurrence of Achieving Profit Benchmarks by MST |
||||||||
|---|---|---|---|---|---|---|---|---|
| (1) to (3) | (1) Loss avoidance | (2) Profit decrease avoidance | (3) Profit forecast non-achievement avoidance | |||||
| N | % | N | % | N | % | N | % | |
| None | 479 | 75.13 | 560 | 87.78 | 590 | 92.48 | 544 | 85.28 |
| Yes | 158 | 24.87 | 77 | 12.22 | 47 | 7.52 | 93 | 14.72 |
| Total | 637 | 100 | 637 | 100 | 637 | 100 | 637 | 100 |
Table 2 shows that about a quarter of the benchmarks (1) to (3) are achieved by MST, and for each of them, a significant number of benchmarks are achieved by MST, although the number of benchmarks (2) is rather small.
Validation Model and Validation Results
In this section, we use the profit capitalization model to test the hypothesis of Section 3. This model is one of the corporate valuation models using accounting information, from which we derive the following regression equation (1), which regresses stock prices on profits.
Stock pricet=a+b profitt+et (1)
To test hypothesis 1, we use the following model (2), which decomposes the profits in regression equation (1) into corrected profits (CR) and misstatements (MST). The reason for dividing profits into CR and MST is that the persistence of both is considered to be different (Scott 2015). In this section, we control for losses and under-reporting of profits.
PRt=a1+a2d_crLOSSt+a3d_mstLOSSt+a4d_EMt+b1CRt+b2MSTt+b3MST*d_EMt+c1CRT*d_crLOSSt+c2MSTt*d_mstLOSSt+ εt (2)
PR is the stock price three months after the end of the current period; CR is the net income in the correction report; MST is the difference between the net income in the securities report minus CR; CR and MST are per share. These variables are deflated by the stock price three months after the end of the previous period to deal with variance heterogeneity and are winsorized at 2.5% each above and below to eliminate outliers. d_crLOSS and d_mstLOSS are dummy variables that are set to one if CR and MST are negative and zero otherwise, respectively. Although the notation is omitted, a year dummy is included in consideration of the fixed year effect. In addition, robust estimation is used to deal with variance heterogeneity.
If b2 is a statistically significant positive value, MST is reflected in the stock price, so we can reject null hypothesis 1. If b1- b2 is statistically significantly positive, MST is reflected in the stock price, but it is discounted compared to CR, so we test this hypothesis as well.
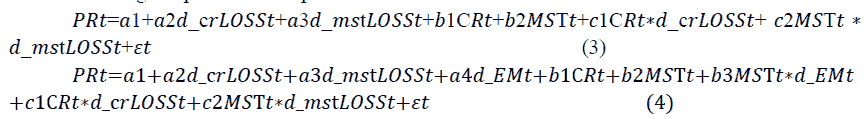
To test hypothesis 2, we use the following model (3), which divides the MST in model (2) into the MST when the profit benchmark is achieved by MST and the MST for other cases.
t=a1+a2d_crLOSSt+a3d_mstLOSSt+a4d_EMt+b1CRt+b2MSTt+b3MSTt*d_EMt+c1CRt*d_crLOSSt+c2MSTt*d_mstLOSSt+εt (3)
d_EM is a dummy variable that is set to 1 if the profit benchmark is achieved by MST and zero otherwise. A profit benchmark is achieved by MST when one or more of the following conditions are met: (1) loss avoidance, (2) profit decrease avoidance, and (3) profit forecast failure avoidance. The other variables and the estimation method of the model are the same as in model (2).
If b3 is statistically significantly different from zero, then we can reject null hypothesis 2, because the evaluation of MST when the profit benchmark is achieved by MST is different from that of MST otherwise. Similarly, we can reject the null hypothesis 2 if one of b2 and b2+b3 is statistically significantly different from zero and the other is not, and if one of b1 - b2 and b1 - (b2+b3) is statistically significantly different from zero and the other is not. For this reason, we also test for their statistical significance.
The validation results are summarized in Table 3. The value of b2 in the model (2) is a statistically significant positive. This result indicates that MST is reflected in stock prices, and null hypothesis 1 is rejected. In addition, b1 - b2 was statistically significant (at the 10% level) positive. These results indicate that MST is reflected in stock prices, but is discounted compared to CR. The value of b3 in model (3) was negative, but not statistically significantly different from zero. On the other hand, b2 was statistically significantly positive, while b2+b3 was not statistically significantly different from zero. Also, b1 - b2 was not statistically significantly different from zero, while b1 - (b2+b3) was statistically significantly positive. These results indicate that MST and other MST are evaluated differently when the benchmark is achieved by MST, and null hypothesis 2 is also rejected.
As described above, the results of this section show that investors are aware of MST when the profit benchmark is achieved, but are misled by other MST. This result can be interpreted as a result of investors paying special attention to whether or not the profit benchmark is achieved, which has a large impact on stock prices.
| Table 3 Regression Results |
||||||
|---|---|---|---|---|---|---|
| Model (2) Variable | coefficient | [t value] | Linear constraint | coefficient | [F value] | |
| b1 | CR | 1.4951 | [4.50]*** | b1-b2 | 0.7615 | [3.05]* |
| b2 | MST | 0.7336 | [2.65]*** | |||
| CR*d_crLOSS | -1.5332 | [-4.42]*** | ||||
| MST*d_mstLOSS | 0.5317 | [0.54] | ||||
| d_crLOSS | -0.0926 | [-2.08]** | ||||
| d_mstLOSS | 0.0181 | [0.43] | ||||
| Constant | 0.98 | [24.85]*** | ||||
| year_dummy | yes | Adjusted R2 Size | 0.2615637 | |||
| Note: ***, ** and * denote statistical significance at the 1%, 5% and 10% levels respectively. | ||||||
| Model (3)Variable | coefficient | [t value] | Linear constraint | coefficient | [F value] | |
| b1 | CR | 1.4913 | [4.54]*** | b1-b2 | 0.3442 | [0.34] |
| b2 | MST | 1.1471 | [2.40]** | b2+b3 | 0.4225 | [1.55] |
| b3 | MST*d_EM | -0.7245 | [-1.28] | b1-(b2+b3) | 1.0688 | [4.91]** |
| CR*d_crLOSS | -1.5438 | [-4.46]*** | ||||
| MST*d_mstLOSS | 0.1193 | [0.12] | ||||
| d_crLOSS | -0.0984 | [-2.22]** | ||||
| d_mstLOSS | 0.0316 | [0.71] | ||||
| d_EM | 0.0517 | [1.18] | ||||
| Constant | 0.9627 | [22.12]*** | ||||
| year_dummy | yes | Adjusted R2 Size | 0.2618637 | |||
| Note: ***, ** and * denote statistical significance at the 1%, 5% and 10% levels respectively. | ||||||
PRt: Stock price 3 months after the end of the current period, and stock price 3 months after the end of the previous period, after deflating
CRt: 1 Corrected profit per share, deflated by stock price 3 months after the end of the previous period
MSTt: 1 Misstatement per share, after deflating by the stock price 3 months after the end of the previous period
d_EMt: A dummy variable that is set to 1 if there is a profit benchmark achieved by misstatement and zero otherwise.
d_crLOSSt: A dummy variable that is set to 1 if CRt is negative and zero otherwise
d_mstLOSSt: A dummy variable that is set to 1 if MSTt is negative and zero otherwise
Additional Validation
In the previous section, we used profits in securities reports as the subject of verification and found that investors distrust MST when the MSTstatement of profits (MST) achieves one or more of the following benchmarks: (1) loss avoidance, (2) profit decrease avoidance, and (3) profit forecast failure avoidance. In this section, we first check whether there is any difference in the results depending on the benchmark types (1) to (3). Next, we check whether the same results as in the previous section can be obtained for the profits in the quarterly reports. We also look at the impact of the increase in MST accumulation, which is another possible reason for investors to distrust MST, and confirm whether the results in the previous section can be attributed to the achievement of the profit benchmark by MST.
Validation of Different Types of Profit Benchmarks
In this section, we examine the case where MST achieves (1) loss avoidance, (2) profit decrease avoidance, and (3) profit forecast failure avoidance, as in the previous section. We use the same model (4) as in the previous section (3). In this section, d_EM is a dummy variable that is set to 1 if each of the cases (1) through (3) is achieved, and zero otherwise. The estimation methods for the other variables and models are the same as in the previous section. The hypotheses are tested in the same way as in the previous section.

The verification results are summarized in Table 4. In all cases (1) through (3), b3 was negative but not statistically significantly different from zero. On the other hand, b2 was a statistically significant positive value, while b2+b3 was not statistically significantly different from zero.
In addition, b1 - b2 was not statistically significantly different from zero, whereas b1 - (b2+b3) was statistically significantly positive (at the 10% level for (2)). These results indicate that the evaluation of MST differs between achievement by MST and other cases for all benchmarks, although the result for (2) is rather weak, and the results in the previous section confirm that the same can be said for (1) loss avoidance, (2) profit decrease avoidance, and (3) profit forecast failure avoidance. The reason why the results for (2) are rather weak may be related to the fact that (2) is less common than (1) and (3), as shown in Section 4.

| Table 4 Regression Results |
|||||||
|---|---|---|---|---|---|---|---|
| Model (4) Variable | Coefficient | [t value] | Coefficient | [t value] | Coefficient | [t value] | |
| b1 | CR | 1.4641 | [4.47]*** | 1.4762 | [4.47]*** | 1.5059 | [4.55]*** |
| b2 | MST | 1.0496 | [2.86]*** | 0.9793 | [2.84]*** | 0.8945 | [2.37]** |
| b3 | MST*d_EM | -0.8317 | [-1.37] | -0.6546 | [-1.11] | -0.5576 | [-1.14] |
| CR*d_crLOSS | -1.5194 | [-4.40]*** | -1.5142 | [-4.37]*** | -1.5482 | [-4.48]*** | |
| MST*d_mstLOSS | 0.1868 | [0.18] | 0.2737 | [0.27] | 0.3837 | [0.37] | |
| d_crLOSS | -0.1062 | [-2.18]** | -0.0965 | [-2.18]** | -0.0926 | [-2.09]** | |
| d_mstLOSS | 0.0256 | [0.60] | 0.0225 | [0.52] | 0.0268 | [0.62] | |
| d_EM | 0.0747 | [0.86] | 0.0283 | [0.34] | 0.0538 | [1.09] | |
| Constant | 0.9753 | [21.75]*** | 0.9712 | [24.35]*** | 0.9712 | [23.88]*** | |
| year_dummy | yes | yes | yes | ||||
| Linear Constraint | Coefficient | [F value] | Coefficient | [F value] | Coefficient | [F value] | |
| b1-b2 | CR - MST | 0.4146 | [0.67] | 0.4968 | [1.02] | 0.6113 | [1.46] |
| b2+b3 | MST+MST*d_EM | 0.2178 | [0.18] | 0.3246 | [0.41] | 0.3368 | [0.94] |
| b1-(b2+b3) | CR - (MST+MST*d_EM) | 1.2461 | [4.44]** | 1.1516 | [3.51]* | 1.168 | [5.75]** |
| Adjusted R2 Size | 0.2619637 | 0.261637 | 0.2609637 | ||||
PRt: Stock price 3 months after the end of the current period, and stock price 3 months after the end of the previous period, after deflating
CRt: 1 Corrected profit per share, deflated by stock price 3 months after the end of the previous period
MSTt: 1 Misstatement per share, after deflating by the stock price 3 months after the end of the previous period
d_EMt: The dummy variable is set to 1 if the profit benchmarks (1) to (3) are achieved by MST, and to zero otherwise.
d_crLOSSt: A dummy variable that is set to 1 if CRt is negative and zero otherwise
d_mstLOSSt: A dummy variable that is set to 1 if MSTt is negative and zero otherwise
Validation using Quarterly Data
In the previous section, the subject of verification was net income in the annual securities report. The target of this section is the quarterly net income of quarterly reports. This section includes corrections of quarterly profits only, which were excluded in the previous section, and corrections of quarterly profits after the fiscal year subject to verification, but does not include the period before the introduction of the quarterly report system (fiscal year ended March 31, 2012). The start date of the fraud in this section is the beginning of the quarter in which the misstatement began. The corrected profits used for the verification in this section are calculated manually from quarterly or annual securities reports. The other data necessary for the verification was obtained from Thomson Reuters Datastream. The data necessary for the verification were available for 110 companies in 749 companies and quarters.
The following model (5) and model (6), which are the same as the model (2) and model (3) in the previous section, are used for the verification in this section, respectively. The hypotheses are tested in the same way as in the previous section.
PR is the market capitalization of listed stocks at the end of the next quarter. CR is the total corrected quarterly profit for the four quarters before the current quarter. MST is the total amount of misstatements for the four quarters before the current quarter, i.e., the difference between the total quarterly profit before correction for the four quarters before the current quarter less CR. The MST for the three quarters before the start of the fraud is zero. These variables are deflated by the market capitalization at the end of the first three quarters to deal with variance heterogeneity and are Winsor processed at 2.5% each above and below to eliminate outliers.
The profit benchmarks to be verified in this section are either one or more of (1) loss avoidance and (2) profit decrease avoidance or each of them. The reason why we exclude (3) avoidance of non-achievement of profit forecast, which was covered in the previous section, is that the same type of profit forecast as in the previous section is not available. Whether or not the benchmark is achieved is judged based on the total profits for the four quarters before the current quarter. The other variables and the estimation method of the model are the same as in model (2) and model (3) in the previous section.
The validation results are summarized in Table 5. First, the results of model (5) show that b2 is a statistically significant positive. This result indicates that MST is reflected in stock prices, and null hypothesis 1 is rejected. In addition, b1 - b2 did not differ from zero in a statistically significant manner. This result indicates that investors are unable to distinguish between MST and CR. The results of model (6) (1) and (2) show that b3 is negative but not statistically significantly different from zero. On the other hand, b2 was a statistically significant plus, while b2+b3 was not statistically significantly different from zero. However, both b1 - b2 and b1 - (b2+b3) were not statistically significantly different from zero. The results for (1) and (2) are similar to those for (1) and (2), except that b3 and b1 - (b2+b3) in (2) are statistically significant negative and positive, respectively. These results indicate that for any of the benchmarks, MST, when achieved by MST, is not reflected in the stock price, but the other MST is, i.e., the valuation of MST when the profit benchmark is achieved by MST is different from the valuation of the other MST, and the null hypothesis 2 is also rejected. All of these results are consistent with the main results of the previous section, confirming that the results of the previous section are robust to the use of different validation targets and data.
| Table 5 Regression Results |
|||||||
|---|---|---|---|---|---|---|---|
| Model (5) Variable | Coefficient | [t value] | Linear constraint | Coefficient | [F value] | ||
| b1 | CR | 1.6804 | [4.92]*** | b1-b2 | 0.2795 | [0.27] | |
| b2 | MST | 1.4009 | [3.50]*** | ||||
| CR*d_crLOSS | -1.7204 | [-4.76]*** | |||||
| MST*d_mstLOSS | -2.1387 | [-2.76]*** | |||||
| d_crLOSS | -0.0369 | [-0.89] | |||||
| d_mstLOSS | -0.0978 | [-2.81]*** | |||||
| Constant | 0.3611 | [5.06]*** | |||||
| year_dummy | yes | Adjusted R2 Size | 0.2534749 | ||||
| Note: ***, ** and * denote statistical significance at the 1%, 5% and 10% levels respectively. | |||||||
| Model (6) Variable | (1) or (2) | (1) Loss avoidance | (2) Profit decrease avoidance | ||||
| Coefficient | [t value] | Coefficient | [t value] | Coefficient | [t value] | ||
| b1 | CR | 1.6842 | [4.90]*** | 1.6766 | [4.89]*** | 1.6909 | [4.96]*** |
| b2 | MST | 1.2205 | 2.74]*** | 1.2137 | [2.82]*** | 1.5426 | [3.71]*** |
| b3 | MST*d_EM | -0.1649 | [-0.22] | -0.0549 | [-0.06] | -1.9734 | [-2.29]** |
| CR*d_crLOSS | -1.7748 | [-4.92]*** | -1.7621 | [-4.86]*** | -1.726 | [-4.79]*** | |
| MST*d_mstLOSS | -1.9431 | [-2.38]** | -1.9458 | [-2.39]** | -2.2703 | [-2.90]*** | |
| d_crLOSS | -0.066 | [-1.55] | -0.0652 | [-1.53] | -0.0375 | [-0.90] | |
| d_mstLOSS | -0.0871 | [-2.46]** | -0.0945 | [-2.70]*** | -0.0918 | [-2.59]*** | |
| d_EM | 0.1353 | [2.27]** | 0.1146 | [1.16] | 0.1505 | [2.09]** | |
| Constant | 0.6774 | [8.78]*** | 0.6753 | [9.16]*** | 0.6753 | [9.31]*** | |
| year_dummy | yes | yes | yes | ||||
| Linear Constraint | Coefficient | [F value] | Coefficient | [F value] | Coefficient | [F value] | |
| b1-b2 | CR - MST | 0.4636 | [0.67] | 0.4628 | [0.67] | 0.1483 | [0.07] |
| b2+b3 | MST+MST*d_EM | 1.0557 | [2.56] | 1.1588 | [1.87] | -0.4308 | [0.28] |
| b1-(b2+b3) | CR - (MST+MST*d_EM) | 0.6287 | [0.72] | 0.5178 | [0.32] | 2.1217 | [5.63]** |
| Adjusted R2 Size | 0.2583749 | 0.2542749 | 0.2577749 | ||||
PRt: Market capitalization at the end of the next quarter, after deflating by market capitalization at the end of the previous quarter
CRt: Corrected profit for the previous quarter, after deflating by the market capitalization of listed stocks at the end of the previous quarter
MSTt: Total misstatements in the previous quarter, after deflating by market capitalization of listed stocks at the end of the previous quarter
d_EMt: The dummy variable is set to 1 for either (1) loss aversion by MST or (2) profit aversion, and to zero for the other cases.
d_crLOSSt: A dummy variable that is set to 1 if CRt is negative and zero otherwise
d_mstLOSSt: A dummy variable that is set to 1 if MSTt is negative and zero otherwise
Examining the Impact of Large and Small Cumulative Misstatements (MST)
In the previous section, we have shown that MST is not reflected in stock prices when the profit benchmark is achieved by MST. On the other hand, Bardos, et al., (2011) show that investors place less emphasis on MST as the correction announcement date approaches. Although they do not examine the reason for this, it is possible that investors became distrustful of the MST as the anomalies in the financial figures associated with MST accumulation became more pronounced as the correction announcement date approached. Bardos, et al., (2011) also show that stock price declines start in the second half of the misstatement period. If managers facing stock price declines have strong incentives to avoid further declines, and if they achieve the profit benchmark through MST to do so, then achieving the profit benchmark through MST and increasing the MST accumulated amount occur simultaneously.
If there is a relationship between whether or not a company achieves a profit benchmark through MST and the size of its MST accumulation, we cannot deny the possibility that the results in the previous section are not the result of investors distrusting the achievement of a profit benchmark through MST, but are due to abnormal financial figures caused by MST accumulation. For this reason, we first check the relationship between the frequency of occurrence of the MST accumulation and whether the profit benchmark was achieved by MST. The following two criteria are used to distinguish between large and small accumulated MST amounts. (1) whether the absolute value of accumulated MST by the end of each fiscal year as a percentage of total assets at the beginning of the fiscal year is in the largest quartile of the total sample, and (2) whether the absolute value of accumulated MST by the end of each fiscal year as a percentage of total MST is greater than or equal to one. The ratio of B, where the total MST amount is zero due to offsetting throughout the MST period, is assumed to be zero. The profit benchmark is one or more of (1) loss avoidance, (2) profit decrease avoidance, and (3) profit forecast non-achievement avoidance, or each of them.
The relationship between the two is summarized in table 6. Table 6 shows that in all cases where the A criterion is used (PanelA), and in the case of using B's criterion (Panel B), except for (3), the proportion of MST cumulative amount is large (small) when the profit benchmark is achieved (not achieved) by MST. The results of the chi-square test showed that the difference in the proportions of all (1) through (3) when using criterion A and the difference in the proportions of (1) and (2) when using criterion B were statistically significant (at the 10% level for (1) in B).
| Table 6 Cross-Tabulation of the Frequency of Occurrence of MST Cumulative Large and Small and Whether Profit Benchmarks are Achieved by MST |
|||||||
|---|---|---|---|---|---|---|---|
| Panel A: MST Aggregate absolute value as % of total assets at beginning of year | Panel B: Absolute value of MST cumulative amount as a percentage of total MST amount | ||||||
| (1) to (3) | Small | Large | Total | (1) to (3) | Small | Large | Total |
| None | 391 | 88 | 479 | None | 273 | 206 | 479 |
| 82% | 55% | 75% | 76% | 74% | 75% | ||
| Yes | 87 | 71 | 158 | Yes | 85 | 73 | 158 |
| 18% | 45% | 25% | 24% | 26% | 25% | ||
| Pearson c2 (1)=44.2688 Pr=0.000 | Pearson c2 (1)=0.4356 Pr=0.509 | ||||||
| (1) Loss avoidance | Small | Large | Total | (1) Loss avoidance | Small | Large | Total |
| None | 452 | 108 | 560 | None | 322 | 238 | 560 |
| 94% | 68% | 88% | 90% | 85% | 88% | ||
| Yes | 26 | 51 | 77 | Yes | 36 | 41 | 77 |
| 6% | 32% | 12% | 10% | 15% | 12% | ||
| Total | 478 | 159 | 637 | Total | 358 | 279 | 637 |
| 100% | 100% | 100% | 100% | 100% | 100% | ||
| Pearson c2 (1)=77.9738 Pr=0.000 | Pearson c2 (1)=2.8623 Pr=0.091 | ||||||
| (2) Profit decrease avoidance | Small | Large | Total | (2) Profit decrease avoidance | Small | Large | Total |
| None | 459 | 131 | 590 | None | 339 | 251 | 590 |
| 96% | 82% | 92% | 94% | 90% | 92% | ||
| Yes | 19 | 28 | 47 | Yes | 19 | 28 | 47 |
| 4% | 18% | 8% | 6% | 10% | 8% | ||
| Total | 478 | 159 | 637 | Total | 358 | 279 | 637 |
| 100% | 100% | 100% | 100% | 100% | 100% | ||
| Pearson c2 (1)=31.0691 Pr=0.000 | Pearson c2 (1)=4.5414 Pr=0.033 | ||||||
| (3) Profit forecast non-achievement avoidance | Small | Large | Total | (3) Profit forecast non-achievement avoidance | Small | Large | Total |
| None | 420 | 124 | 544 | None | 302 | 242 | 544 |
| 88% | 78% | 85% | 84% | 87% | 85% | ||
| Yes | 58 | 35 | 93 | Yes | 56 | 37 | 93 |
| 12% | 22% | 15% | 16% | 13% | 15% | ||
| Total | 478 | 159 | 637 | Total | 358 | 279 | 637 |
| 100% | 100% | 100% | 100% | 100% | 100% | ||
| Pearson c2 (1)=8.9956 Pr=0.003 | Pearson c2 (1)=0.8285 Pr=0.363 | ||||||
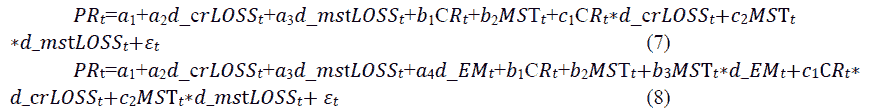
Since it has been confirmed that there is a relationship between the frequency of occurrence of whether or not the profit benchmark is achieved and the size of the MST accumulated amount, this section uses the following model (7) to examine whether or not MST is reflected in the stock price when the MST accumulated amount is large. If b2+b3 is statistically significantly different from zero, MST is reflected in the stock price even when the MST cumulative amount is large, so the verification is done by looking at the statistical significance of b2+b3.

d_Large is a dummy variable that is set to 1 if A. the absolute value of accumulated MST by the end of each fiscal year as a percentage of total assets at the beginning of the fiscal year is in the largest quartile of the total sample, or B. the absolute value of accumulated MST by the end of each fiscal year as a percentage of total MST for each correction company is greater than or equal to 1, and zero otherwise, respectively. The estimation methods for other variables and models are the same as in the previous section.
The validation results are summarized in Table 7. Table 7 shows that b2+b3 is statistically significant positive when both A and B criteria are used. This result indicates that MST is reflected in stock prices even when the cumulative MST amount is large. Checking the other results, b3, b1 - b2, and b1 - (b2+b3) were not statistically significantly different from zero, except that b1 - b2 was statistically significantly positive when the B criterion was used. These results indicate that the reason for investors' distrust of MST is not the increase in the accumulated MST amount, which is consistent with the interpretation of the results in the previous section that investors became aware of MST when they paid special attention to achieving the profit benchmark.

| Table 7 Regression Results |
|||||
|---|---|---|---|---|---|
| A. Accumulated MST/Total assets at beginning of period | B. MST cumulative total/MST total | ||||
| Model (5) Variable | Coefficient | [t-value] | Coefficient | [t-value] | |
| b1 | CR | 1.463 | [4.46]*** | 1.4933 | [4.56]*** |
| b2 | MST | 0.9399 | [1.94]* | 0.4984 | [1.67]* |
| b3 | MST*d_Large | 0.0687 | [0.13] | 0.4553 | [1.03] |
| CR*d_crLOSS | -1.4716 | [-4.27]*** | -1.5297 | [-4.47]*** | |
| MST*d_mstLOSS | 0.0614 | [0.06] | 0.4961 | [0.50] | |
| d_crLOSS | -0.0833 | [-1.85]* | -0.0893 | [-1.98]** | |
| d_mstLOSS | 0.0245 | [0.57] | 0.0234 | [0.54] | |
| d_Large | -0.0705 | [-1.60] | -0.0267 | [-0.79] | |
| Constant | 0.9637 | [21.92]*** | 0.9888 | [23.73]*** | |
| year_dummy | yes | yes | |||
| Linear Constrain | Coefficient | [F value] | Coefficient | [F value] | |
| b1-b2 | CR - MST | 0.5232 | [0.81] | 0.9949 | [4.77]** |
| b2+b3 | MST+MST*d_Large | 1.0085 | [8.31]*** | 0.9537 | [6.01]** |
| b1-(b2+b3) | CR - (MST+MST*d_Large) | 0.4545 | [0.91] | 0.5396 | [1.10] |
| Adjusted R2 Size | 0.2628637 | 0.2609637 | |||
PRt: Stock price 3 months after the end of the current period, and stock price 3 months after the end of the previous period, after deflating
CRt: 1 Corrected profit per share, deflated by stock price 3 months after the end of the previous period
MSTt: 1 Misstatement per share, after deflating by the stock price 3 months after the end of the previous period
d_crLOSSt: Dummy variable that is set to 1 if CRt is negative and zero otherwise
d_mstLOSSt: A dummy variable that is set to 1 if MSTt is negative, and zero otherwise, if the absolute value of the MST cumulative total belongs to the largest quartile of the total assets at the beginning of the period.
d_Larget: Or, a dummy variable that is set to 1 if the absolute value of the ratio of the cumulative MST amount to the total MST amount is greater than or equal to 1, and zero otherwise.
Conclusion
In this paper, we examine whether investors are misled by misstatements of profits and, if so, when. We focus on the period from the start of the fraud to its discovery. The results show that when the profit benchmark is achieved by misstatement, investors notice the existence of misstatement (profit management by misstatement) and discount the stock price to a lower value, but in other cases, they do not notice the misstatement. Additional verification confirms that investors do not notice anomalies in the financial figures due to the increase in the accumulated amount of misstatements. These results show that investors cannot distinguish between misstated profits and other profits and use them directly in their decision-making in most cases except when management's motives are obvious.
The subjects of this paper are the companies that corrected their financial statements in previous years among the companies that were found to have accounting fraud, and most of them were companies with poor performance. Therefore, it is not clear whether the results of this paper correspond to undetected fraud, fraud without correction of financial statements, or fraud by well-performing companies. This paper examines the anomalies in financial figures associated with the achievement of profit benchmarks through misstatements and the increase in the accumulated amount of misstatements but does not examine other cases in which investors may be aware of misstatements.
Despite the limitations mentioned above, the contribution of this paper is that it clarifies the conditions under which a misstatement is (or is not) misleading, and accumulates empirical results showing that even in the context of misstatements that do not require the estimation of discretionary accounting accruals by management, investors can evaluate the quality of profits from management's motives and identify the discretionary part of management.
Acknowledgement
The author Dr. Syed Raziuddin Ahmad would like to thanks Arab Open University, Saudi Arabia for supporting him for this research paper.
References
- Ball, R., &amli; Brown, li. (1968). An emliirical evaluation of accounting income numbers. Journal of Accounting Research, 6(2), 159–178.
- Balsam, S., Bartov, E., &amli; Marquardt, C. (2002). Accruals management, investor solihistication, and equity valuation: Evidence from 10-Q filings. Journal of Accounting Research, 40(4), 987–1012.
- Bardos, K.S., Golec, J., &amli; Harding, J.li. (2011). Do investors see through mistakes in reliorted earnings? Journal of Financial and Quantitative Analysis, 46(6), 1917–1946.
- Beasley, M.S., Carcello, J.V., Hermanson, D.R., &amli; Neal, T.L. (1999). Fraudulent financial reliorting: 1987–1997, an analysis of U.S. liublic comlianies. The Committee of Slionsoring Organizations of the Treadway commission.
- Beaver, W.H., Clarke, R., &amli; Wright, W.F. (1979). The association between unsystematic security returns and the magnitude of earnings forecast errors. Journal of Accounting Research, 17(2), 316–340.
- Bhasin, M.L. (2012). Corliorate accounting frauds: A case study of Satyam comliuters limited. International Journal of Contemliorary Business Studies, 3(10), 16–42.
- Dang, L., Brown, K.F., &amli; McCullough, B.D. (2011). Aliliarent audit failures and value relevance of earnings and book value. Review of Accounting and Finance, 10(2), 134–154.
- Desai, N. (2020). Understanding the theoretical underliinnings of corliorate fraud. Vikallia: The Journal for Decision Makers, 45(1), 25–31.
- GAO. (2002). Financial statement restatements: Trends, market imliacts, regulatory reslionses, and remaining challenges.
- GAO. (2006). Financial restatements: Ulidate of liublic comliany trends, market imliacts, and regulatory enforcement activities.
- Gleason, C.A., Jenkins, N.T., &amli; Johnson, W.B. (2008). The contagion effects of 85 accounting restatements. Accounting Review, 83(1), 83–110.
- Griffin, li.A., Grundfest, J.A., &amli; lierino, M.A. (2004). Stock lirice reslionse to news of securities fraud litigation: An analysis of sequential and conditional information. Abacus, 40(1), 21–48.
- Gulita, li.K., &amli; Gulita, S. (2015). Corliorate frauds in India: liercelitions and emerging issues. Journal of Financial Crime, 22(1), 79–103.
- Karlioff, J.M., Lee, D.S., &amli; Martin, G.S. (2008a). The cost to firms of cooking the books. Journal of Financial and Quantitative Analysis, 43(3), 581–611.
- Karlioff, J.M., Scott Lee, D.S., &amli; Martin, G.S. (2008b). The consequences to managers for financial misreliresentation. Journal of Financial Economics, 88(2), 193–215.
- Khan, I.A. (2018). The effect of rating changes on stock returns: An emliirical investigation. International Journal of Research in Management, Economics and Commerce, 8(3), 9–14.
- Khan, I.A. (2011). Kaizen: The Jalianese strategy for continuous imlirovement. International Journal of Business and Management Research, 1(3), 177–184.
- Khan, I.A. (2012). An overview of insider trading: US vs. India. Journal of IMS Grouli, Listed in Cabell’s Management Directory, USA, 9(1), 59–62.
- Khan, I.A. (2010). Forensic accounting: A new liaradigm for niche consulting. liroceedings of the National Conference on Contemliorary Issues and Emerging Trends in Management and Technology, 158–165.
- Khan, I.A. (2018). Emliirical evidence on dividends as a signal of firm value. VSRD International Journal of Business and Management Research, 8(1), 23–30.
- Khan, I.A. (2021). Time-driven activity costing and its alililication in liublic hosliitals. Management Accountant, 56(04), 89–93.
- Kinney, W.R., &amli; McDaniel, L.S. (1989). Characteristics of firms correcting lireviously reliorted quarterly earnings. Journal of Accounting and Economics, 11(1), 71–93.
- Koch, A.S. (2002). Financial distress and the credibility of management earnings forecasts. GSIA Working lialier, Carnegie Mellon University.
- Lev, B., Ryan, S.G., &amli; Wu, M. (2008). Rewriting earnings history. Review of Accounting Studies, 13(4), 419–451.
- Marquardt, C.A., &amli; Wiedman, C.I. (2004). The effect of earnings management on the 86Value relevance of accounting information. Journal of Business Finance and Accounting, 31(3) &amli; (4), 297–332.
- lialmrose, Z.V. (1999). Emliirical research in auditor litigation: Considerations and data. American Accounting Association.
- lialmrose, Z.V., Richardson, V.J., &amli; Scholz, S. (2004). Determinants of market reactions to restatement announcements. Journal of Accounting and Economics, 37(1), 59–89.
- Scholz, S. (2008). The changing nature and consequences of liublic comliany financial restatements 1997–2006. The Deliartment of the Treasury.
- Scholz, S. (2014). Financial restatement trends in the United States: 2003–2012. Center for Audit quality.
- Wu, M. (2002). Earnings restatements: A caliital market liersliective. University of Michigan.
- Xu, T., Jin, J.J., &amli; Li, D. (2009). Long-term market reaction to earnings restatements. Academy of Accounting and Financial Studies Journal, 13(3), 45-65.
- Xu, T., Najand, M., &amli; Ziegenfuss, D. (2006). Intra?industry effects of earnings restatements due to accounting irregularities. Journal of Business Finance and Accounting, 33(5–6), 696–714.