Research Article: 2022 Vol: 21 Issue: 3
Impact of Corporate Social Responsibility on Financial Performance: A Cross-Country and Cross-Culture Comparison
Inya Egbe, University of Birmingham
Xinyi Mo, University of Birmingham
Imaobong Inam, University of Nigeria
Citation Information: Egbe, I., Mo, Xinyi., Inam, I. (2022). Impact of Corporate Social Responsibility on Financial Performance: a Cross-Country and Cross-Culture Comparison. Journal of International Business Research, 21(3), 1-21.
Abstract
Studies on the relationship between corporate social responsibility (CSR) and corporate financial performance (CFP) have existed for over forty years. Still, only a few studies have analysed moderators or mediators in this field. Therefore, this study investigates whether the macro-cultures among different markets moderate the CSR-CFP relationship dynamic. This study employs the system generalised method of moments (GMM) on a cross-section of companies. The result obtained indicates that companies with better CSR performance have significantly better financial performance. Besides, the large-power-distance culture negatively moderates this relationship, while high-individualism culture positively influences the linkage between CSR and CFP. However, this study found no evidence to determine the moderating effects of masculinity culture and uncertainty-avoidance culture.
Keywords
Corporate Social Responsibility, Financial Performance, Culture.
Introduction
Several studies have attempted to analyse the relationship between CSR and corporate financial performance (CFP). The majority of these have found a positive CSR-CFP relationship in meta-analysis and empirical studies (Ruf et al., 2001; Orlitzky et al., 2003; Crifo et al., 2016). The arguments supporting positive relationships are developed from the stakeholder theory, legitimacy theory and resource-based theory (McWilliams & Siegel, 2001; Deegan & Unerman, 2011). In addition, these studies have argued that since CSR activities can provide the company with a better operating environment, it will also enhance the long-term value (Davis, 1973). Besides, as companies operate within various social contracts with stakeholders (Deegan & Unerman, 2011), the engagement of CSR practice not only achieve stakeholders' expectations but also reduce constraints from stakeholders (e.g. government or regulators), which will create benefits for business (Davis, 1973).
On the contrary, some scholars argue that the CSR-CFP relationship could be non-positive (i.e. negative, neutral, U shaped or inverse-U shaped) (Peloza, 2009; Flammer, 2015). The main reason for non-positive associations is that engagements of CSR practices are contrary, not in line with the managerial purpose for maximising shareholders' value as the cost will increase while the return for shareholders will decrease (Friedman, 1962; Davis, 1973). Furthermore, CSR activities will weaken profitability by diluting the business's economic productivity, shifting managers' interests in some profitable investments, and reducing the competitive advantages in the marketplace (Davis, 1973).
Recently, a growing body of literature has evolved from whether financial performance benefits from CSR to when CSR pays to be good, emphasising the moderating or mediating impact on the CSR-CFP relationship (Orlitzky et al., 2011). Mediators will provide a more transparent process for how CSR improve financial performance, while moderators will influence the extent of the impact of CSR on CFP (Grewatsch & Kleindienst, 2017). Many external or internal factors moderate or mediate the effects on CSR-CFP relationship, such as industry context (Baird et al., 2012), innovation (Hull & Rothenberg, 2008), consumer awareness (Servaes & Tamayo, 2013), and stakeholder reaction (Van der Laan et al., 2008).
However, there still are many knowledge gaps in the research for the CSR-CFP relationship. For example, a more dynamic method is suggested by many scholars (El Ghoul et al., 2011; Ho et al., 2012; Cheng et al., 2014) because analysing time lags can help scholars have more profound insights into the longitudinal impact on financial outcomes. Besides, culture is a significant predictor affecting CSR (Ho et al., 2012; Ioannou & Serafeim, 2012), which will differ the effect of CSR on CFP among markets (Robertson & Crittenden, 2003; Wang et al., 2016). Nevertheless, a relatively small body of empirical studies is concerned with the moderating impact of culture on responsibility and performance relationships.
Hence, this research aims to demonstrate whether the macro-cultures among different markets moderate the CSR-CFP relationship in a dynamic way. Our findings should make an essential contribution to the field of macro moderators in the research of the CSR-CFP relationship. National cultures will affect CSR by influencing stakeholders' reactions (attitudes and behaviour) towards CSR issues (Ho et al., 2012), while social involvement will be more beneficial to companies with more significant stakeholders' reactions (Wang & Qian, 2011). Besides, the corporate operation will experience improved performance if management practices match the macro-environment (Newman & Nollen, 1996). Thus, the CSR-CFP relationship may reflect different extents in various cultures.
The study employed data from two main sources: data published by Hofstede et al., (2005) and DataStream database. DataStream database provides access to the ASSET4 dataset. The environmental, social and governance (ESG) performance score in ASSET4 datasets is used to measure CSR (Cheng et al., 2014). In addition, financial data, including current total assets, current total liability, total assets, research and development cost, and debt to equity ratio, can be collected in DataStream as well. Besides, this study adopts Hofstede's cultural dimension theory and applies its published data in measuring four cultural dimensions; power distance index (PDI), individualism (IDV), masculinity (MAS), and uncertainty avoidance index (UAI) (Hofstede et al., 2005). The study also utilised the system generalised method of moments (GMM) estimator to test hypotheses.
The remaining part of this study is organised thus: Section 2 reviews previous literature and develops hypotheses of this study. Section 3 presents the methodology used in this study, including the sample selection, variables measured, and the design of empirical model. Section 4 presents empirical results, which reports the results of descriptive statistics of observation distribution, Pearson correlation analysis, and system GMM regressions; and Section 5 concludes the paper, discusses the findings of the study and shows limitation for further research.
Literature Review and Hypothesis Development
The Responsibility-Performance Relationship
Studies about corporate social responsibility (CSR) have progressed for over forty years. In an attempt to define CSR, several scholars have employed relevant models such as the framework of Carroll (1979), Wood (1991), and stakeholder perspective (Freeman, 1984). These models though introduced decades ago, are still relevant and are commonly used. However, with the emergence of new challenges, some researchers have reappraised CSR's meanings, categories, and measurements. (Wood, 2010; Berger?Walliser and Scott, 2018; Rabello et al., 2018). Hence, this study takes emerging challenges of corporate governance into consideration while attempting to define CSR. The study defines CSR as an organisations decision and activities which are channelled to;
1. Contribute to sustainable development in society and environment; 2. Consider ethical and philanthropic expectations of stakeholders; 3. Comply with applicable law and international norms of behaviour; and 4. May not receive economic benefits immediately or directly.
Researchers have also studied the effect of CSR on financial performance. On the one hand, many scholars argue that engagements of CSR issues will benefit corporate financial performance (Orlitzky et al., 2003). Firstly, one prevalent argument favouring CSR is that CSR engagements will improve long-run interest (Davis, 1973). CRS activities reduce turnover and absenteeism and reduce crime, thereby providing a more conducive environment for business (Davis, 1973). Again, it will be advantageous to the company when stakeholder’s expectations are met. (McWilliams & Siegel, 2001). The legitimacy theory emphasises that companies must live up to the expectation of stakeholders since they operate under social contracts (Deegan & Unerman, 2011). Although restrictions for businesses will differ given different environments, however, there are still some common expectations. For example, companies are expected to make efforts to preserve the environment and protect the well-being of relevant stakeholders (Tinker & Neimark, 1987). For companies that fail to satisfy public expectations, assessing essential resources and receiving support from stakeholders may be difficult (Deegan & Unerman, 2011). Hence, these companies may further have trouble with financial performance due to the lack of important resources.
On the contrary, the accomplishment of social goals will enhance public image, which may help companies attract more investors and customers and quality employees. All these will bring about improved performance. Furthermore, fulfilling social contracts probably enables companies to partly remove some constraints (Cheng et al., 2014). Self-disciplined standards and responsible behaviours which match stakeholders' expectations may prevent the government from imposing new regulations, and may also avoid stress from sociocultural norms (Davis, 1973). Hence, a hypothesis is stated as:
H1a Higher CSR performance contributes to better corporate financial performance (CFP).
On the other hand, some arguments oppose the positive CSR-CFP relationship. Firstly, Investment in CSR activities will negatively affect cash flow available for investment in other profitable projects. This category of practices is regarded as expensive "goods", which will create direct expenditure for corporate operation and reduce the return to shareholders. Besides, it does not match the management objective of shareholders wealth maximisation. (Friedman, 1962; Davis, 1973). Secondly, CSR activities may weaken companies' ability to develop. These activities might dilute the business's economic productivity, shift managers' interests in some profitable investments, and reduce business strength in the marketplace.
Similarly, the involvement in social goals may reduce the business's capacity in global competitions since the investment in CSR activities will increase product prices (Davis, 1973). Thus, sales will decline and may eventually cause reduction in total profits. Furthermore, companies that engage in CSR practices may have nothing to benefit, especially in an oligopoly and monopolistic market structure (McWilliams & Siegel, 2001; Hainmueller et al., 2019). Based on the above analysis, another possible hypothesis of CSR-CFP relationship is formally proposed:
H1b Improved performance of CSR is negatively connected with CFP.
The Moderating Effect of National Culture
Different scholars have variously defined culture after it became a popular topic in research (Kroeber & Kluckhohn, 1952; Triandis, 1972; Hofstede, 2001). This study adopts the definition provided by Hofstede (2001). It describes culture as "the collective programming of the mind that distinguishes one group member or category of people from another" (pp.5). This definition classifies culture into four basic categories, which are shown as follows: power distance index (PDI), individualism (IDV), masculinity (MAS), and uncertainty avoidance index (UAI).
Macro-cultures may moderate the CSR-CFP relationship by influencing organisational culture, resource distribution or attraction to stakeholders. Therefore, organisational culture is a possible mediator to CSR-CFP linkage, especially as a closed relationship between macroculture and corporate culture (Hoecklin, 1995; Pothukuchi et al., 2002). Besides, companies may obtain better performance if their management practices match the macro-environment (Newman & Nollen, 1996). Also, culture may influence individual behaviour or individual cultural value (Gerhart, 2009). Hence, the moderating effect of macro-cultures may exist.
However, each dimension may have unique effects on how CSR practices influence financial performance. Power distance index is regarded as "the extent to which the less powerful members of institutions and organisations within a county expect power to be distributed unequally" (Hofstede et al., 2005). In general, individuals in small-PDI societies will think more critically about authorities' decisions, show limited dependence on more powerful classes, and emphasise abiding by the terms of ethics and equity. High PDI societies are characterised by privileges for the powerful, assessing good and right based on individual might and regarding citizens as unequal (Hofstede et al., 2005). In addition, high power distance will negatively influence performance from a group perspective (Daniels & Greguras, 2014). That is to say, societies with lower PDI scores would respond to CSR issues more positively than large-powerdistance societies (Husted, 2005; Ringov & Zollo, 2007). It means that stakeholders in largepower- distance communities will pay more attention to companies' profitability than ethical behaviour. Hence, in small-power-distance societies, companies with poor CSF will gain fewer resources and suffer more stress from stakeholders, so that it will be more difficult to improve performance. According to the above discussion, this study formally proposes:
H2 The power distance index will negatively moderate the CSR-CFP relationship.
Individualism, which is opposite to collectivism, is defined as the "society in which the ties between individuals are loose: everyone is expected to look after him or herself and his or her immediate family" (Hofstede et al., 2005). Citizens in individualistic societies focus more closely on personal interests, while collectivist societies pay more attention to public interests (Hofstede et al., 2005). Hence, managers in collectivist societies will engage CSR practice more supportively and emphasise long-term benefits for stakeholders when making decisions (Waldman et al., 2006; Ho et al., 2012). Besides, shareholders and the company are regarded as one group in collectivist societies, which means that managers in this culture will consider shareholders' needs in order of precedence over individual interests (Waldman et al., 2006; Husted & Allen, 2008). As individuals with high group spirit will be willing to struggle for group goals (Man & Lam, 2003), companies in collectivist cultures may gain more advantages from CSR engagements.
On the other hand, citizens in individualistic societies consider human rights more frequently (Husted & Allen, 2008), which means they may reflect more actively on CSR issues related to their self-interests and human rights (Woo & Jin, 2016). Also, in some CSR issues, such as environmental matters, groups in individualistic cultures act more supportive and have more capacity to advance sustainability (Husted, 2005). Besides, personal behaviour in individualistic societies complements native economic theories (Hofstede et al., 2005). In other words, stakeholders will encourage companies in matters that are beneficial to their interests while discouraging companies' decisions that damage their wealth (Deegan & Unerman, 2011). It means that shareholders and managers in individualistic societies will be driven to support CSR practices when these activities can benefit the business and reduce the negative influence of CSR engagement. Thus, this study, therefore, proposes two hypotheses:
H3a Low individualism extent will positively moderate the linkage between CSR and financial performance.
H3b High individualism extent will positively moderate the linkage between CSR and financial performance.
Masculinity, which is described as a society "where emotional gender roles are distinct: men are supposed to be assertive, tough, and focuses on material success, whereas women are supposed to be more modest, tender, and concerned with the quality of life", is the third cultural dimension (Hofstede et al., 2005). In masculine societies, individuals prefer aggressive goals. They pursue high paying jobs and have a lot of regard for social status. But for feminine societies, the opposite cultural dimension to masculinity, show different characteristics, including supporting the needy, being more balanced between men and women, and emphasising social relationships (Hofstede et al., 2005). Therefore, companies and customers in feminine culture will have a clearer perception of CSR (Hur & Kim, 2017). Besides, masculinity and femininity are related to gender organisation theory. In recent studies, females are regarded as a possible factor that improves corporate performance (Campbell & Mínguez-Vera, 2008) and social development (Grosser & Moon, 2019), although the influence may be small in some industries (Keenan et al., 2016). Hence, based on previous analysis, a hypothesis is proposed:
H4 In masculinity cultures, the CSR-CFP relationship will be negatively moderated.
The last cultural dimension is the uncertainty avoidance index (UAI), which represents "the extent to which the members of a culture feel threatened by ambiguous and unknown situations" (Hofstede et al., 2005). Countries in high UAI culture have more regulations and unwritten rules (Hofstede et al., 2005). As organisation culture cannot be essentially different from national culture (Hoecklin, 1995), companies in high UAI culture may tend to avoid risk and act more responsibly (Ho et al., 2012; Thanetsunthorn, 2015). Besides, UAI culture may influence customers' trust in such matters as online purchases (Ganguly et al., 2010; Hwang & Lee, 2012). Also, companies with high UAI culture will gain less customer satisfaction when their products do not meet consumers' expectations (Reimann et al., 2008). Therefore, low-CSR companies may have more limitations in high-UAI culture. A hypothesis is proposed:
H5 Uncertainty avoidance index will positively moderate the CSR-CFP relationship.
Methodology
Data Collection and Sample
The study utilised data set from 2009 to 2017 to avoid the effect of the world financial crisis of 2008.
Again, this study only includes companies with complete data within the analysis period to gain balanced panel data. Also, to collect a sample that can provide convincing conclusions for the whole population, this study chooses markets with a reasonable number of companies in Asia, Europe and North America.
The study identified 1,626 active companies with complete data. Data from two sources were merged to form a dataset with 13,008 cases. Because of the calculation of sales growth rate and the addition of lagged dependent variable into the regression model, the final analysis period was 2010 to 2017. Besides, the dataset is separated into eleven sectors according to the Industry Classification Benchmark (ICB). The final sample includes data from seventeen markets in developed countries and nine markets in developing countries. Furthermore, this study winsorised the final dataset to reduce the influence of extreme value.
Dependent Variable: Financial Performance
Financial performance is regarded as one of the most important outcomes of the company in one accounting period, and this can be classified into market-based performance and accounting-based performance. Market-based performance is related to corporate risk management, including the risk-adjusted return and standard deviation of operating income ratio (McGuire et al., 1988; Gonenc & Scholtens, 2017). Widely-used measures of accounting-based performance are the return on assets (ROA), return on equity (ROE), return on sales (ROS) and Tobin's Q (Waddock & Graves, 1997; Surroca et al., 2010). Besides, different stakeholders may have other highlights on good financial performance according to their interests. For example, shareholders pay more attention to earning per share (EPS), while managers or auditors are more sensitive to net cash flow (Li et al., 2019). Therefore, this study chooses ROA as the measure of financial performance, calculated by dividing net income by total assets. Furthermore, ROA is adopted in this study because ROA presents the efficiency with which a company employs its assets since being owned (McGuire et al., 1988). Also, other scholars used ROA to measure financial performance in relevant fields (Arora & Dharwadkar, 2011; Tang et al., 2012).
Independent Variable: Corporate Social Responsibility
This study chooses the ASSET4 ESG dataset due to the accessibility of data. Many scholars used ASSET4 ESG data to measure CSR issues in their studies (Cheng et al., 2014; Luo et al., 2015; Birkey et al., 2016; Qiu et al., 2016). ASSET4 ESG dataset is provided by Thomson Reuters, a Swiss-based institution with expertise in offering unbiased, accountable and systematic ESG measures for professional investors, researchers, and other individuals who use ESG information to make decisions or do research (Cheng et al., 2014).
Thomson Reuters measures public companies according to ESG regulations based on four categories (economic performance, environmental performance, social performance, and corporate governance performance) (Ribando & Bonne, 2010). ASSET4 provides data on energy consumed, recycling, and pollution spilling from the environmental perspective. Social data typically include employee turnover, employee safety, donations, and the number of female employees. In addition, the ASSET4 ESG dataset includes internal data and external activity information, including claims and reports that companies disclosed. This information shows the extent of communication towards external stakeholders (Hawn & Ioannou, 2016). This study assumes that all categories are equally crucial following the establishment by Cheng et al., (2014), and regards the weight ESG score provided by ASSET4 as CSR index for each focal company.
Moderating Variables: Culture
Four culture dimensions, power distance index (PDI), individualism (IDV), masculinity (MAS), and uncertainty avoidance index (UAI), are regarded as moderating variables in the CSR-CFP relationship in this study. Different cultural dimensions are scored according to various questions answered by respondents (Hofstede et al., 2005). Although the behaviour of respondents in life may not always match the answers they provide, the responses of each questionnaire still distinguish individual attitudes toward the world.
These variables are unchanged during the research period due to the assumption that cultures maintain stability and change slowly. However, this assumption still needs to be considered carefully (McSweeney, 2002), as recent remarkable changes may influence citizens' attitudes or behaviour toward some matters (Ogliastri, 1998). Besides, the fact that cultures may be heterogeneous within one country is another drawback of Hofstede's method (Hofstede et al., 2005). Nevertheless, many studies adopted his measures to analyse how institutional factors affect corporate operation (Licht et al., 2005), stakeholders' preference (Williams & Zinkin, 2008; Ramasamy & Yeung, 2009), CSR engagements (Kim & Kim, 2010), and other business research topics.
Control Variables
Many variables need to be controlled in responsibility-performance research, but this study mainly controls company-level variables. Firstly, liquidity is controlled. According to signalling theory, companies with a high liquidity ratio tend to positively send good signals to external stakeholders about their capacities to achieve short-term financial obligations (Jennifer & Taylor, 2007). Furthermore, as a high liquidity ratio implies reasonable operating statuses for business (Wallace & Naser, 1995), there may be a positive liquidity-ROA relationship.
Secondly, this study includes sales growth rate as a control variable. Companies with high sales growth rates may have more resources to promote a better internal environment and motivate employees (Murillo & Lozano, 2006). Besides, because sales revenues are highly related to operating income, there is likely a positive relationship between ROA and sales growth rate. Also, enhancing CSR performance may improve customer satisfaction and increase market value (Luo & Bhattacharya, 2006). Thus, adding the growth rate into the regression model can reduce the probability of endogeneity.
The third control variable is the firm size. Large companies will face higher reputation risk if they suffer scandals related to CSR issues, so they will practice more actively and voluntarily disclosure more information for external stakeholders (Deegan & Unerman, 2011). Besides, they may want to escape the attention of government regulations or non-government campaigns (Tang et al., 2012).
Fourthly, the capital structure also is a crucial firm-specific factor. Financial leverage will increase the risk for shareholders, enhance the expected return on the common stock, and cause conflicts among stakeholders (Harris & Raviv, 1991). Besides, as stakeholders emphasise the negative influence of high financial leverage, CSR practices' benefits may be reduced in companies with high financial leverage (Mishra & Modi, 2013). Thus, this study controls the effect of financial leverage through debt to equity ratio.
The fifth control variable is Research and development (R&D) disclosure. R&D investment may affect CSR-CFP relationship since it is an alternative for CSR practices (McWilliams & Siegel, 2001; Tang et al., 2012; Ali et al., 2017). Both R&D investment and CSR practices will occupy one company's resources. Besides, R&D investments potentially improve the company's competitive advantages, which mean R&D investment may undermine the benefits of CSR engagements. However, only half of companies provided information about R&D expenditure in the research period. It means that, within the researched sample, the willingness to disclosure R&D information is still not high. Hence, this study adopts the measure in Ho et al., (2012) research and uses a dummy variable to control the possible systematic unbalances between the groups that disclosed R&D information and those who did not.
The final control variable in this study is the multinomial dummy variables of industry groups. As the second section mentioned, many scholars argued that the business environment is one factor that will influence CSR activities (Aguinis & Glavas, 2012; Chih et al., 2010; Grewatsch & Kleindienst, 2017). Thus, according to ICB, this study categorises the industry into eleven groups and creates ten dummy variables to control industrial influence. In addition, one industry is dropped due to collinearity. These groups are technology, real estate, consumer staples, utilities, telecommunications, industrials, health care, financials, energy, consumer discretionary, and essential materials.
Empirical Model Design
The research dataset is panel data, which includes cross-section data and time-series data characteristics. After data collection, the next step is to design a reasonable regression model. Based on the Central Limit Theorem (Rosenblatt, 1956), if the sample set is large, the population distribution can be regarded as a normal distribution (Hang & Zhu, 2013). Because the dataset of this study has over 10,000 cases, this study considers the distribution of data as the normal distribution and, therefore, chooses the methodology of parameter estimation to design an empirical model. At first, this study tests whether the dependent variable is autocorrelated.
Furthermore, the autocorrelation function (ACF) and partial autocorrelation function (PACF) are calculated. The ACF values showed that ROA is trailing in the research period, while PACF cut-off is at lag one, which means ROA is an AR(1) process. Hence, prior-year ROA should be involved in the empirical model. Besides, as dynamic panel models are different from static panel models, this study also employs the specification test developed by Hausman (1978) to test whether static panel models are efficient but finds that pool ordinary least squares (OLS) model and random-effect model are unsuitable. However, because moderating variables and dummy variables are dropped in the fixed-effect model, the fixed-effect model is also unsuitable in this study. Also, because of endogeneity, instrument variables (IV) are needed in this study. Therefore, considering all the above matters, this study finally adopts the system generalised method of moments (GMM) model.
System GMM model is employed in dynamic panel data, which involves both level equation and first differences equation and expands the choice of instruments. System GMM estimation is developed by Blundell & Bond (1998) to improve the disadvantages of the usual first-differenced GMM model developed by Arellano & Bond (1991). One basic issue of system GMM estimator is endogeneity, therefore employing IV techniques can control the possible bias caused by endogeneity (Halaby, 2004). Instrument variables are high-correlated with the variable but not correlated with the error term (Boulouta & Pitelis, 2014). For endogenous variables, instruments are level variables or differenced variables at lagged two or more; predetermined variables' instruments are those at lagged one or more; while exogenous variable can be its instrument (Arellano & Bover, 1995).
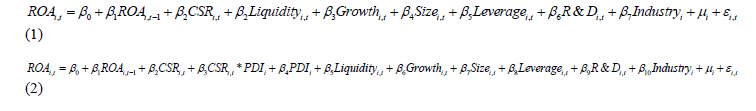
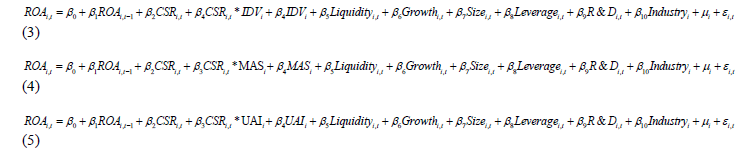
According to the above discussion, this study employed the dynamic panel data models developed by Hsiao (2022). Besides, this study assumed that all variables except lagged dependent variable are exogenous, whose instruments are themselves or differences between present value and prior value. For ROA, its instruments are lagged-three ROA and lagged-two difference. The measures of variables are shown at Table 1, and regression models are shown as follows:
| Table 1 Description Of Variables |
|
| ROA | Net income divided by total assets |
| CSR | Weighted ESG score |
| PDI | The power distance index score |
| IDV | Individualism score |
| MAS | Masculinity score; |
| UAI | The uncertainty avoidance index score |
| Liquidity | Current total assets divided by current total liability |
| Growth | Sales growth rate, which is calculated by the difference of net sales in year t divided by net sales at prior period |
| Size | The logarithm of total assets |
| Leverage | Debt to equity ratio |
| R&D | A dummy variable that represents whether the company disclose R&D information in year t (1 = available and 0 = missing) |
| Industry | A multinomial variable that represents the activity sector |
| μi | The unobservable heterogeneity |
| εi,t | The error term. |
Results
Summary Statistics
Descriptive statistics for the entire sample are shown in Table 2. Panel A provides the distribution of observations across markets. About forty per cent of the sample originates from European markets; approximately thirty per cent of companies originate from North American markets, and the remaining observations are companies from Asian markets. Although this study collects data from twenty-six markets, approximately half of the observations are companies from the United States, the United Kingdom and Japan.
| Table 2 Descriptive Statistics |
||||||||||
|---|---|---|---|---|---|---|---|---|---|---|
| Panel A. Sample distribution across countries | ||||||||||
| Market | N | Market | N | |||||||
| Belgium | 112 | Sweden | 408 | |||||||
| Canada | 752 | Singapore | 208 | |||||||
| Switzerland | 328 | Taiwan | 168 | |||||||
| United States | 2,824 | Australia | 536 | |||||||
| Germany | 496 | China | 376 | |||||||
| Spain | 328 | Brazil | 152 | |||||||
| Finland | 240 | Denmark | 152 | |||||||
| France | 560 | Italy | 232 | |||||||
| United Kingdom | 1,512 | Mexico | 136 | |||||||
| Hong Kong | 296 | Norway | 104 | |||||||
| Japan | 2,240 | Russian Federation | 96 | |||||||
| South Korea | 320 | Thailand | 128 | |||||||
| Netherlands | 192 | Turkey | 112 | |||||||
| Total | 13,008 | |||||||||
| Panel B. Sample distribution across sectors | ||||||||||
| Code | Industry categories | N | ||||||||
| 1 | Technology | 800 | ||||||||
| 2 | Real Estate | 160 | ||||||||
| 3 | Consumer Staples | 1,240 | ||||||||
| 4 | Utilities | 848 | ||||||||
| 5 | Telecommunications | 672 | ||||||||
| 6 | Industrials | 3,000 | ||||||||
| 7 | Health Care | 944 | ||||||||
| 8 | Financials | 184 | ||||||||
| 9 | Energy | 824 | ||||||||
| 10 | Consumer Discretionary | 2,904 | ||||||||
| 11 | Basic Materials | 1,432 | ||||||||
| Total | 13,008 | |||||||||
| Panel C. Descriptive statics for variables | ||||||||||
| Variable | N | Mean | Std.Dev. | Min | Max | |||||
| ROA | 14634 | 0.05 | 0.06 | -0.14 | 0.22 | |||||
| CSR | 13008 | 69.45 | 26.53 | 4.53 | 96.27 | |||||
| PDI | 13008 | 47.29 | 14.14 | 18 | 93 | |||||
| IDV | 13008 | 66.65 | 24.33 | 17 | 91 | |||||
| MAS | 13008 | 60.80 | 21.68 | 5 | 95 | |||||
| UAI | 13008 | 58.63 | 23.25 | 8 | 95 | |||||
| Liquidity | 13008 | 1.53 | 0.78 | 0.34 | 4.33 | |||||
| Growth | 13008 | 0.04 | 0.17 | -0.39 | 0.62 | |||||
| Size | 13008 | 6.97 | 0.57 | 5.64 | 8.37 | |||||
| Leverage | 13008 | 0.92 | 1.22 | -2.73 | 7.53 | |||||
| R&D | 13008 | 0.54 | 0.50 | 0 | 1 | |||||
The distributions of observations across sectors are shown at Panel B. The sample separates observations into eleven sectors based on ICB principle. Still, a major portion of observations are companies from four sectors: industrials, consumer discretionary, basic materials, and consumer staples.
Panel C presents descriptive statistics for variables of interest. The mean value of ROA is 4.7%, and the standard deviation is 0.06, indicating a slight variation across financial performances that companies obtained. For CSR score, the mean value is 69.45, while the standard deviation is 26.53, suggesting a significant variation exists across companies' social responsibility performance. For cultural dimensions, the mean value of PDI is 47.29, and the standard deviation is 14.13; the mean value of IDV is 66.65, and the standard deviation is 24.33; the mean value of MAS is 60.82, and the standard deviation is 21.67, and the mean value of UAI is 58.63, and the standard deviation is 23.25. It means that there are significant variations for cultural dimensions as well. The descriptive statistics of firm-specific variables are also shown in Panel C. The mean value of Growth is 3.9%; the mean value of Liquidity ratio is 1.525; the average value of Size is 6.97 and the mean value of leverage is 0.92. Besides, about fifty-five per cent of observations disclosed R&D information between 2010 to 2017. The standard deviation of each firm-level variables implies that variations across companies are not significant in the study sample.
Table 3 presents the results of Pearson correlation analysis for all variables of interest. The results indicate that all variables except R&D are correlated with ROA at 1% significant level, while the absolute values of all parameters are smaller than 0.2. Hence, there is not a serious multicollinearity problem in the model of CSR-CFP relationship analysis. ROA has a positive correlation with CSR (r=0.11). This result implies that CSR may have positive contributions to corporate performance. Besides, all moderating variables and control variables are significantly correlated with CSR. Also, cultural dimensions are correlated with each other. However, the high correlation parameters among cultural dimensions may cause serious multicollinearity if they are added to the regression model to test the moderating effect at the same time. Therefore, adding culture variables separately in the regression model can reduce the biases caused by multicollinearity.
| Table 3 Pearson Correlations Analysis |
||||||
|---|---|---|---|---|---|---|
| Variable | ROA | CSR | PDI | IDV | MAS | UAI |
| ROA | 1 | |||||
| CSR | 0.11*** | 1 | ||||
| PDI | -0.08*** | -0.22*** | 1 | |||
| IDV | 0.08*** | 0.24*** | -0.76*** | 1 | ||
| MAS | -0.11*** | -0.3*** | 0.15*** | -0.11*** | 1 | |
| UAI | -0.16*** | -0.13*** | 0.43*** | -0.42*** | 0.42*** | 1 |
| Liquidity | 0.14*** | -0.12*** | -0.03*** | 0.01 | 0.12*** | 0.09*** |
| Growth | 0.19*** | -0.08*** | 0.05*** | -0.020** | -0.03*** | -0.07*** |
| Size | -0.13*** | 0.36*** | 0.19*** | -0.13*** | -0.03*** | 0.09*** |
| Leverage | -0.18*** | 0.04*** | 0.02*** | 0.04*** | -0.01 | -0.02** |
| R&D | -0.01 | 0.11*** | 0.01 | -0.16*** | 0.14*** | 0.22*** |
| Variable | Liquidity | Growth | Size | Leverage | R&D | |
| Liquidity | 1 | |||||
| Growth | 0.01 | 1 | ||||
| Size | -0.24*** | 0.01 | 1 | |||
| Leverage | -0.25*** | -0.02*** | 0.17*** | 1 | ||
| R&D | 0.19*** | -0.03*** | 0.13*** | -0.09*** | 1 | |
Results of Regression Models
This study used STATA 12 to finish empirical analysis and did three tests to ensure consistent estimators. First, the Hansen test is vital in this study to check over-identification because too-many instruments will reduce the efficiency of results (Blundell & Bond, 1998). The over-identifying restrictions test employed in this study is developed by Hansen (1982). The test provides robust results, although many instruments will weaken the results. Third, except for the over-identification test, another condition is serial correlation. One assumption of the empirical model is that residuals do not have a serial correlation. In contrast, residuals in AR (1) must be correlated due to the introduction of lagged dependent variable (Arellano & Bond, 1991). Hence, if the instruments are valid, residuals in AR (2) should not have a serial correlation. Furthermore, this study also tested heteroskedasticity and used the robust function provided by STATA to make the resulting standard error consistent.
Table 4 presents the panel data analysis results. This study sets a significant level at 5%, which means the null hypothesis will be rejected if the p-value is smaller than 5%. As expected, the first-order serial correlation is significant at the 1% level; while the AR (2) test results are non-significant at the 5% significant level, indicating that the null hypothesis of no second-order serial correlation cannot be rejected. Besides, all results of the Hansen test of over-identifying restrictions show that the null hypothesis cannot be rejected at the 5% significant level, which means the instruments used in this study are reasonable. Thus, the system GMM is an appropriate model specification.
| Table 4 Empirical Results |
||||||||||||||||||
|---|---|---|---|---|---|---|---|---|---|---|---|---|---|---|---|---|---|---|
| Variable | (1) | (2) | (3) | (4) | (5) | (6) | (7) | (8) | (9) | |||||||||
| ROAi,t-1 | 0.530*** | 0.533*** | 0.532*** | 0.501*** | 0.514*** | 0.538*** | 0.539*** | 0.523*** | 0.531*** | |||||||||
| 0.000 | 0.000 | 0.000 | 0.000 | 0.000 | 0.000 | 0.000 | 0.000 | 0.000 | ||||||||||
| CSR | 0.001*** | 0.001*** | 0.001*** | 0.001*** | 0.001*** | 0.001*** | 0.000** | 0.001*** | 0.001*** | |||||||||
| 0.000 | 0.000 | 0.000 | 0.000 | 0.000 | 0.000 | 0.048 | 0.000 | 0.000 | ||||||||||
| PDI | 0.001*** | 0.001*** | ||||||||||||||||
| 0.000 | 0.000 | |||||||||||||||||
| IDV | 0.000*** | -0.001*** | ||||||||||||||||
| 0.000 | 0.000 | |||||||||||||||||
| MAS | 0.000** | 0.001** | ||||||||||||||||
| 0.037 | 0.022 | |||||||||||||||||
| UAI | 0.000*** | 0.000 | ||||||||||||||||
| 0.004 | 0.826 | |||||||||||||||||
| CSR*PDI | 0.000*** | |||||||||||||||||
| 0.003 | ||||||||||||||||||
| CSR*IDV | 0.000*** | |||||||||||||||||
| 0.001 | ||||||||||||||||||
| CSR*MAS | 0.000** | |||||||||||||||||
| 0.043 | ||||||||||||||||||
| CSR*UAI | 0.000 | |||||||||||||||||
| 0.436 | ||||||||||||||||||
| *** p<0.01, ** p<0.05, * p<0.1 | ||||||||||||||||||
| Variable | (1) | (2) | (3) | (4) | (5) | (6) | (7) | (8) | (9) | |||||||||
| Liquidity | 0.01*** | 0.01*** | 0.01*** | 0.009*** | 0.009*** | 0.01*** | 0.010*** | 0.009*** | 0.009*** | |||||||||
| 0.000 | 0.000 | 0.000 | 0.000 | 0.000 | 0.000 | 0.000 | 0.000 | 0.000 | ||||||||||
| Growth | 0.043*** | 0.043*** | 0.043*** | 0.043*** | 0.043*** | 0.044*** | 0.044*** | 0.043*** | 0.043*** | |||||||||
| 0.000 | 0.000 | 0.000 | 0.000 | 0.000 | 0.000 | 0.000 | 0.000 | 0.000 | ||||||||||
| Size | -0.055*** | -0.056*** | -0.056*** | -0.053*** | -0.05*** | -0.057*** | -0.056*** | -0.054*** | -0.056*** | |||||||||
| 0.000 | 0.000 | 0.000 | 0.000 | 0.000 | 0.000 | 0.000 | 0.000 | 0.000 | ||||||||||
| Leverage | -0.003*** | -0.003*** | -0.003*** | -0.003*** | -0.003*** | -0.003*** | -0.003*** | -0.003*** | -0.003*** | |||||||||
| 0.002 | 0.002 | 0.001 | 0.001 | 0.001 | 0.002 | 0.002 | 0.001 | 0.002 | ||||||||||
| R&D | 0.005** | 0.005** | 0.003 | 0.077*** | 0.107*** | 0.004* | 0.003 | 0.004 | 0.005* | |||||||||
| 0.034 | 0.041 | 0.194 | 0.000 | 0.000 | 0.088 | 0.263 | 0.175 | 0.059 | ||||||||||
| Constant | 0.329*** | 0.313*** | 0.35*** | 0.288*** | 0.273*** | 0.27*** | 0.383*** | 0.285*** | 0.337*** | |||||||||
| 0.000 | 0.000 | 0.000 | 0.000 | 0.000 | 0.000 | 0.000 | 0.000 | 0.000 | ||||||||||
| Year dummies | Yes | Yes | Yes | Yes | Yes | Yes | Yes | Yes | Yes | |||||||||
| Industry dummies | Yes | Yes | Yes | Yes | Yes | Yes | Yes | Yes | Yes | |||||||||
| AR(1) | 0.000 | 0.000 | 0.000 | 0.000 | 0.000 | 0.000 | 0.000 | 0.000 | 0.000 | |||||||||
| AR(2) | 0.072 | 0.070 | 0.071 | 0.102 | 0.116 | 0.063 | 0.065 | 0.070 | 0.069 | |||||||||
| Hansen test Observations |
0.223 13,008 |
0.387 13,008 |
0.313 13,008 |
0.090 13,008 |
0.056 13,008 |
0.446 13,008 |
0.430 13,008 |
0.260 13,008 |
0.271 13,008 |
|||||||||
| *** p<0.01, ** p<0.05, * p<0.1 | ||||||||||||||||||
The regression results of Model (1) are shown in Column 1. CSR is positively related to ROA (B=0.001, p<0.000), which verifies that CSR has a positive contribution to financial performance. Thus, H1a is supported while H1b is not supported. As expected, financial leverage is negatively related to ROA (B=-0,003, p<0.01), indicating a negative relationship between high risk to shareholders and corporate performance. In opposite, R&D disclosure is a positive factor to ROA (B=0.005, p<0.05). The result indicates that external information users will regard R&D expenditure as a positive signal to corporate performance.
Similarly, there is a significant positive relationship between sales growth rate and ROA (B =0.043, p<0.000), implying that companies with greater growth capacity will perform better. As expected, the liquidity ratio is positively related to ROA (B=0.010, p<0.000), indicating a positive relationship between the achievement of short-term obligations and corporate performance. However, the negative relationship between firm size and ROA is unexpected (B=- 0.055, p<0.000). This study measures firm size as the logarithm of total assets, while ROA equals net incomes divided by total assets. Hence, for companies with the same net incomes, the firm size will be negatively related to financial performance.
Besides, this study tested whether there are an annual effect and an industrial effect in Model (1). The null hypothesis of an annual effect is that all parameters of annual dummy variables equal to zero. As the p-value is smaller than 0.01, the null hypothesis is rejected, indicating an annual effect. Furthermore, as the null hypothesis, that all parameters of industrial dummy variables equal to zero, is rejected (p<0.01), there is also an industrial effect.
Colum 2 to 5 represent the regression results of separately adding culture variables into Model (1). All results show that CSR is positively related to CFP at 1% significant level, indicating that H1a is supported robustly. In addition, the results suggest that there is a positive relationship between power distance and ROA (B=0.001, p<0.000), while individualism, masculinity and uncertainty avoidance are negatively related to financial performance at the 5% significant level. Only the result of R&D disclosure in Colum 3 differs from previous analysis (i.e. the p-values is non-significant), other results of control variables have the same conclusions, which means that the results are reasonably robust.
The results of Model (2) to Model (5) are shown in Column 6 to 9. Model (2) tests the moderating effect of PDI. The interaction item CSR*PDI has a negative relationship with ROA, as expected (B=-0.000, p<0.01). As expected, Hypothesis 2 is supported. Model (3) tests the moderating effect of IDV, showing that there is a positive relationship between the interaction item CSR*IDV and ROA (B=0.000, p<0.01). The result is supported by Hypothesis 3b, and therefore Hypothesis 3a is rejected. Model (4) tests the moderating effect of MAS. CSR*MAS has a negative relationship with ROA (B=-0.000, p<0.05). As this study sets a significant level at 5%, Hypothesis 4 is supported. The relationship between interaction item CSR*UAI and ROA is non-significant (p>0.1), so the null hypothesis that the parameter does not equal zero cannot be rejected. Therefore, Hypothesis 5 is not supported.
The moderation diagrams are shown in Figure 1-4. These figures provide the linear tendency of marginal effect when moderating variables change. As Figure 1&2 showed, the marginal effect of CSR on ROA reduces when PDI increase, indicating that longitudinal data support the finding of Hypothesis 2.

Figure 1: The Moderating Effect Of Pdi.

Figure 2: The Moderating Effect Of Idv.
The continued marginal effect of CSR on ROA showed in Figure 3 presents an increasing tendency for increasing MAS. Therefore, Hypothesis 4 is not supported by longitudinal data.

Figure 3: The Moderating Effect Of Mas.
Figure 4 shows a negative relationship between UAI and the marginal effect of CSR. This figure also indicates that Hypothesis 5 is not supported.

Figure 4: The Moderating Effect Of Uai.
Conclusion
As the improvement of financial performance is a direct motivation for companies engaging CSR, scholars have developed studies to find evidence through various perspectives for decades, including theoretical framework development (by Carroll), qualitative studies (Ali et al.), empirical studies and meta-analysis. Based on the stakeholder theory, legitimacy theory, and resource-based theory, scholars who support CSR practices argued that CSR practices reduce constraints, beneficial for long-term interest and enhance stakeholders' satisfaction. Nevertheless, there were also arguments against CSR. Although CSR analysis has developed for a long time, many gaps still exist in relevant fields. The development in econometric models, such as the first-differenced GMM estimator and system GMM estimator, enables scholars to analyse dynamic panel data more efficiently. As there are requirements for a more dynamic method in CSR research, the number of studies which adopted GMM models though not numerous have increased in the last decade. Scholars have also suggested that cultural effect may be an important factor Scholars have also suggested for enhanced understanding of CSR.
This study aimed to investigate whether corporate social responsibility performance affects financial performance across countries and cultures in a dynamic way. This study has contributed to the gap of poor analysis on moderating effects of culture and the literature of CSR-CFP relationship. This study adopts system GMM estimator to analyse observations and found that companies with better CSR performance have better financial performance. Besides, this study contributes towards comparing the moderating effects of four cultural dimensions. And focuses on four cultural dimensions (i.e. power distance, individualism, masculinity, and uncertainty avoidance). PDI culture has a negative longitudinal moderating effect on the CSR-CFP relationship; IDV culture has a positive longitudinal moderating effect on the CSR-CFP relationship; while no evidence is found to support significant effects of MAS and UAI on the responsibility-performance relationship. As organisational culture does not differ from macroenvironmental culture, business behaviour norms likely follow the national social norms. In small-PDI societies, the acceptance of unequal distribution is less. As there are more requirements for good CSR performance in these societies, it is unequal if companies with poor CSR performance have better financial performance than those with good CSR performance.
Therefore, stakeholders within small-PDI societies will invest more resources in companies with good performance to reduce the imbalance. Also, the negative moderating effect of PDI can be explained by the argument that management practices would obtain better performance if the corporate behaviour matches the national culture. There are two potential reasons to explain the positive moderating effect of individualism culture. Firstly, citizens in individualistic societies will be more active in CSR issues related to self-interest and human rights (Woo & Jin), while these perspectives positively influence individual motivations. Thus, stakeholders, such as employees, will be more active to support the company. This situation could be explained by self-interest theory as well. Because CSR practices contribute to financial performance, shareholders and managers in high-individualism societies will be driven to support CSR practices to expand their self-wealth. The results of this study support the argument that the macro-environment will influence the CSR-CFP relationship.
There are some limitations. Because of missing data and time limitations, data collection was challenging. The distribution of observations is unbalanced. The majority of companies originate from the United Kingdom, the United States and Japan, and therefore some important variables do not obey the principle of the normal distribution. Besides, this study did not use the R&D investment ratio as a control variable. However, the R&D investment ratio is an important factor that may cause distortions of empirical results. Second, the measures of variables have room for improvement. The measures of cultural dimensions have limitations. Although it is widely accepted that culture changes slowly and continuously, omissions from the changes may distort the fact. Also, there may be heterogeneity within one country, while measures of cultural dimensions developed by Hofstede and Minkov, seldom took heterogeneity into account. Furthermore, the quality of CSR data is a possible limitation. As it is difficult to first-hand data, this study used ESG scores calculated by Thomson Reuters. Thomson Reuters ASSET4 data are widely used for investment purposes, and the results have been certificated by markets.
There are some suggestions for future research. Firstly, this work could be extended in the future by expanding the total number of observations and changing measuring methods to test the robustness of the conclusion. Secondly, the moderating effects of MAS and UAI need to be analysed deeper in the future. Although the relationship between ROA and interaction item CSR*MAS is negative at a 5% significant level in Model 4, there is an opposite relationship between MAS and the marginal effect of CSR on ROA. For UAI, the tendency of the marginal effect of CSR on ROA is also unexpected. This study assumed that the interaction effect is linear, but the influence of culture is complicated. Also, the linear interaction effect hypothesis is too strict, and there is less experience to believe that the interaction effect is linear (Hainmueller). Thus, scholars can develop a non-linear model to extend relevant research in future analysis. Thirdly, this study only analysed the basic cultural dimensions, while, for example, collectivism is classified into horizontal and vertical levels in recent studies.
Hence, future studies could analyse whether different aspects of collectivism and individualism would influence CSR-CFP relationship differently. Furthermore, the meta-analysis by Wang, Dou and Jia showed that the effect of CSR on CFP is more significant in developed countries. Again the location of companies (e.g. in European countries, North American countries, Asian countries, or other regions) may have different effects on the CSR-CFP relationship. This study did not separate the research sample into different regions, and, thus, the work can be extended in the future by analysing the differences among regions.
References
Aguinis, H., Glavas, A. (2012). What we know and don’t know about corporate social responsibility: A review and research agenda.Journal of Management,38(4), 932-968.
Indexed at, Google Scholar, Cross Ref
Ali, W., Frynas, J. G., Mahmood, Z. (2017). Determinants of corporate social responsibility (CSR) disclosure in developed and developing countries: A literature review.Corporate Social Responsibility and Environmental Management,24(4), 273-294.
Indexed at, Google Scholar, Cross Ref
Arellano, M., Bond, S. (1991). Some tests of specification for panel data: Monte Carlo evidence and an application to employment equations.The Review of Economic Studies,58(2), 277-297.
Indexed at, Google Scholar, Cross Ref
Arelleno, M., Bover, O. (1995). Another Look at instrumental variable estimation of error component models.Journal of Econometrics,68(1), 29-51.
Indexed at, Google Scholar, Cross Ref
Arora, P., & Dharwadkar, R. (2011). Corporate governance and corporate social responsibility (CSR): The moderating roles of attainment discrepancy and organization slack.Corporate governance: an international review,19(2), 136-152.
Indexed at, Google Scholar, Cross Ref
Baird, P. L., Geylani, P. C., & Roberts, J. A. (2012). Corporate social and financial performance re-examined: Industry effects in a linear mixed model analysis.Journal of business ethics,109(3), 367-388.
Indexed at, Google Scholar, Cross Ref
Berger?Walliser, G., & Scott, I. (2018). Redefining corporate social responsibility in an era of globalization and regulatory hardening.American Business Law Journal,55(1), 167-218.
Indexed at, Google Scholar, Cross Ref
Birkey, R.N., Michelon, G., Patten, D.M., & Sankara, J. (2016). Does assurance on CSR reporting enhance environmental reputation? An examination in the US context. InAccounting Forum, Taylor & Francis, 40(3), 143-152.
Indexed at, Google Scholar, Cross Ref
Blundell, R., & Bond, S. (1998). Initial conditions and moment restrictions in dynamic panel data models.Journal of econometrics,87(1), 115-143.
Indexed at, Google Scholar, Cross Ref
Boulouta, I., & Pitelis, C. N. (2014). Who needs CSR? The impact of corporate social responsibility on national competitiveness.Journal of Business Ethics,119(3), 349-364.
Indexed at, Google Scholar, Cross Ref
Campbell, K., & Mínguez-Vera, A. (2008). Gender diversity in the boardroom and firm financial performance.Journal of Business Ethics,83(3), 435-451.
Indexed at, Google Scholar, Cross Ref
Carroll, A.B. (1979). A three-dimensional conceptual model of corporate performance.Academy of Management Review,4(4), 497-505.
Indexed at, Google Scholar, Cross Ref
Cheng, B., Ioannou, I., & Serafeim, G. (2014). Corporate social responsibility and access to finance.Strategic Management Journal,35(1), 1-23.
Indexed at, Google Scholar, Cross Ref
Chih, H.L., Chih, H.H., & Chen, T.Y. (2010). On the determinants of corporate social responsibility: International evidence on the financial industry.Journal of Business Ethics,93(1), 115-135.
Indexed at, Google Scholar, Cross Ref
Crifo, P., Diaye, M. A., & Pekovic, S. (2016). CSR related management practices and firm performance: An empirical analysis of the quantity–quality trade-off on French data.International Journal of Production Economics,171, 405-416.
Indexed at, Google Scholar, Cross Ref
Daniels, M.A., & Greguras, G.J. (2014). Exploring the nature of power distance: Implications for micro-and macro-level theories, processes, and outcomes.Journal of Management,40(5), 1202-1229.
Indexed at, Google Scholar, Cross Ref
Davis, K. (1973). The case for and against business assumption of social responsibilities.Academy of Management Journal,16(2), 312-322.
Indexed at, Google Scholar, Cross Ref
Deegan, C., & Unerman, J. (2011). Financial accounting theory: European edition.
El Ghoul, S., Guedhami, O., Kwok, C.C., & Mishra, D.R. (2011). Does corporate social responsibility affect the cost of capital?.Journal of Banking & Finance,35(9), 2388-2406.
Indexed at, Google Scholar, Cross Ref
Flammer, C. (2015). Does corporate social responsibility lead to superior financial performance? A regression discontinuity approach.Management Science,61(11), 2549-2568.
Indexed at, Google Scholar, Cross Ref
Freeman, R.E. (1984). Strategic Management: A Stakeholder Approach, Boston, Pitman.
Friedman, M. (1962). Capitalism and Freedom, Chicago: University of Chicago.Gla ?veanu, VP (2014). Distributed creativity: Thinking outside the box of the creative.
Ganguly, B., Dash, S.B., Cyr, D., & Head, M. (2010). The effects of website design on purchase intention in online shopping: the mediating role of trust and the moderating role of culture.International Journal of Electronic Business,8(4-5), 302-330.
Indexed at, Google Scholar, Cross Ref
Gerhart, B. (2009). How much does national culture constrain organizational culture?.Management and Organization Review,5(2), 241-259.
Indexed at, Google Scholar, Cross Ref
Grewatsch, S., & Kleindienst, I. (2017). When does it pay to be good? Moderators and mediators in the corporate sustainability–corporate financial performance relationship: A critical review.Journal of Business Ethics,145(2), 383-416.
Indexed at, Google Scholar, Cross Ref
Grosser, K., & Moon, J. (2019). CSR and feminist organization studies: Towards an integrated theorization for the analysis of gender issues.Journal of Business Ethics,155(2), 321-342.
Indexed at, Google Scholar, Cross Ref
Gonenc, H., & Scholtens, B. (2017). Environmental and financial performance of fossil fuel firms: A closer inspection of their interaction.Ecological Economics,132, 307-328.
Indexed at, Google Scholar, Cross Ref
Hainmueller, J., Mummolo, J., & Xu, Y. (2019). How much should we trust estimates from multiplicative interaction models? Simple tools to improve empirical practice.Political Analysis,27(2), 163-192.
Indexed at, Google Scholar, Cross Ref
Halaby, C.N. (2004). Panel models in sociological research: Theory into practice.Annu Rev Sociol,30, 507-544.
Indexed at, Google Scholar, Cross Ref
Hang, G., & Zhu, G. (2013). Small sample interval estimation of non-normal population. Journal of Mathematical Medicine, 26(06), 681-682.
Hansen, L.P. (1982). Large sample properties of generalized method of moments estimators.Econometrica: Journal of the econometric society, 1029-1054.
Indexed at, Google Scholar, Cross Ref
Harris, M., & Raviv, A. (1991). The theory of capital structure.The Journal of Finance,46(1), 297-355.
Indexed at, Google Scholar, Cross Ref
Hausman, J.A. (1978). Specification tests in econometrics.Econometrica: Journal of the Econometric Society, 1251-1271.
Indexed at, Google Scholar, Cross Ref
Hawn, O., & Ioannou, I. (2016). Mind the gap: The interplay between external and internal actions in the case of corporate social responsibility.Strategic Management Journal,37(13), 2569-2588.
Indexed at, Google Scholar, Cross Ref
Ho, F.N., Wang, H.M.D., & Vitell, S.J. (2012). A global analysis of corporate social performance: The effects of cultural and geographic environments.Journal of Business Ethics,107(4), 423-433.
Indexed at, Google Scholar, Cross Ref
Hoecklin, L. (1995).Managing cultural differences. Addison Wesley Longman.
Hofstede, G. (2001).Culture's consequences: Comparing values, behaviors, institutions and organizations across nations. Sage Publications.
Hofstede, G., Hofstede, G.J., & Minkov, M. (2005).Cultures and organizations: Software of the mind. New York: Mcgraw-hill, 2.
Indexed at, Google Scholar, Cross Ref
Hsiao, C. (2022).Analysis of panel data. Cambridge University Press.
Indexed at, Google Scholar, Cross Ref
Hull, C.E., & Rothenberg, S. (2008). Firm performance: The interactions of corporate social performance with innovation and industry differentiation.Strategic Management Journal,29(7), 781-789.
Indexed at, Google Scholar, Cross Ref
Hur, W.M., & Kim, Y. (2017). How does culture improve consumer engagement in CSR initiatives? The mediating role of motivational attributions.Corporate Social Responsibility and Environmental Management,24(6), 620-633.
Indexed at, Google Scholar, Cross Ref
Husted, B.W. (2005). Culture and ecology: A cross-national study of the determinants of environmental sustainability.MIR: Management International Review, 349-371.
Husted, B.W., & Allen, D.B. (2008). Toward a model of cross-cultural business ethics: The impact of individualism and collectivism on the ethical decision-making process.Journal of Business Ethics,82(2), 293-305.
Indexed at, Google Scholar, Cross Ref
Hwang, Y., & Lee, K.C. (2012). Investigating the moderating role of uncertainty avoidance cultural values on multidimensional online trust.Information & Management,49(3-4), 171-176.
Indexed at, Google Scholar, Cross Ref
Ioannou, I., & Serafeim, G. (2012). What drives corporate social performance? The role of nation-level institutions.Journal of International Business Studies,43(9), 834-864.
Indexed at, Google Scholar, Cross Ref
Jennifer, H.L.C., & Taylor, M.E. (2007). An empirical analysis of triple bottom?line reporting and its determinants: evidence from the United States and Japan.Journal of International Financial Management & Accounting,18(2), 123-150.
Indexed at, Google Scholar, Cross Ref
Keenan, J.C., Kemp, D.L., & Ramsay, R.B. (2016). Company–community agreements, gender and development.Journal of Business Ethics,135(4), 607-615.
Indexed at, Google Scholar, Cross Ref
Kim, Y., & Kim, S.Y. (2010). The influence of cultural values on perceptions of corporate social responsibility: Application of Hofstede’s dimensions to Korean public relations practitioners.Journal of Business Ethics,91(4), 485-500.
Indexed at, Google Scholar, Cross Ref
Kroeber, A.L., & Kluckhohn, C. (1952). Culture: A critical review of concepts and definitions.Papers. Peabody Museum of Archaeology & Ethnology, Harvard University.
Indexed at, Google Scholar, Cross Ref
Li, K., Khalili, N.R., & Cheng, W. (2019). Corporate social responsibility practices in China: Trends, context, and impact on company performance.Sustainability,11(2), 354.
Indexed at, Google Scholar, Cross Ref
Licht, A.N., Goldschmidt, C., & Schwartz, S.H. (2005). Culture, law, and corporate governance.International Review of Law and Economics,25(2), 229-255.
Indexed at, Google Scholar, Cross Ref
Luo, X., & Bhattacharya, C. B. (2006). Corporate social responsibility, customer satisfaction, and market value.Journal of Marketing,70(4), 1-18.
Indexed at, Google Scholar, Cross Ref
Luo, X., Wang, H., Raithel, S., & Zheng, Q. (2015). Corporate social performance, analyst stock recommendations, and firm future returns.Strategic Management Journal,36(1), 123-136.
Indexed at, Google Scholar, Cross Ref
Man, D.C., & Lam, S.S. (2003). The effects of job complexity and autonomy on cohesiveness in collectivistic and individualistic work groups: a cross?cultural analysis.Journal of Organizational Behavior: The International Journal of Industrial, Occupational and Organizational Psychology and Behavior,24(8), 979-1001.
Indexed at, Google Scholar, Cross Ref
McGuire, J.B., Sundgren, A., & Schneeweis, T. (1988). Corporate social responsibility and firm financial performance.Academy of Management Journal,31(4), 854-872.
Indexed at, Google Scholar, Cross Ref
McSweeney, B. (2002). Hofstede’s model of national cultural differences and their consequences: A triumph of faith-a failure of analysis.Human Relations,55(1), 89-118.
Indexed at, Google Scholar, Cross Ref
McWilliams, A., & Siegel, D. (2001). Corporate social responsibility: A theory of the firm perspective.Academy of management review,26(1), 117-127.
Indexed at, Google Scholar, Cross Ref
Mishra, S., & Modi, S.B. (2013). Positive and negative corporate social responsibility, financial leverage, and idiosyncratic risk.Journal of Business Ethics,117(2), 431-448.
Indexed at, Google Scholar, Cross Ref
Murillo, D., & Lozano, J.M. (2006). SMEs and CSR: An approach to CSR in their own words.Journal of Business Ethics,67(3), 227-240.
Indexed at, Google Scholar, Cross Ref
Newman, K.L., & Nollen, S.D. (1996). Culture and congruence: The fit between management practices and national culture.Journal of international Business Studies,27(4), 753-779.
Indexed at, Google Scholar, Cross Ref
Ogliastri, E. (1998). Culture and organizational leadership in Colombia.Organisation Science,14(6), 686-706.
Orlitzky, M., Schmidt, F.L., & Rynes, S L. (2003). Corporate social and financial performance: A meta-analysis.Organization Studies,24(3), 403-441.
Indexed at, Google Scholar, Cross Ref
Orlitzky, M., Siegel, D.S., & Waldman, D.A. (2011). Strategic corporate social responsibility and environmental sustainability.Business & Society,50(1), 6-27.
Indexed at, Google Scholar, Cross Ref
Peloza, J. (2009). The challenge of measuring financial impacts from investments in corporate social performance.Journal of Management,35(6), 1518-1541.
Indexed at, Google Scholar, Cross Ref
Pothukuchi, V., Damanpour, F., Choi, J., Chen, C. C., & Ho Park, S. (2002). National and organizational culture differences and international joint venture performance.Journal of International Business Studies,33(2), 243-265.
Indexed at, Google Scholar, Cross Ref
Qiu, Y., Shaukat, A., & Tharyan, R. (2016). Environmental and social disclosures: Link with corporate financial performance.The British Accounting Review,48(1), 102-116.
Indexed at, Google Scholar, Cross Ref
Rabello, R.C.C., Nairn, K., & Anderson, V. (2018). Rethinking corporate social responsibility in capitalist neoliberal times. InRedefining Corporate Social Responsibility. Emerald Publishing Limited.
Indexed at, Google Scholar, Cross Ref
Ramasamy, B., & Yeung, M. (2009). Chinese consumers’ perception of corporate social responsibility (CSR).Journal of Business Ethics,88(1), 119-132.
Indexed at, Google Scholar, Cross Ref
Reimann, M., Lunemann, U.F., & Chase, R.B. (2008). Uncertainty avoidance as a moderator of the relationship between perceived service quality and customer satisfaction.Journal of Service Research,11(1), 63-73.
Indexed at, Google Scholar, Cross Ref
Ribando, J.M., & Bonne, G. (2010). A new quality factor: Finding alpha with ASSET4 ESG data.Starmine Research Note, Thomson Reuters,31.
Ringov, D., & Zollo, M. (2007). The impact of national culture on corporate social performance.Corporate Governance: The International Journal of Business in Society.
Indexed at, Google Scholar, Cross Ref
Robertson, C.J., & Crittenden, W.F. (2003). Mapping moral philosophies: Strategic implications for multinational firms.Strategic Management Journal,24(4), 385-392.
Indexed at, Google Scholar, Cross Ref
Rosenblatt, M. (1956). A central limit theorem and a strong mixing condition.Proceedings of the National Academy of Sciences of the United States of America,42(1), 43.
Indexed at, Google Scholar, Cross Ref
Ruf, B.M., Muralidhar, K., Brown, R.M., Janney, J.J., & Paul, K. (2001). An empirical investigation of the relationship between change in corporate social performance and financial performance: A stakeholder theory perspective.Journal of Business Ethics,32(2), 143-156.
Indexed at, Google Scholar, Cross Ref
Servaes, H., & Tamayo, A. (2013). The impact of corporate social responsibility on firm value: The role of customer awareness.Management Science,59(5), 1045-1061.
Indexed at, Google Scholar, Cross Ref
Surroca, J., Tribo, J.A., & Waddock, S. (2010). Corporate responsibility and financial performance: The role of intangible resources.Strategic Management Journal,31(5), 463-490.
Indexed at, Google Scholar, Cross Ref
Tang, Z., Hull, C. E., & Rothenberg, S. (2012). How corporate social responsibility engagement strategy moderates the CSR–financial performance relationship.Journal of Management STUDIES,49(7), 1274-1303.
Indexed at, Google Scholar, Cross Ref
Thanetsunthorn, N. (2015). The impact of national culture on corporate social responsibility: evidence from cross-regional comparison.Asian Journal of Business Ethics,4(1), 35-56.
Indexed at, Google Scholar, Cross Ref
Tinker, T., & Neimark, M. (1987). The role of annual reports in gender and class contradictions at General Motors: 1917–1976.Accounting, Organizations and Society,12(1), 71-88.
Indexed at, Google Scholar, Cross Ref
Triandis, H.C. (1972). The analysis of subjective culture.
Indexed at, Google Scholar, Cross Ref
Van der Laan, G., Van Ees, H., & Van Witteloostuijn, A. (2008). Corporate social and financial performance: An extended stakeholder theory, and empirical test with accounting measures.Journal of Business Ethics,79(3), 299-310.
Indexed at, Google Scholar, Cross Ref
Waddock, S.A., & Graves, S.B. (1997). The corporate social performance–financial performance link.Strategic Management Journal,18(4), 303-319.
Indexed at, Google Scholar, Cross Ref
Waldman, D.A., Sully de Luque, M., Washburn, N., House, R.J., Adetoun, B., Barrasa, A., & Wilderom, C.P. (2006). Cultural and leadership predictors of corporate social responsibility values of top management: A GLOBE study of 15 countries.Journal of International Business Studies,37(6), 823-837.
Indexed at, Google Scholar, Cross Ref
Wallace, R.O., & Naser, K. (1995). Firm-specific determinants of the comprehensiveness of mandatory disclosure in the corporate annual reports of firms listed on the stock exchange of Hong Kong.Journal of Accounting and Public policy,14(4), 311-368.
Indexed at, Google Scholar, Cross Ref
Wang, H., & Qian, C. (2011). Corporate philanthropy and corporate financial performance: The roles of stakeholder response and political access.Academy of Management Journal,54(6), 1159-1181.
Indexed at, Google Scholar, Cross Ref
Wang, Q., Dou, J., & Jia, S. (2016). A meta-analytic review of corporate social responsibility and corporate financial performance: The moderating effect of contextual factors.Business & Society,55(8), 1083-1121.
Indexed at, Google Scholar, Cross Ref
Williams, G., & Zinkin, J. (2008). The effect of culture on consumers' willingness to punish irresponsible corporate behaviour: applying Hofstede's typology to the punishment aspect of corporate social responsibility.Business Ethics: A European Review,17(2), 210-226.
Indexed at, Google Scholar, Cross Ref
Woo, H., & Jin, B. (2016). Culture doesn’t matter? The impact of apparel companies’ corporate social responsibility practices on brand equity.Clothing and Textiles Research Journal,34(1), 20-36.
Indexed at, Google Scholar, Cross Ref
Wood, D.J. (1991). Corporate social performance revisited.Academy of management review,16(4), 691-718.
Indexed at, Google Scholar, Cross Ref
Wood, D.J. (2010). Measuring corporate social performance: A review.International Journal of Management Reviews,12(1), 50-84.
Indexed at, Google Scholar, Cross Ref
Received: 23-Feb-2022, Manuscript No. JIBR-22-11368; Editor assigned: 25-Feb-2022, PreQC No. JIBR-22-11368(PQ); Reviewed: 11- Mar-2022, QC No. JIBR-22-11368; Revised: 03-May-2022, Manuscript No. JIBR-22-11368(R); Published: 10-May-2022