Research Article: 2021 Vol: 24 Issue: 6S
Impacts of Monetary Policy and Fiscal Policy on Gdp Growth of Vietnam
Phan Thi Linh, Banking University Ho Chi Minh City (BUH)
Abstract
Economic growth has a significant role for every country. It is the first necessary condition to overcome poverty and backwardness. According to the General Statistics Office, Vietnam's Gross Domestic Product (GDP) in 2020 reached 5.9%/year, bringing the GDP per capital to about 2,750 USD/year. Vietnam needs to achieve this result; economic policies play a huge role, including monetary and fiscal policies. For these two policies to promote the economic growth regulation more effectively in the following years, this article analyzes the impacts of monetary policy and fiscal policy on GDP growth in Vietnam in 2010-2020 using the structural Vector Autoregressive (VAR) model. The results show that monetary policy and fiscal policy positively impact GDP, and monetary policy has a more extensive and longer-lasting impact on GDP growth than fiscal policy.
Keywords
Monetary, Policy, Fiscal, GDP, Vietnam and BUH
Introduction
During the 2010-2020 period, there were many economic volatilities, especially within the Covid-19 pandemic. According to the political report of the 13th National Congress of the Communist Party of Vietnam in October 2020 is for the whole 2010-2020 period. Vietnam had a GDP growth rate of about 5.9%/year, within the group of high-growth countries in the region and the world. GDP scale increased 2.4 times, from 116 billion USD in 2010 to 268.4 billion USD in 2020. GDP per capita increased from 1,331 USD in 2010 to about 2,750 USD in 2020. The achievement results from monetary and fiscal policies applied adequately in practice and implemented effectively.
Currently, there are many studies on the role of monetary policy and fiscal policy: studies on policy implementation of Bui (2012); Dao (2012), the review of the performance of monetary policy and fiscal policy by To (2012); Duong (2012), National Financial Supervisory Commission (2012); research on macroeconomic stability goals by Nguyen (2012); Tran (2015); Bui (2013), studies evaluating the importance of monetary policy and fiscal policy from the perspective of statistical analysis by Do, et al., (2014); Nguyen (2013); Dao (2013); research on analysis of Government's spending structure and Vietnam's economic growth impacting on the policy of Pham (2009); research by Dang (2010) on simulating the impact of the Government's demand stimulus policy through econometric models; analyses by Ha (2008); Bui (2009); Tran, et al., (2010) on evaluating the effectiveness of monetary policy through regression of money demand function for Vietnam using VAR and VECM models; research by Bui (2009) about quantitative analysis of the impact of monetary policy on some macroeconomic variables of Vietnam. From the review of studies in Vietnam, these studies have not assessed the level and duration of the influence of monetary and fiscal policy on GDP growth. This article aims to study how changes in money supply (representing monetary policy) and government spending (representing fiscal policy) affect economic growth in terms of magnitude and duration. Through the collected secondary data, the article uses the VAR method to test the relationship and extent of the impact of monetary and fiscal policy on Vietnam's economic growth. The research article reviewed the current status of monetary policy and fiscal policy in 2010-2020. It assessed the impact of monetary policy and fiscal policy on GDP growth through a structural VAR model.
Literature Review
Fiscal Policy and Monetary Policy of Vietnam in the Period 2010-2020
Fiscal Policy
In the 2010-2020 periods, when the macro-economy is stable 1 and inflation is controlled at a low level, macroeconomic indicators significantly improved. It is also the improvement in growth quality, investment efficiency, and labor productivity. Economic growth gradually reduces dependence on resource exploitation, credit extension, step by step based on science, technology, and innovation. The currency and foreign exchange markets are stable; ensure credit capital for the economy, focusing on the manufacturing sector, especially priority sectors by Salamzadeh (2020).
According to a Ministry of Finance of Vietnam report, the structure of state budget revenue and expenditure changed positively in increasing the proportion of internal income, increasing the proportion of spending on development investment, and reducing the proportion of recurrent expenditure. The state budget deficit decreased from an average of 5.4% of GDP. In 2011-2015 to 3.5% in 2016-2019; in 2020, the rate is 4.99% of GDP. The public debt ratio to GDP increased from 51.7% at the end of 2010 to 63.7% in 2016. The public debt ratio decreased to 55% of GDP by 2019 and grew to 56.8% in 2020, maintaining macroeconomic stability and improving the national credit rating. The economy's primary balances in terms of savings - consumption, savings-investment, energy, food continue to be ensured, contributing to firmly consolidating the macro-economic stability. The savings rate to GDP in the period 2011-2020 is about 29%. Besides, Vietnam continues mobilizing more resources to implement a strategic breakthrough in infrastructure.
Unit: %
| Table 1 Variations of GDP, government budget, and inflation rate of vietnamIn 2010-2020 |
|||||||||||
|---|---|---|---|---|---|---|---|---|---|---|---|
| Year | 2010 | 2011 | 2012 | 2013 | 2014 | 2015 | 2016 | 2017 | 2018 | 2019 | 2020 |
| GDP | 6,4 | 6,2 | 5,2 | 5,4 | 5,9 | 6,6 | 6,2 | 6,8 | 7,0 | 7,1 | 6,8 |
| Government Budget | 0,58 | 0,29 | 8,23 | 1,65 | 1,02 | 0,96 | 1,04 | 0,93 | 1,09 | 1,06 | 1,12 |
| Inflation rate | 1,9 | 18,1 | 6,8 | 6,1 | 1,8 | 0,6 | 3,3 | 2,6 | 2,9 | 5,2 | 3,2 |
Table 1 showed that the rising public debt is becoming a concern for the Government, increasing mainly due to the need to cover the budget deficit primarily from domestic capital mobilization. Total general and publicly guaranteed debt was 50.43% of GDP by 2010, increasing to 56.8% in 2020. Contingent liability in the banking and SOE sectors increases pressure on public debt sustainability by Omolade & Ngalawa (2016).
In 2020, the outbreak of the Covid-19 pandemic comprehensively and extensively affected the global economy, causing the world economy to fall into a severe recession. The world commodity market had the effect of narrowing aggregate supply and aggregate demand on a large scale, disrupting the global supply chain, causing irregular and unpredictable fluctuations in commodity prices, especially fuel prices such as gasoline. The market price level in 2020 was influenced by supply and demand factors that change continuously and complicatedly before the development of the Covid-19. However, Vietnam needs to harmonize common goals such as ensuring the market price level, controlling inflation, and removing difficulties for businesses. The Government and the prime minister directed a series of timely solutions on price management and administration to ministries, branches, and localities to coordinate carefully and closely. As a result, the average Consumer Price Index (CPI) in 2020 only increased by 3.23% compared to the average in 2019, much lower than the target set by the National Assembly of less than 4%; average core inflation in 2020 increased by 2.31% compared to the average in 2019 by Ricci (2019).
In general, along with other macroeconomic policies, when implementing the goal of promoting growth, monetary policy is implemented in loosening. When fighting inflation, it is implemented in tightening by Carraher & Carraher (2006).
Monetary policy: In the context that the domestic economy is more extensively integrated with the world economy, especially from 2010 onwards, leading to faster and stronger international trade and capital movement, the formulation, and management of monetary policy becomes complicated and more complex by Ulman & Soltés (2015). The domestic and foreign economic context has many changes due to the influence of the Covid-19 pandemic. Monetary policy is implemented flexibly through adjusting the monetary policy tools such as interest rates, reserve requirements, open market operations.
Interest Rates: The State Bank of Vietnam has gradually loosened regulations on interest rates. Generally transferring from operating by issuing the ceiling lending interest rate and the difference between the average lending rate and the average deposit interest rateto the regulation, credit institutions agree with customers on lending interest rates within a specific range and completely liberalize deposit interest rates VND.
As for the interest rate tool, after the economy's interest rates were liberalized, to control the economy's interest rates, the State Bank used some market-oriented interest rates, which are: (i) Prime rate, published monthly by the State Bank; (ii) The refinancing interest rate and rediscount rate are established as a desirable range for the interbank interest rate; (iii) Open market interest rates. Depending on economic growth and inflation, the State Bank has flexibly adjusted interest rates. According to Decision No. 1728/QD-NHNN dated September 30, 2020, the refinancing interest rate is 4%, the discount rate is 2.5%.
In this condition, the inflation forecast tends to decrease. The interest rate tool has been actively operated downward in line with the decrease of inflation and expected inflation. At the same time, ensuring a positive real interest rate to protect with the risk of inflation rising again by Drobyazko, et al., (2019). Adjustments to the monetary policy management of the State Bank are always announced in advance, helping to orient market activities. Thus, both businesses and individuals can benefit from the adjustments.
Reserve Requirements: The required reserve ratio has been adjusted more and more flexibly in line with monetary policy objectives and financial developments in each period. In the period 2010-2020, the State Bank has continuously increased the required reserve ratio in foreign currencies from 5% to 15% and kept the required reserve ratio in VND at 6% to limit the flow of money from VND to USD and restrict credit institutions from mobilizing foreign currency deposits to send abroad.
In 2018-2020, the State Bank of Vietnam issued Decision No. 1158/QD-NHNN, applied June 1, 2018. It was keeping the required reserve ratio for deposits in VND at 3% for demand deposits and deposits for less than 12 months and at 1% for deposits for the term over 12 months to stabilize the money market in the context that the system's capital in VND is not yet abundant. However, foreign currency credit tends to increase sharply due to high deposits and loans and potential credit risks if exchange rates fluctuate. The State Bank has adjusted for foreign currency deposits to contribute to rising costs, reducing the motivation to mobilize foreign currency, thereby restraining the growth of foreign currency credit, and at the same time contributing to lowering the dollarization of the economy.
Open Market Operations: Circular No. 42/2015/TT-NHNN dated December 31, 2015, provides open market operations. Clause 3, article 14 on bidding methods: For the issuance of State Bank bills through open market operations, the State Bank follows the interest rate bidding method; in case of necessity, based on the objectives of monetary policy management in each period and money market developments, the State Bank consider issuing State Bank bills by volume bidding method. Unit: billions of VND.

Figure 1: Open Market Operations in 2020
Source: State Bank of Vietnam
Figure 1 showed that, in 2020, the State Bank was very limited in using open market operations to inject or withdrawal money. In this context, the liquidity in the banking system is abundant thanks to an appropriate monetary policy combined with relatively weak credit demand, in which a large amount of VND is pumped to the market in response to a large amount of USD purchased.
Along with the successful implementation of open market operations, the Stock Exchange also constantly strengthens the propaganda and training on open market operations for members with various forms in the mass media to help the public understand more about open market operations. This circular is an essential factor in the structure of open market operations of the State Bank in recent years. At the same time, it further highlights the superiority of open market operational tools in the management of monetary policy in Vietnam.
Exchange Rate: According to the report of the State Bank, in the period 2010-2020, the exchange rates of VND/$; VND/€; VND/£ is relatively stable. Based on a central exchange rate mechanism, which closely follows the movements of the domestic and international foreign currency markets. And the exchange rate fluctuates within the allowable range, while the foreign currency market is stable, and foreign currency liquidity is ensured despite the fluctuations of $; €; £ and many other world currencies by Abuselidze (2019).
In 2010-2020, the central rate increased only about 1.5%, while the USD buying-selling price at banks has decreased slightly compared to the end of 2018, which means that the VND has increased somewhat compared to the USD. Maintaining the stability of the exchange rate and foreign exchange market, the State Bank also took advantage of buying more than 20 billion USD to raise the national foreign exchange reserve to a high record of 79.9 billion USD, 2.5 times higher compared to the end of 2015.
There was a flexible exchange rate management mechanism in the 2018-2020 period. The State Bank continues to operate interest rates and exchange rates in line with the macro balance, inflation, market movements, and monetary policy objectives to stabilize the market, increase the State's foreign exchange reserves when conditions and context are appropriate. In 2020, the record of foreign exchange reserves was a significant buffer for the economy against external shocks. Accordingly, Vietnam has an increase in foreign currency reserves. The exchange rate helps foreign investors have more confidence in Vietnam's financial capacity. On the other hand, it is an essential resource for the State Bank to intervene to stabilize the foreign exchange market in case of necessity by Omolade & Mukolu (2018).
However, keeping the exchange rate stable in 2019 also increased the VND value concerning major partners' currencies. In 2020, there are many countries in the region. Major economies continued the devaluation of the local currency to support exports in the context of complicated trade conflicts due to the impact of the Covid-19. Therefore, a slight depreciation of VND is a reasonable step because if VND continues to hold its value, it will create certain disadvantages for Vietnam's exports. In the overall context and the balance of Vietnam-US trade relations. Thus, the adjustment level of VND in 2020 will be in the range of 1%-2%. And Vietnam will gradually adjust it depending on the movements in the world.
Methods of Research
Data Collection and Processing
The author had the database used in the study collected from the sources of Rifinitiv Datatreams, the General Statistics Office of Vietnam, the Ministry of Finance of Vietnam, and the State Bank of Vietnam from the first quarter of 2010 to the fourth quarter of 2020 with a total 44 observations for each variable. The variables used in the study include: real GDP (Y) is the value of gross domestic product calculated at constant 2010 prices; the accurate money supply (M2) represents the monetary policy and is calculated by dividing the nominal money supply by the GDP deflator; final government consumption (GO) or government spending represents the fiscal policy and is calculated at constant prices in 2010 by dividing the value of final government consumption by accurate prices for the GDP deflator; the real lending rate (ILR) calculated by subtracting the expected inflation rate (%). In addition to the real interest rate variable, the remaining variables used the TRAMO/SEATS seasonal adjustment methods.
Research Model
This study was based on the St Louis equation that assessed the relative effectiveness of the monetary and fiscal policy. However, to overcome the limitations of the St Louis equation approach, in this study, we do not use the single-equation method but use the VAR model to solve the endogenous variables in the model. At the same time, to solve the problem of missing variables, the interest rate variable is added together with the variables identified in the St Louis equation.
First, the VAR model considering the impact of monetary policy, is set up with three variables: actual money supply (M2), real interest rate (ILR), and real GDP (Y).
This system of equations can be written in matrix form as follows:
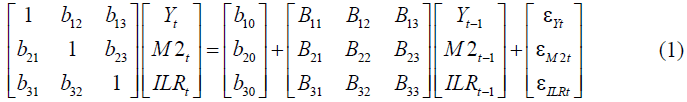
Rewriting the matrices in general form, we get:

Assuming there exists an inverse matrix B, then equation (2), after multiplying the matrix B-1 on both sides, we get:

Equation (3) can be written in the following form:

Thus, equation (4) is a reduced VAR model of order 1. The error term in the column vector et in the reduced VAR model includes structural shocks. However, the disturbances of this reduced model are often correlated, so it is necessary to transform the reduced model into a structural model. This equation is done by multiplying on the left side of both sides of equation (4) By a non-degenerate matrix A0 of order k´ k:

The matrix A0 shows the concurrent relationship between the variables in the vector Xt. Bet=A0(t indicates the relationship between the structural disturbance et and the disturbances of the reduced model (t. This type of structural model is commonly known as the AB model (Lutkepohl, 2005). However, depending on the determination of different constraints for the matrices A0 and B parameters, there are other approaches in empirical research. Among them are Sim's (1980) recursive VAR approach, Blanchard & Perotti's (2002) structural VAR approach, and Uhlig's (2005) sign binding approach.
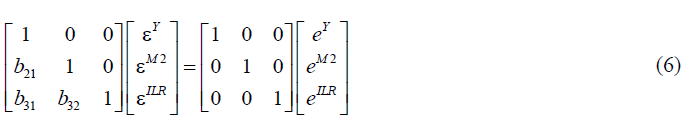
In this study, the recursive structural VAR approach analyzes the impact of fiscal and monetary policy on macroeconomic variables. According to this approach, matrix B is a unit matrix of order k, and matrix A0 is the lower triangular matrix. At the same time, the variables sorted in the VAR model depend on considering the effects of those variables on other variables in the system.
With the model for assessing the impact of monetary policy, the order of variables arranged in the model will be GDP (Y), money supply (M2), interest rate (ILR). Thus, the relationship between the disturbances of the reduced VAR form et and the disturbances of the structural VAR model et expressed as follows:
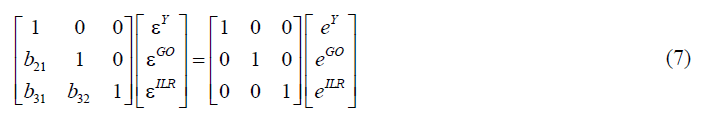
Similarly, for the model to assess the shock effect of fiscal policy, the order of variables in the model will be GDP (Y), final government consumption (GO), and lending interest rate (ILR).
In which:
M2: Real money supply, ILR: Lending Interest Rate, Y: Real gross domestic product (GDP). X: Variables in the vector, B: Unit matrix level k, A0: Non-singular matrix, k: Levels in the matrix. t: Time (in years), et: Error term in column vector t, ε: Epsilon, b: Element of the matrix, α: Alpha, Γ: Gamma.
Research Results
Unit Root Test
Before performing the VAR model estimation, the variables in the model tested for unit roots or stationary of the data series. The author is to do this, the Dickey-Fuller test (ADF) performed, the results of the ADF test for the variables summarized in Table 2.
| Table 2 ADF Unit Root Test Results |
||||
|---|---|---|---|---|
| Variable | ADF statistics | |||
| With an intercept but not a trend | With an intercept and a trend | |||
| t-Statistics | Probability | t-Statistics | Probability | |
| LNGO | -1.2119 | 0.6633 | -0.8173 | 0.9576 |
| LNM2 | -1.1426 | 0.6927 | -1.3663 | 0.8599 |
| ILR | -3.1582 | 0.0287 | -3.2878 | 0.0802 |
| LNY | -2.5528 | 0.1091 | -0.5341 | 0.9788 |
| DLNGO | -5.6055 | 0.0000 | -5.6545 | 0.0001 |
| DLNM2 | -5.5756 | 0.0000 | -5.5610 | 0.0001 |
| DILR | -6.5803 | 0.0000 | -6.5336 | 0.0000 |
| DLNY | -5.7259 | 0.0000 | -6.3012 | 0.0000 |
Table 2 showed that most variables are non-stationary in value (level) except for the real interest rate variable. This result implies a stochastic trend in these variables, and therefore, after being affected by these variables, it does not revert average or long-run value. The test results in table 2 showed that the variables all stop at the first difference with a statistical significance of 1%. Since this paper aims not to estimate the long-run relationship, the problem of co-integration is addressed. At the same time, the variables in the model transformed as increasing proportions.
The Impact of Monetary Policy on GDP
The structural VAR model is set up to analyze the impact of monetary policy on the real GDP of the economy. The author referred to as the monetary policy VAR model through a response function consisting of variables ranked in the order of magnitude, as follows: growth rate of GDP (RY); growth rate of the real money supply (RM2), and the real interest rate (ILR).
| Table 3 Tests of Optimal Lag Length of Monetary Policy Var Model |
||||||
|---|---|---|---|---|---|---|
| Lag | LogL | LR | FPE | AIC | SC | HQ |
| 0 | 167.1529 | NA | 3.57e-07 | -6.3327 | -5.8694 | -6.1569 |
| 1 | 190.2356 | 39.5702 | 2.02e-07 | -6.9075 | -6.0967 | -6.5999 |
| 2 | 215.2331 | 39.7920* | 1.06e-07 | -7.5605 | -6.4022* | -7.1210* |
| 3 | 225.5319 | 15.1328 | 1.03e-07* | -7.6135* | -6.1078 | -7.0422 |
| Note: (*) Lags are selected according to tests (statistical significance at 5% level) | ||||||
Table 3 showed that the optimal lag length chosen for the VAR model is three lags. At the same time, figure 2 through the Inverse Roots of AR Characteristic Polynomial test also shows that the eigenvalues are all within the unit circle, so the model ensures stability.

Figure 2: Stability Test of Monetary Policy Var Model
Source: Research Data
Figure 2 showed the impulse response functions (IRFs) estimated by the structural VAR model presented in figure 3. According to the order of variables listed in the model, shock1, shock2, shock3 will correspond to GDP shocks, M2 (represents monetary policy), and real interest rates.
Figure 3 showed that the variables GDP and actual money supply (RM2) react positively to these variables' shocks. These responses are only statistically significant up to the second quarter. As for the GDP variable, after the second quarter, although it still reacts positively to its shock, it is not statistically significant and tends to decrease.

Figure 3: Impulse Responses of The Monetary Policy Var Model
Source: Research Data
Figure 3 showed that GDP growth responds positively to money supply shock and is statistically significant within three quarters, having the most substantial impact on GDP in the 2nd and 3rd quarters. After the 4th quarter, the money supply shock on GDP is almost insignificant and fades away.
The response function of GDP to interest rate shock shows a negative relationship. However, the impact of interest rate shock on GDP is relatively weak and not statistically significant. This result is probably actual of the reality of the Vietnamese economy. The number of enterprises in Vietnam is quite large, but it is mainly small and medium enterprises with minimal access to capital by banks. The Government primarily guarantees State-owned enterprises or programs under the Government's public investment through designated credit packages. Thus, analyzing the response function of GDP growth to monetary policy shows a positive and statistically significant impact on economic growth. Monetary policy will impact the GDP of the economy for about 2 to 3 quarters.
The Impact of Fiscal Policy on GDP
The result of the impulse response function in the structural VAR model considers the response of the variable in the model to the shock of fiscal policy (referred to as the fiscal policy VAR model). Like the monetary policy VAR model above, the order of variables included in the model consists of RY, the Government's real final consumption growth rate representing fiscal policy (RGO), and ILR. That means shock1, shock2, shock2 in the response graphs are equivalent to shocks in GDP, fiscal policy, and interest rates. Based on the AIC criteria in Table 4, the fiscal policy VAR model was estimated with a lag length of 3.
| Table 4 Determine Optimal Lag Length of Fiscal Policy Var Model |
||||||
|---|---|---|---|---|---|---|
| Lag | LogL | LR | FPE | AIC | SC | HQ |
| 0 | 246.5127 | NA | 1.40e-08 | -9.5719 | -9.1086* | -9.3961 |
| 1 | 262.3914 | 27.2207 | 1.06e-08 | -9.8527 | -9.0419 | -9.5451 |
| 2 | 280.5506 | 28.9065 | 7.39e-09 | -10.2265 | -9.0682 | -9.7871 |
| 3 | 295.2773 | 21.6391* | 5.98e-09* | -10.4603* | -8.9545 | -9.8890* |
| Note: (*) Lags are selected according to tests (statistical significance at 5% level) | ||||||
Table 4 showed that the results of the stability test of the VAR model showed that the eigenvalues are all inside the unit circle (see figure 4). This result showed that the VAR model is stable and can perform the following steps of analysis.

Figure 4: Stability Test of Monetary Policy Var Model (Inverse Roots of Ar Characteristic Polynomial)
Source: Research Data
Figure 4 depicted the impulse response functions (IRFs) of the fiscal policy VAR model. The results of the response function analysis show that government spending (Figure RGO to shock2) has a positive response to the shock of these variables within two quarters. These effects are then insignificant and fade away after about nine quarters.
GDP has a positive and statistically significant effect up to 2 quarters on the shock of this variable itself. After that, although there was still a positive effect, it was not statistically significant (Figure RY to shock1). Interest rates have a positive response to GDP shocks. However, there was only statistical significance in the period from 2nd to 4th quarter then gradually decreased. This result showed that the demand for capital would increase when GDP increases and interest rates tend to grow. The most substantial effect of GDP shock on interest rates is through the response function in the fourth quarter (Figure ILR to shock1).
Expansionary fiscal policy positively affects GDP (Figure RY to shock2) and has the most significant effect in the second quarter. However, it is not statistically significant for the whole period and turns off shortly after four quarters. This result showed that the effectiveness of fiscal policy through changes in government spending in recent years on GDP is still limited.

Figure 5: Impulse Responses of The Fiscal Policy Var Model
Source: Research Data
Figure 5 also showed positive effects of GDP on government spending (RGO to Shock1). However, this relationship was only evident from the 3rd to 4th quarter and then gradually decreased. Through the analysis of the response function in the fiscal policy VAR model, it can be seen that the impact of fiscal policy on GDP growth is still limited, with a positive effect. Still, the degree of influence is not significant.
Conclusion
The article analyzed the current GDP growth, monetary policy, and fiscal policy in 2010-2020. Using the VAR model, the results show that monetary policy and fiscal policy positively affect GDP. GDP growth reacts positively to money supply and is statistically significant within three quarters, and has the most substantial impact on GDP in the 2nd and 3rd quarters. After the 4th quarter, the effect of money supply on GDP is almost insignificant and fades away. Fiscal policy had an impact on GDP since the second quarter and gradually disappeared from the third quarter. Still, monetary policy has a more robust and longer-lasting effect on GDP volatility than policy fiscal. Besides, the findings of this article had the same as the others, such as Omolade & Mukolu (2018); Abuselidze (2019).
The limitations briefly are that few data and many factors have not been included in the research model such as exchange rate, import, export value, inflation... Therefore, further studies should collect more multi-year data and consider many other factors affecting economic growth.
References
- Abuselidze, G. (2019). Modern challenges of monetary policy strategies: Inflation and devaluation influence on economic development of the country. Academy of Strategic Management Journal, 18(4), 1-10.
- Auerbach, A.J., & Gorodnichenko. (2012). Measuring the output responses to fiscal policy. American Economic Journal.,4(2), 1-27.
- Bernanke, B.S., & Mihov, I. (1997). What does the Bundesbank target? European Economic Review, 41(6), 1025-1053.
- Bernanke, B.S., & Mihov, I. (1998). Measuring monetary policy. Quarterly Journal of Economics, 113(3), 869-902.
- Blanchard, O., & Perotti R. (2002). An empirical characterization of the dynamic effects of change in government spending and taxes on output. Quarterly Journal of Economics, 117, 1329-1368.
- Bui, D.P. (2009). Quantitative analysis of the impact of monetary policy on some macro factors of Vietnam in the renovation period. National Economics University, Vietnam.
- Bui, T.T. (2013). Coordinating fiscal and monetary policy in solving macroeconomic issues. Review of Finance, 581(3), 15-18.
- Camen, U. (2006). Monetary policy in Vietnam: The case of a transition country. Bank for International Settlements, 31(1), 232-252.
- Carraher, S.M., & Carraher, S.C. (2006). Human resource issues among SMEs in Eastern Europe: A 30 month study in Belarus, Poland, and Ukraine. International Journal of Entrepreneurship, 10, 97.
- Christiano, L.J., & Eichenbaum, M. (1992). Identification and the liquidity effects of a monetary policy shock. Mass: IMT Press.
- Christiano, L.J., & Eichenbaum, M. (1992). Liquidity effects and the monetary transmission mechanism. American Economic Review Papers and Proceeding, 82(3), 346-353.
- Dang, H.L. (2010). The impact of the Government's economic stimulus policy: Some suggestions from the simulation by macroeconomic model', in "Shock" and the effect of the policy on the economy. Nguyen Khac Minh (Chief author), Science and Technics Publishing House.
- Dao, M.T. (2013). Coordination of fiscal and monetary policy management in several countries and policy implications for Vietnam. Review of Finance, 581(3), 12-14.
- Do, K.H., & To, T.T. (2014). Evaluation of the coordination between monetary policy and fiscal policy. The Journal of Economics and Development (JED), 200(4), 38-45.
- Drobyazko, S., Bondarevska, O., Klymenko, D., Pletenetska, S., & Pylypenko, O. (2019). Model for forming of optimal credit portfolio of the commercial bank. Journal of Management Information and Decision Sciences, 22(4), 501-506.
- Eichenbaum, M., & Evans, L.C. (1995). Some empirical evidence on the effects of shocks to monetary policy on exchange rates. Quarterly Journal of Economics, 110(4), 975-1009.
- Fourie, F.V., & Burger, P. (2003). Fiscal sustainability and the South African transformation challenge. South African Journal of Economics, 71(1),806-829.
- Fung, B.S.C. (2002). AVAR analysis of the effects of monetary policy in East Asia. BIS Working Paper, 119(1), 1-29.
- Fung, B.S.C., & Yuan, M. (1999). The stance of monetary policy. Paper presented at the conference on Money, Monetary Policy, and Transmission Mechanism, Canada.
- Goodfriend, M. (1991). Interest rate and the conduct of monetary policy. Federal Reserve Bank of Richmond Working Paper, 90(6), 1-30.
- Gordon, D.B., & Leeper, E.M. (1994). The dynamic impacts of monetary policy: An exercise in tentative identification. Journal of Political Economy, 102(6), 1228-1247.
- Ha, Q.H. (2008). Money demand and consequences for monetary policy in Vietnam. National Economics University, Hanoi, Vietnam.
- Kasa, K., & Popper, H. (1996). Monetary policy in Japan: A structural VAR approach. Journal of the Japanese and International Economies, 11(3), 275-295.
- Laurent, R.D. (1988). An interest rate-based indicator of monetary policy. Federal Bank of Chicago Economic Perspective, 12(1), 3-14.
- National Financial Supervisory Commission (2012). Assessment of the current coordination of monetary and fiscal policy coordination in Vietnam from 2008 to the present – problems and lessons learned for Vietnam. Proceeding of the National Conference: Coordination of fiscal policy and monetary policy in macroeconomic regulation, 168-174.
- Nguyen, T.K.T. (2013). Effectiveness in coordinating fiscal and monetary policy. Review of Finance, 581(3), 9-11.
- Nguyen, T.L. (2012). Coordinate fiscal policy and monetary policy under the framework of inflation targeting monetary policy. Proceeding of the National Conference: Coordination of fiscal policy and monetary policy in macroeconomic regulation, 235-242.
- Omolade, A., & Mukolu, O.M. (2018). Monetary policy dynamics and the economic growth of Sub Sahara Africa (SSA). Journal of Entrepreneurship, Business, and Economics, 6(1), 36-58.
- Omolade, A., & Ngalawa, H. (2016). Monetary policy transmission mechanism and growth of the manufacturing sectors in Libya and Nigeria. Journal of Entrepreneurship, Business, and Economics, 5(1), 67-107.
- Packard, L.A.T. (2005). Monetary policy in Vietnam: Alternatives to inflation targeting. Paper presented at CEDES/Amherst Research Conference in Buenos Aires, Aires.
- Pham, T.A. (2009). Demand stimulation and possible effects on the economy. Review of Finance, 1(531), 35-39.
- Ricci, A. (2019). Is there social or monetary dumping in the European Union? Manufacturing competitiveness in Central and Eastern Europe. Entrepreneurial Business and Economics Review, 7(1), 159-180.
- Salamzadeh, A. (2020). What constitutes a theoretical contribution? Journal of Organizational Culture, Communications, and Conflict, 24(1), 1-2.
- Schick (2005). Sustainable budget policy: Concepts and approaches. OECD Journal on Budgeting, 5(1), 107-126.
- Shun, R. (2014). What measures Chinese monetary policy. Paper presented at the CES 2014 China Annual Conference, China.
- Sim, C.A. (1992). Interpreting the macroeconomic time series facts: The effects of monetary policy. European Economic Review, 36(5), 975-1000.
- Sims, C. (1980). Macroeconomics and reality. Econometrica, 48(1), 1-48.
- The Ministry of Finance (2020). Annual report in the period 2010-2020. Hanoi, Vietnam
- The National Assembly (2010). Law No. 46/2010/QH12 Law on the State Bank of Vietnam. Hanoi, Vietnam.
- The State Bank of Vietnam (2010-2020). Report on the banking industry in 2010-2020. Hanoi, Vietnam.
- The State Bank of Vietnam (2015). Circular No. 42/2015/TT-NHNN Regulations on open market operations. Hanoi, Vietnam.
- The State Bank of Vietnam (2018). Decision No.1158/Q