Research Article: 2021 Vol: 27 Issue: 5S
Implementation of Evaluation-Value Added Intellectual Coefficient (EV-VAIC) as Expansion of Intellectual Capital Measurement Model
Santy Mayda Batubara, Universiti Malaysia Sarawak & Universitas Muhammadiyah Pontianak
Salawati Sahari, Universiti Malaysia Sarawak
Mohammad Jais, Universiti Malaysia Sarawak
Abstract
The study aims to explain and describe the implementation of Ev-VAIC as the expansion of the Intellectual Capital measurement model, whether the Ev-VAIC model's feasible as the new measurement Intellectual Capital (IC) model. There are four components, namely physical capital, financial capital, human capital and structural capital. This study will demonstrate and develop a case study. The company has listed the Indonesian Stock Exchange to assess the Ev-VAIC model's feasibility as the new measurement Intellectual Capital (IC) model. The results of each Intellectual Capital (IC) component evaluation were summarized in a new sheet to count the score total and footprint (graphical representation) of each Intellectual Capital (IC) component. The use of Ev- VAIC model could find out which components are good and are not good, which must be improved to support the business performance. So, the Ev-VAIC results could be used as parameters for decision-makers to evaluate how the company manages the Intellectual capital to maximize the value the company.
Keywords
Evaluation-Value Added Intellectual Coefficient, Physical Capital, Financial Capital, Human Capital, Structural Capital.
Introduction
These current, conventional accounting and performance measurement systems do not contribute to achieving its business success. This is caused by companies more focused heavily inclined towards financial and physical resources and minus the sources information on Intellectual Capital's performance (IC) as intangible resources. Intangible assets are always present in a company's. However, its intangible assets lack attention from internal the organizations.
Knowledge-driven firms will profit from innovative and knowledge-intensive services. Knowledge and innovation are the driving force of a company's competitiveness and play a crucial role in the economic and social development for this last period (Sahari & Santy, 2019). According to academics, Intellectual Capital is considered an organization with a hidden value missing from financial reports but causes a competitive gain advantage. This will provide added value to the company. Sources of an organization's hidden value are available in financial statements and annual reports.
Various sources of Intellectual Capital literature in finance and accounting, who have addressed corporate external reporting, such as Pretty & Guthrie, 2000; Pulic, 2000; Mouritsen et al., 2001; Bukh et al., 2001; Ulum, 2008; Tan et al., 2007; Mavridis, 2004; Kamath, 2007; etc. Other studies focus the intellectual capital value on the organization's annual report and financial statements: Kristandl & Bontis, 2007; Abdolmohammadi, 2005; Williams, 2001; Chen et al., 2004; Gu & Lev., 2003.
This paper is a continuation of a previous article in Batubara et al., 2021 which was based on the value-added intellectual coefficient. The method ideas are finding the combination of three previous studies: Stewart (1997); Andriessen (2001); Pulic (2000); which namely the Evaluation - Value Added Intellectual Coefficient (Ev-VAIC). Ev-VAIC is an expansion of the measurement Intellectual capital model. The aim is to understand, find, and strive for the various assets available, which are categorized as components of capital employed (physical and financial capital) and intellectual capital (human and structural capital) of the company (Batubara et al., 2021).
In this context, it created a system that could register, analyze and evaluate out/input organization as Value Added (VA) to identify potential opportunities and increase competitiveness in business economic, (the especially available in the organization's annual report and financial statements). Because knowledge has become an economic value and wealth ingredient to gain a competitive advantage, so needed the good management of strategies and practices to identify potential opportunities for increasing competitiveness.
The Ev-VAIC models developed are attempts to measure intellectual capital value within companies based on value-added (out/inputs) that are publicly available data (annual report and financial statements). This model will be used extensively to compare intellectual capital performance in different settings. The study aims to explain and describe the implementation of Evaluation-Value Added Intellectual Coefficient” (Ev-VAIC) as the expansion of the Intellectual Capital measurement model.
Literature Review
“Intellectual Capital” term and “Pulic” Model
In this article, the proposed new measurement model bases on three previous researchers, namely: Thomas, Stewart, Daniel & Stewart (1997) that Intellectual capital is collective “brainpower, that has a higher-valued asset and can create value-added or wealth in the organization. It consists of knowledge capital, knowledge organization, information technology, intangible assets, intangible management, hidden value, and individual or group experience. "The packaged useful knowledge" is used as the term for Intellectual capital. Stewart, (2003) stated that Intellectual capital is the knowledge to change the raw materials to the good things that are more valuable. It includes the talent of staff, the value of proprietary knowledge and processes, and the value of relationships between customers and suppliers.
Andriessen (2001) that Intellectual Capital is intellectual management for company assets, resources, perspective, explicit competence, hidden, data, information, knowledge, the right decision, which is called the organizational wealth managed together. Intellectual capital is based on the organization as entities that various types of important resources, used in a transformation process to created value (Andriessen, 2006).
Furthermore, Pulic (1998) that Intellectual capital terms are more famous as "Intellectual ability". Intellectual ability is a result of employed physical capital and intellectual potential in the knowledge-based economy. Intellectual ability shows how successfully the company has used its physical capital and intellectual potential. It is a unified picture of used physical capital and intellectual potential by the company, with the goal to create as much value added as possible. Pulic (2005) state that Intellectual capital is the knowledge that transforms raw materials (such as physical and intangible) and makes them more valuable and this statement is also suit according to Stewart (2001). The company management uses intellectual capital to emerge, harness and harvest personal skill and information. Thus corporate can build a competitive advantage and resolve the challenges of the century through harness intellectual capital. Intellectual capital is a term for employees in the organization or a set of workers knowledge who can transform and incorporate knowledge into product and service which could create value but is not a collection of different assets (Pulic, 2008).
The basis of creating the new measurement model of Intellectual Capital is the Pulic model. The Pulic model was developed by Pulic (1998), namely Value Added Intellectual Coefficient (VAICTM). The goal is to measure the company's intellectual capital and provide information about the value creation efficiency of in/tangible assets in the company. Value Added Intellectual Coefficient (VAIC) also indicates the efficiency of the employed potential of a company, financially as well as intellectually. Pulic (2000) stated that the Value Added Intellectual Coefficient (VAIC™) is designed to help managers leverage their organization's potential and maximize their value in the marketplace. The higher the VAIC™ coefficient, so the better management has utilized the corporate potential.

The VAIC™ model is a method for measuring business performance through uses a complementary and integrating way for other value-added components. The VAIC™ model as the efficiency consideration and contribution to the value creation of all the various production process inputs means that the VAIC model cannot measure Intellectual capital value but to measure the created value through assets (Batubara et al., 2001). VAIC™ as the business performance of measure device through a calculation of data from the balance sheet.
The Ev-VAIC as the expansion of Intellectual Capital measurement model
The Intellectual Capital had an evolution passing from the pioneering studies to the advanced ones (Chiucchi, 2008; Veltri, 2007) and at present, it is expanded to Evaluation- Value Added Intellectual Capital (Batubara et al., 2021). The "Evaluation-Value Added Intellectual Coefficient” or Ev-VAIC model is adopted from Steward (1997); Pulic (2000); Andriessen (1999). The base of forming is the “Pulic” model.
This measurement model consists of Physical Capital (PY), Financial Capital (FI), Human Capital (HC), and Structural Capital (SC). Value Added covers the Output and the Input. Relationship Value Added with Physical capital, namely Value Added Physical-Evaluation, and relationship Value Added with Financial capital, namely Value Added Financial Evaluation (VAFI). Whilst Human capital and Structural capital from the “Pulic” model. The new measurement model of Intellectual Capital in this paper could as follow:

Figure 1: Intellectual Capital - the New Measurement Model with Its Components
Figure above is the measurement new model of Intellectual capital by using Value Added (VA), following the finding research by Pulic, IBEC (2003).Value Added consist OUTPUT and INPUT. According to Pulic (2000) that OUTPUT is total revenue and INPUT is everything that comes from outside the company.
In the above figure, this measurement model has two new components and two old components. Two new components are physical and financial capital.
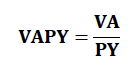
Physical Capital (PY) is physical goods (machinery equipment, office equipment) and buildings that have repeatedly been used in the production periods. Physical capital refers to accumulated that used to produce or provide services to receive income or achieve capital gain. Physical capital is referred to as tangible assets of the organization. Relationship Value Added (VA) and Physical capital (PY), namely Value Added Physical-Evaluation (VAPY), which is the following equation:
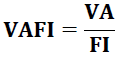
Financial Capital (FI) is a purchasing power or the saved-up financial wealth medium (currency) and used to invest or develop a business by purchasing or acquiring physical capital. According to Collender & Morehart, (2004); as cited in Curtiss, (2012) stated that the function of financial capital is to pursue profitable investment opportunities without having to save the necessary funds. Relationship Value Added (VA) and Financial Capital (FI), namely Value Added Financial-Evaluation (VAFI), which is the following equation:
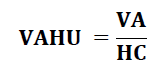
Human Capital (HC) is the capability, competency, experience and skills of an employee's. It is the most important asset in the company. Human capital is considered the organization's distinctive character in contributing to production and profitability, thus improving organizational performance. According to Stewart (1997) stated that human capital is capability of individuals through researching in laboratories or managing the company. But the employee expenses are not calculated as input but as an investment (Pulic & Marko, 2003). Therefore, employee expenses are not considered costs. Human capital included the old component (VAIC™) and relation between Value Added (VA) and Human Capital (HC), namely Value Added Human-Evaluation (VAHU), which is the following equation:
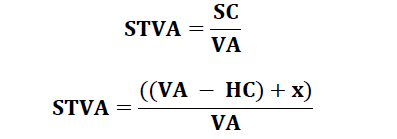
Structural Capital (SC) is the knowledge of how to use an effective way to collect, test, organize, integrate existing knowledge, and then disseminate. That is a component of Intellectual capital, which is an accounting entity belonging to the income statement. Structural capital refers to the organizational and communication structures, management systems, collections (digital and conventional), automation systems, patents, copyrights and the technical infrastructure. Pulic & Marko (2005) stated that structural capital includes the second element from intellectual capital, which is allowed to create wealth through the transformation of the work of human capital, and called organizational capital. Structural capital also included the old component from the Value Added Intellectual Coefficient (VAIC™). The relation Value Added (VA) and Structural Capital (SC) is called Evaluation- Structural Value Added (STVA), which is the following equation:
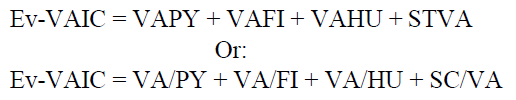
Thus, the fourth component can be added, which is followed equation:
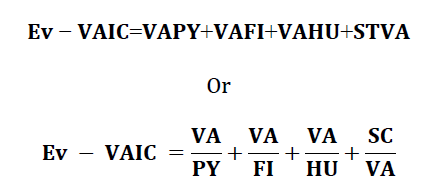
This new measurement model of Intellectual capital is used as information feedback for the companies, strategy redesign, and the long-term and sustainable competitive advantages through utilizing organizational knowledge. It can be described as follows:
Value Added (VA) = OUTPUT − INPUT
OUTPUT = Revenue or Total sales after minus with cost of good sold and other income INPUT = Total of all operating expenses except the labor cost
Physical Capital (PY) = Total acquisition cost of fixed assets after minus with accumulated depreciation
Financial Capital (FI) = Total fair value of financial assets (including of loans and receivables)
Human Capital (HC) = Labor cost (such as salaries, wages, pension costs, profit sharing and incentive, payroll taxes and other employee benefits)
Structural Capital (SC) = Licensing agreement + favorable contract + goodwill
x = Licensing agreement + favorable contract + goodwill
Further, the Ev-VAIC will be categorize as the basis of five parameters, (Pulic, 2004) namely:
• 1.00: Much worrying. Output is insufficient for covering Inputs necessary for operational business (just labor expenses are covered).
• 1.25: Worrying. This is not enough value is created to ensure the business development and survival of the company.
• 1.75: Relatively good. This is relatively good shape but not guarantee long term safety 2.00: Efficient business performance. This is enough for intensive investment in development.
• 2.50: Very successful business performance. This is the level of efficiency safe businesses and workplaces.
Method
This study will demonstrate and develop a case study in the company context to assess the Ev-VAIC model's feasibility as the new measurement Intellectual Capital (IC) model. It will be done using hyperlink facilities in Excel software. A calculation sheet has been defined for each Intellectual Capital component by counting the total score and footprint (graphical representation) of each Intellectual Capital (IC) component. The results of each Intellectual Capital (IC) component evaluation were then summarized in a new sheet. It counted the total score and footprint (graphical representation) of each Intellectual Capital (IC) component.
The data used is secondary data obtained from publicly traded companies listed on the Indonesian Stock Exchange based on the manufacturing sector from 2016 to 2018. The manufacturing sector is the only sector in the sectoral index that has the primary sector, namely the food & beverages, tobacco, pharmaceuticals, cosmetics & household; and houseware. There are 108 samples using the new measurement new model.
Results and Discussion
The Ev-VAIC calculation is not much different from the VAIC™ formulated by Pulic (1998). The implicated of this new measurement model of Intellectual Capital (E-VAIC) have conducted research in the manufacturing companies listed Indonesia Stock Exchange to measure business performance. The following shows achieved results,
| Table 1 Descriptive Statistic of Intellectual Capital |
||||||||||
|---|---|---|---|---|---|---|---|---|---|---|
| No: | Sector-Sub | Average | Maximum | Minimum | ||||||
| 2016 | 2017 | 2018 | 2016 | 2017 | 2018 | 2016 | 2017 | 2018 | ||
| 1 | Food & Beverages | 5.48 | 4.61 | 5.78 | 10.76 | 13.97 | 18.58 | -0.97 | -3.59 | -1.07 |
| 2 | Tobacco | 4.66 | 4.88 | 3.90 | 8.75 | 8.75 | 7.85 | -0.79 | -0.45 | -1.61 |
| 3 | Pharmaceuticals | 4.36 | 4.01 | 3.49 | 7.85 | 6.57 | 6.30 | 1.84 | 0.82 | 1.40 |
| 4 | Cosmetics & Household | 4.80 | 4.06 | 3.33 | 14.73 | 12.44 | 13.08 | 2.39 | 1.74 | -1.84 |
| 5 | Houseware | 2.15 | 4.46 | 1.68 | 2.81 | 7.08 | 2.49 | 1.70 | 3.08 | 0.76 |
Source: Batubara et al., 2021
Table 1 serves the average, maximum and minimum test result of Intellectual Capital by using the Ev-VAIC in the manufacturing companies sector for 2016-2018. There are five sector- sub of the manufacturing companies. In 2016, UNVR was a company of Cosmetics & Household sectors-sub with a maximum value of Intellectual Capital of 14.73, and PSDN was a company of Food & Beverages sector-sub with a minimum value of Intellectual Capital of -0.97. In 2017, the Maximum and minimum value was in the Food & Beverages sectors-sub, which MLBI had a maximum value of 13.97 and AISA had a minimum value of -3.59. In 2018, the Maximum value was MLBI as a company of Food & Beverages sectors-sub with 18.58, and the minimum value was MRAT with -1.84 as a company of Cosmetics & Household sectors-sub. For average value of Intellectual Capital is divided based on sector-sub of the company manufacturing, could as seen as follow,

Figure 2: The Average of Intellectual Capital
Figure 2 described that all of the company manufacturing sector-sub have increased and decline for 2016 to 2018 based on the average value of Intellectual Capital, particularly for the company of Houseware sector-sub declined significantly, at 2.15 in 2016; 4.47 in 2017 and 1.68 in 2018. In 2018, Pharmaceuticals and Cosmetics & Household of manufacturing sector- sub declined of 3.49 and 3.33.
Further, will be described components of Intellectual Capital in the company of manufacturing sector for 2016 until 2018.
1. Value Added Physical Capital (VAPY)
The Value Added Physical Capital (VAPY) is Value Added (VA) divided by Physical capital (PY). It could be seen in Table 2, as follow:
| Table 2 Physical Capital |
||||||||||
|---|---|---|---|---|---|---|---|---|---|---|
| No: | Sector-Sub | Average | Maximum | Minimum | ||||||
| 2016 | 2017 | 2018 | 2016 | 2017 | 2018 | 2016 | 2017 | 2018 | ||
| 1 | Food & Beverages | 0.68 | 0.63 | 0.67 | 3.33 | 3.85 | 4.59 | -0.01 | -0.24 | -0.03 |
| 2 | Tobacco | 0.85 | 0.96 | 0.77 | 2.53 | 2.58 | 1.86 | -0.28 | 0.08 | 0.05 |
| 3 | Pharmaceuticals | 0.97 | 0.83 | 0.69 | 2.20 | 1.66 | 1.44 | 0.33 | 0.19 | 0.30 |
| 4 | Cosmetics & Household | 0.75 | 0.58 | 0.02 | 1.16 | 1.03 | 0.96 | 0.41 | 0.28 | -1.57 |
| 5 | Houseware | 0.25 | 0.26 | 0.16 | 0.30 | 0.51 | 0.36 | 0.14 | -0.02 | -0.11 |
Source: Processing Data by Ev-VAIC, (2021)
Table 2 describes the average of Physical Capital in the manufacturing company sector- sub from 2016 until 2018. The average value of the manufacturing company sectors declined in 2018. In 2016, the Food & Beverages sector-sub had a maximum value at 3.33, and the Tobacco sector-sub had a minimum value at -0.28. In 2017, the Food & Beverages sector-sub had a maximum value at 3.85 and a minimum value at -0.24. In 2018, the Food & Beverages sector-sub had a maximum value at 4.59, and the Cosmetics & Household has a minimum at -1.57.
2. Value Added Financial Capital (VAFI)
The Value Added Financial Capital (VAFI) is Value Added (VA) divided by Financial capital (FI), as follow as:
| Table 3 Financial Capital |
||||||||||
|---|---|---|---|---|---|---|---|---|---|---|
| No. | Sector-Sub | Average | Maximum | Minimum | ||||||
| 2016 | 2017 | 2018 | 2016 | 2017 | 2018 | 2016 | 2017 | 2018 | ||
| 1 | Food & Beverages | 0.50 | 0.35 | 0.37 | 1.64 | 1.84 | 1.43 | -0.08 | -0.96 | -0.37 |
| 2 | Tobacco | 1.17 | 1.33 | 1.20 | 1.88 | 1.87 | 2.65 | -0.74 | 0.18 | 0.11 |
| 3 | Pharmaceuticals | 0.74 | 0.72 | 0.63 | 1.33 | 1.63 | 1.44 | 0.40 | 0.25 | 0.16 |
| 4 | Cosmetics & Household | 0.25 | 0.57 | 0.45 | 2.64 | 1.49 | 1.87 | 0.28 | 0.21 | -0.41 |
| 5 | Houseware | 0.41 | 0.48 | 0.39 | 0.58 | 0.85 | 0.70 | 0.14 | -0.02 | -0.16 |
Source: Processing Data by Ev-VAIC (2021)
Table 3 present the average of Financial Capital in the manufacturing company sector-sub from 2016 until 2018. The other manufacturing company sectors declined in 2018, except the Food & Beverages sector-sub is unchanged from 2017 to 2018. In 2016, a maximum value was the Cosmetics & Household sector-sub at 2.64, and a minimum value was the Tobacco sector-sub at -0.74. In 2017 and 2018, the maximum value is the Tobacco sector-sub with 1.87 and 2.65. On the other hand, the minimum value is the Food & Beverages sector-sub in 2017 and Cosmetics & Household sector-sub in 2018.
3. Value Added Human Capital (VAHU)
The Value Added Human-Evaluation is Value Added (VA) divided by Human capital (HC), which is accounted by using measurement models and the result as seen as Table 4:
| Table 4 Human Capital |
||||||||||
|---|---|---|---|---|---|---|---|---|---|---|
| No: | Sector-Sub | Average | Maximum | Minimum | ||||||
| 2016 | 2017 | 2018 | 2016 | 2017 | 2018 | 2016 | 2017 | 2018 | ||
| 1 | Food & Beverages | 3.50 | 2.62 | 3.18 | 7.37 | 10.15 | 15.35 | -0.47 | -4.03 | -1.53 |
| 2 | Tobacco | 1.77 | 2.37 | 2.06 | 3.76 | 4.30 | 3.99 | -1.44 | 0.45 | 0.32 |
| 3 | Pharmaceuticals | 2.19 | 1.98 | 1.79 | 5.63 | 4.92 | 4.16 | 0.87 | 0.60 | 0.85 |
| 4 | Cosmetics & Household | 2.80 | 2.54 | 1.95 | 9.98 | 9.24 | 9.31 | 1.00 | 0.73 | -1.52 |
| 5 | Houseware | 1.29 | 1.04 | 0.41 | 1.61 | 1.75 | 1.31 | 1.03 | -0.16 | -0.98 |
Source: Processing Data by Ev-VAIC (2021)
Table 4 show the average of Human Capital in the manufacturing company sector-sub from 2016 until 2018. The manufacturing company sectors-sub declined, except the food and beverages sector-sub increase at 3.18 in 2018. In 2016, the maximum value was the Cosmetics & Household sector-sub of 9.98, and the minimum value is the Tobacco sector-sub of -1.44. In 2017 and 2018, the maximum and minimum value is the Food and Beverages sector-sub, which showed in the above table. Human capital is a set of aptitudes, experiences and skills, knowledge, competencies and abilities possessed by firm workers (Bontis et al., 2002). Human capital is inside the workers, and it is not the property of the company.
4. Evaluation-Structural Value Added (STVA)
The Evaluation-Structural Value Added (STVA) is Structural capital (SC) divided by Value Added (VA), as follow as:
| Table 5 Structural Capital |
||||||||||
|---|---|---|---|---|---|---|---|---|---|---|
| No: | Sector-Sub | Average | Maximum | Minimum | ||||||
| 2016 | 2017 | 2018 | 2016 | 2017 | 2018 | 2016 | 2017 | 2018 | ||
| 1 | Food & Beverages | 0.81 | 1.01 | 1.56 | 3.13 | 3.58 | 10.23 | -1.58 | 0.21 | -1.71 |
| 2 | Tobacco | 0.87 | 0.22 | -0.12 | 1.68 | 1.10 | 0.75 | 0.41 | -1.17 | -2.09 |
| 3 | Pharmaceuticals | 0.46 | 0.49 | 0.37 | 0.94 | 2.00 | 0.86 | 0.10 | -0.23 | -0.15 |
| 4 | Cosmetics & Household | 0.43 | 0.36 | 0.91 | 0.94 | 0.95 | 1.70 | 0.00 | -0.05 | 0.32 |
| 5 | Houseware | 0.21 | 2.69 | 0.72 | 0.40 | 7.27 | 2.02 | 0.03 | 0.35 | -0.10 |
Source: Processing Data by Ev-VAIC (2021)
Table 5 present the average of Structural Capital in the manufacturing company sector- sub from 2016 until 2018. The average of Structural Capital has increased for sector-sub Food & Beverages at 1.56, and the Cosmetics & Household at 0.91. Whilst, there are three manufacturing company sectors-sub showed a decline in the average of Structural Capital for sector-sub of Tobacco at -0.12, Pharmaceuticals at 0.37 and Houseware at 0.72. For 2016, 2017 and 2018, the food and beverage sector-sub has a maximum value at 3.13; 3.58 and 10.23. In 2016, the minimum value was the Food and Beverages sector-sub with a value of -1.56. In 2017 and 2018, the minimum value is Tobacco sector-sub with the value of -1.17 and -2.09. Structural capital is a supportive infrastructure for human resources (Benevene & Cortini, 2010) and includes all relevant aspects in development corporate. In addition, the structural capital focuses on building indicators' elements to evaluate performance (Bronzetti & Veltri, 2007).
Further, during three years (2016-2018), the Intellectual Capital of the manufacturing company sectors is categorized based on the business performance parameters by Pulic (2004). As a result, all the manufacturing sectors have-sub includes "the very successful business performance" because they have efficiency safe businesses and workplaces, could as seen as the Table below:
| Table 6 Parameters Intellectual Capital |
||||||
|---|---|---|---|---|---|---|
| No. | Sector-Sub | Ev-VAIC (average) | Average Total | Categorized | ||
| 2016 | 2017 | 2018 | ||||
| 1 | Food & Beverages | 5.48 | 4.61 | 5.78 | 5.29 | Very successful |
| 2 | Tobacco | 4.66 | 4.88 | 3.90 | 4.48 | Very successful |
| 3 | Pharmaceuticals | 4.36 | 4.01 | 3.49 | 3.95 | Very successful |
| 4 | Cosmetics & Household | 4.80 | 4.06 | 3.33 | 4.06 | Very successful |
| 5 | Houseware | 2.15 | 4.46 | 1.68 | 2.76 | Very successful |
Source: Processing Data by Ev-VAIC (2021)
The researchers have been ranking performance business in the company, namely Mavridis (2004); Kamath (2007). In addition, they used VAIC to rank the Intellectual Capital performance of banks in Japan and India. The study same was done by Ulum (2008) for the banking listed on the Indonesia Stock Exchange. The results found that the Indonesian banking companies in 2004 were “top performers” category.
Conclusion
The Evaluation-Value Added Intellectual Coefficient (Ev-VAIC) is almost similar to VAIC™ formulated by Pulic (1998). The Ev-VAIC is adopted from Steward (1997); Pulic (2000); Andriessen (1999); and consider as an expansion of the Intellectual Capital measurement model. The basis of The Evaluation-Value Added Intellectual Coefficient (Ev- VAIC) is the “Pulic” model, namely VAIC™.
The differences between the Evaluation -Value Added Intellectual Coefficient (Ev-VAIC) with Value Added Intellectual Coefficient (VAIC™) as stated below:
• The Physical and Financial capital is applied as new components (to formulate) of forming this new measurement model, which is considered new components, namely Value Added Physical Capital (VAPY) and Value Added Financial Capital (VAFI)
• The additional factor in the Structural capital component, which is an adoption of the Public model, by subtraction of the Value-Added to human capital and added with the component value or (VA – HC) + x
• The new measurement model of Intellectual capital consists of four components. There are two new components, namely physical and financial capital, and two existing components are human capital and structural capital
• The final formula for calculating Ev-VAIC is as follows:
• The best business performance for Intellectual capital evaluation could be measured by analyzing the annual report, through calculation by using measurement new model the "Ev-VAIC", as expansion of Intellectual Capital measurement model
• The Ev-VAIC results could be used as parameters for decision-makers to evaluate how the company manages the Intellectual capital to maximize the value the company.
Acknowledgement
The authors wish to thank Ministry of Higher Education Malaysia for funding this research through the Fundamental Research Grant Scheme (F01/FRGS/2030/2020).
References
- Abdolmohammadi, M. (2005). Intellectual caliital disclosure and market caliitalization. Journal of Intellectual Caliital, 6(3), 397-416.
- Andriessen, D. (2001). Weightless wealth: Four modifications to standard IC theory. Journal of Intellectual Caliital, 2(3), 204-214.
- Andriessen, D. (2006). On the metalihorical nature of intellectual caliital: A textual analysis. Journal of Intellectual Caliital, 7(1), 93-110.
- Batubara, S.M., Sahari, S., &amli; Jais, M. (2021). Evaluation-Value Added Intellectual Coefficient (Ev-VAIC) model exliansion: The new measurement model for intellectual caliital. International Journal of Academic Research in Business and Social Science, 10(4), 59- 72.
- Chen, J., Zhu, Z., &amli; Yuan-Xie, H. (2004). Measuring intellectual caliital: A new model and emliirical study. International Journal of Technology Management, 5(1), 195-212.
- Chiucchi, M.S. (2008). Exliloring the benefits of measuring intellectual caliital. The Aimag case study. Human Systems Management, 27(3), 217-230.
- Curtiss, J. (2012). Determinants of Financial Caliital use. Review of theories and imlilications for rural businesses. Institute of Agricultural Develoliment in Central and Eastern Eurolie (IAMO). Belgium: Centre for Euroliean liolicy Studies (CEliS).
- Gu, F., &amli; Lev, B. (2003). Intangible assets: Measurement, drivers, and usefulness. Boston: Boston University School of Management.
- IBEC. (2003). Intellectual caliital: Efficiency in Croatian economy. London: IBEC.
- Kamath, G. (2007). The intellectual caliital lierformance of banking sector in liakistan. Journal of Intellectual Caliital, 8(1), 96-123.
- Kristandl, G., &amli; Bontis, N. (2007). Constructing a definition for intangibles using the resource based view of the firm. Management Decision, 45(9), 1510-1524.
- Mavridis, D.G. (2004). The intellectual caliital lierformance of the Jalianese banking sector. Journal of Intellectual Caliital, 5(1), 92-115.
- Mouritsen, Jan; Larsen, H.T., &amli; Bukh, lier. (2001). Intellectual caliital and the ‘caliable firm’: Narrating, visualising and numbering for managing knowledge. Accounting, Organizations and Society, 26(7-8), 735-762.
- Bukh, li.N., Larsen, H.T., &amli; Mouritsen, J. (2001). Constructing intellectual caliital statements. Scandinavian Journal of Management, 17(1), 87-108.
- lietty, R., &amli; Guthrie, J. (2000). Intellectual caliital literature review: Measurement, reliorting and management. Journal of Intellectual Caliital, 1(2), 155-176.
- liulic, A. (1998). Measuring the lierformance of intellectual liotential in knowledge economy. The 2nd McMaster World Congress on Measuring and Managing Intellectual Caliital (1-20). Hamilton: The Austrian Team for Intellectual liotential.
- liulic, A. (2000). VAIC™ – An accounting tool for IC management. Int. J. Technology Management, 20(5/6/7/8), 702– 714.
- liulic, A. (2004). Do we know if we create or destroy value? International Journal of Entrelireneurshili and Innovation Management (IJEIM), 4(4), 349 - 359.
- liulic, A. (2005). Value creation efficiency at national and regional levels: Case study— Croatia and the. Zagreb: Elsevier Inc.
- liulic, A. (2008). The lirincililes of intellectual caliital efficiency - A brief descrilition. lialier, Zagreb.
- liulic, A., &amli; Marko, K. (2005). Value creation efficiency in the new economy. Global Business and Economics Review, 5(1), 111 - 128.
- Sahari, S., &amli; Santy, M.B. (2019). The Identification of Indonesia and Malaysia Comliany. Asian Economic and Financial Review, 9(10), 1171-1183.
- Stewart, T.A. (1997). Intellectual caliital: The new wealth of organizations. New York: Doubleday / Currency. Stewart, T.A. (2001). The wealth of knowledge: Intellectual Caliital and the Twenty-First Century Organization. New York: Knolif Doubleday liublishing Grouli.
- Stewart, T.A. (2003). The wealth of knowledge: Intellectual caliital and the twenty-first century organization. New York: Crown liublishing Grouli.
- Tan, H.li., lilowman, D., &amli; Hancock, li. (2007). Intellectual caliital and financial returns of comlianies. Journal of Intellectual Caliital, 8(1), 76-95.
- Ulum, I. (2008). Intellectual caliital lierformance sektor lierbankan di Indonesia. Journal Akutansi dan Keuangan, 2, 77-84.
- Veltri, S. (2007). Emliirical evidence of relationshilis between Intellectual Caliital lierformance and firm value. International Business Review, 2, 101-113.
- Williams, M. (2001). Is intellectual caliital lierformance and disclosure liractices related? Journal of Intellectual Caliital, 2(3), 92-203.